Races in Marlborough, New York (NY) Detailed Stats
Ancestries, Foreign-born residents, place of birth
6.3% of Marlborough, NY residents are foreign-born (3.3% born in Europe, 1.9% born in Latin America, 1.0% born in Asia), which is 251.6% less than the foreign-born rate of 22.0% across the entire state of New York.
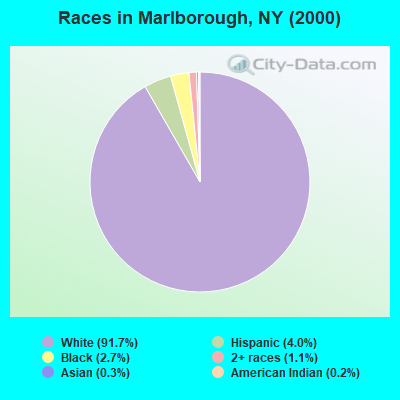
Race distribution in Marlborough

- 7,57991.7%White alone
- 3294.0%Hispanic
- 2242.7%Black alone
- 881.1%Two or more races
- 270.3%Asian alone
- 130.2%American Indian alone
- 20.02%Other race alone
- 10.01%Native Hawaiian and Other
Pacific Islander alone
2000
2022
-
- 11,760,98162.0%White alone
- 2,867,58315.1%Hispanic
- 2,812,62314.8%Black alone
- 1,035,9265.5%Asian alone
- 366,1161.9%Two or more races
- 75,4990.4%Other race alone
- 52,4990.3%American Indian alone
- 5,2300.03%Native Hawaiian and Other
Pacific Islander alone

-
- 10,408,93352.9%White alone
- 3,867,29919.7%Hispanic
- 2,633,84013.4%Black alone
- 1,776,2869.0%Asian alone
- 732,6703.7%Two or more races
- 216,1101.1%Other race alone
- 35,0820.2%American Indian alone
- 6,9310.04%Native Hawaiian and Other
Pacific Islander alone

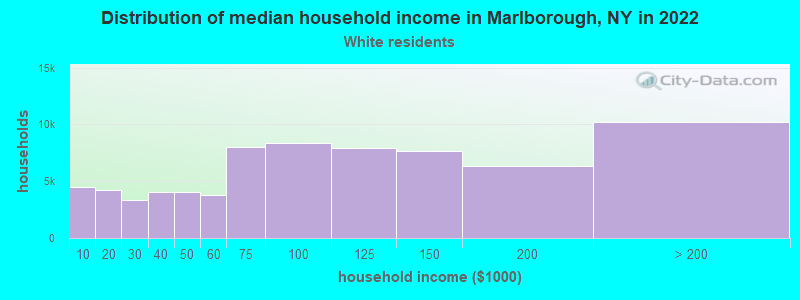
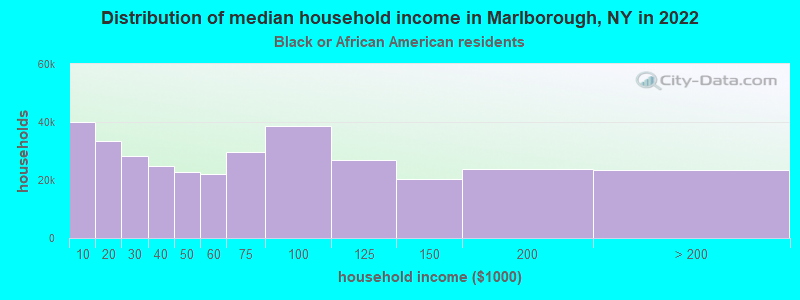
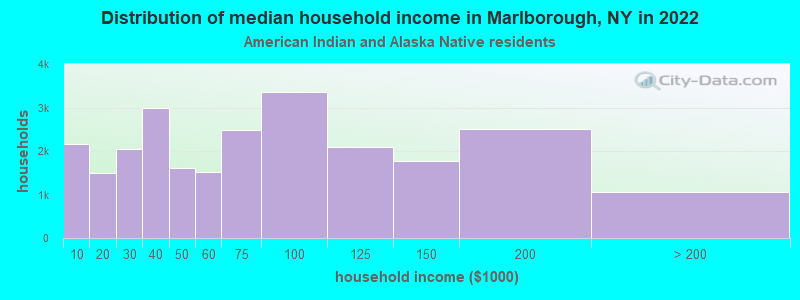
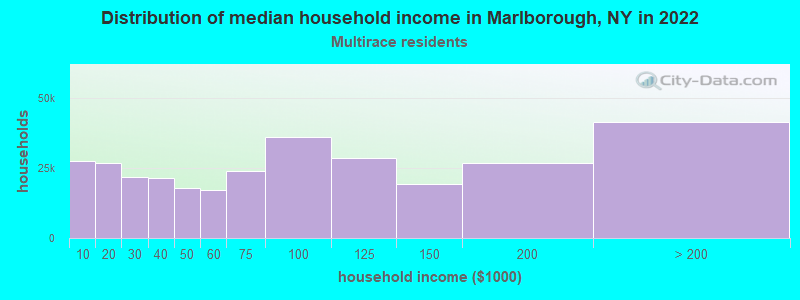
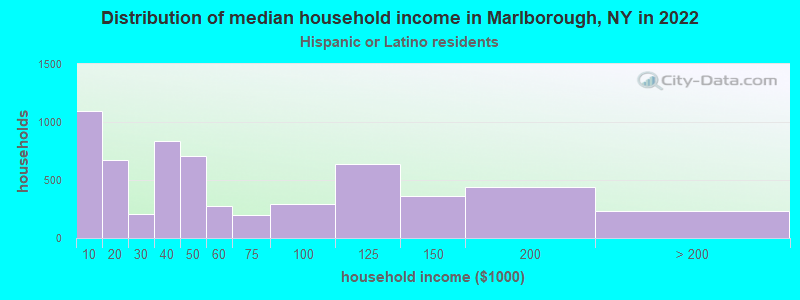
Income and house value in Marlborough
- Median household income in 2022
- $99,805White non-Hispanic householders
- $39,012Black householders
- $72,062American Indian and Alaska Native householders
- $43,520Asian householders
- $11,137Some other race householders
- $49,308Two or more races householders
- $35,643Hispanic or Latino race householders
- Median 2022 house value
- $430,520White Non-Hispanic householders
- $491,289Black or African American householders
- $415,706Asian householders
- $295,982Some other race householders
- $429,613Hispanic or Latino householders
Household income for White non-Hispanic householders
Household income for Black householders
Household income for American Indian and Alaska Native householders
Household income for Asian householders
Household income for Two or more races householders
Household income for Hispanic or Latino race householders
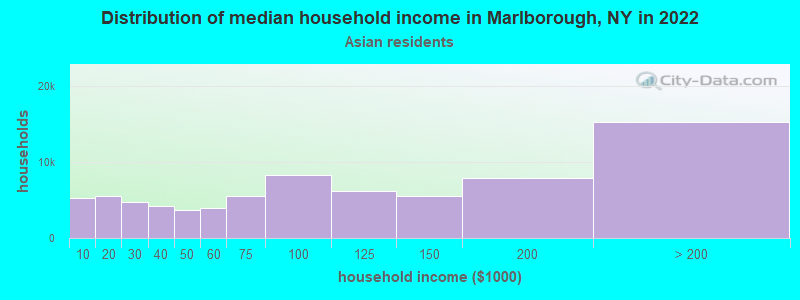
Foreign-born residents in Marlborough
517 residents are foreign born (3.3% Europe, 1.9% Latin America, 1.0% Asia).
| This city: | 6.3% |
| New York: | 20.4% |
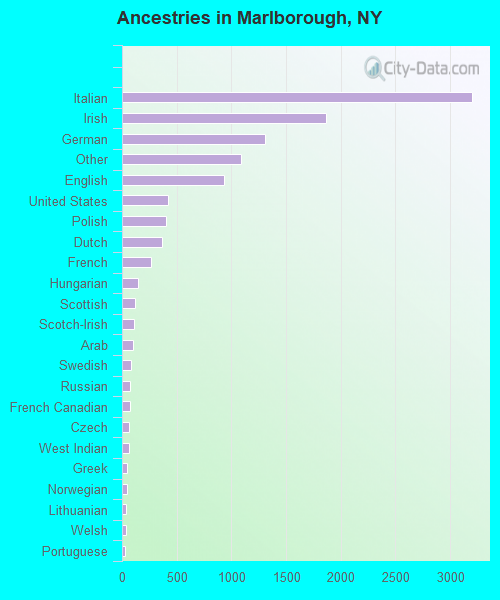
Ancestries in Marlborough

- 3,19629.2%Italian
- 1,86717.1%Irish
- 1,30812.0%German
- 1,0849.9%Other
- 9348.5%English
- 4213.9%United States
- 4053.7%Polish
- 3633.3%Dutch
- 2632.4%French
- 1431.3%Hungarian
- 1231.1%Scottish
- 1101.0%Scotch-Irish
- 990.9%Arab
- 790.7%Swedish
- 760.7%Russian
- 700.6%French Canadian
- 670.6%Czech
- 620.6%West Indian
- 480.4%Greek
- 450.4%Norwegian
- 370.3%Lithuanian
- 370.3%Welsh
- 310.3%Portuguese
- 290.3%Ukrainian
- 140.1%Danish
- 120.1%Swiss
- 60.05%Slovak
Zip codes: 12542.