Races in Marquette, Michigan (MI) Detailed Stats
Data:
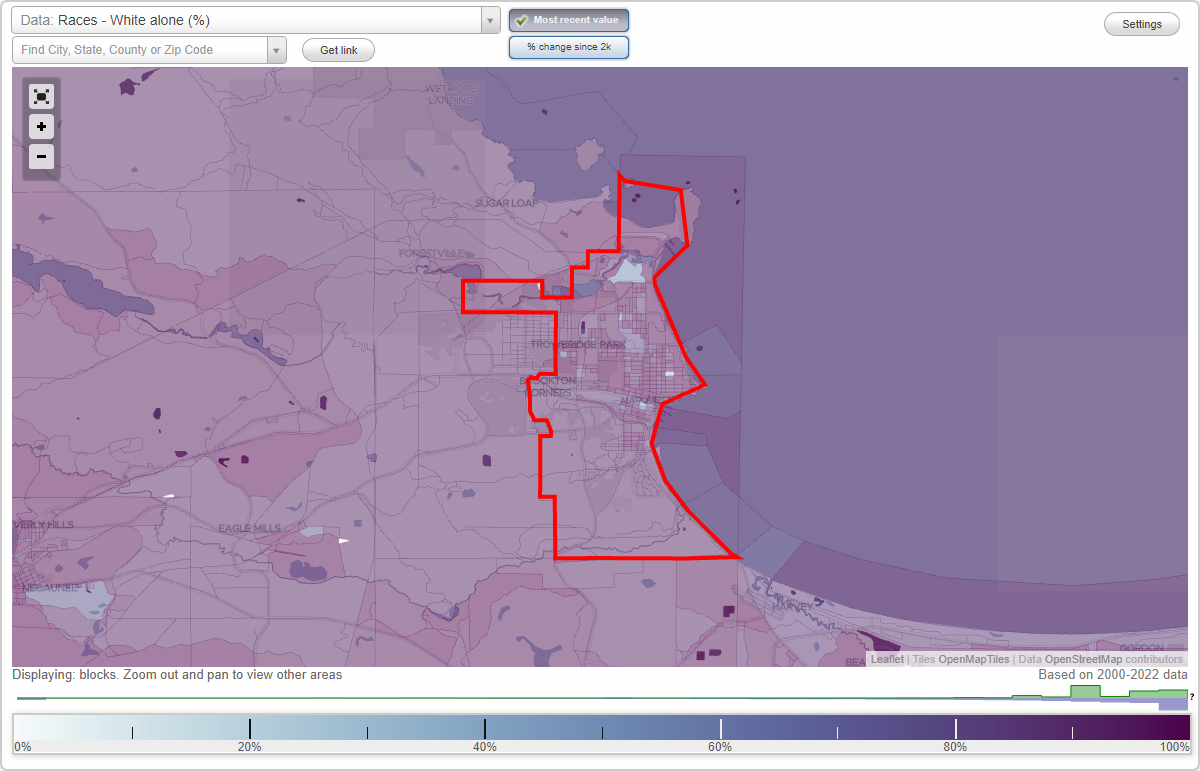
Races - White alone (%)
Races - White alone (% change since 2000)
Races - Black alone (%)
Races - Black alone (% change since 2000)
Races - American Indian alone (%)
Races - American Indian alone (% change since 2000)
Races - Asian alone (%)
Races - Asian alone (% change since 2000)
Races - Hispanic (%)
Races - Hispanic (% change since 2000)
Races - Native Hawaiian and Other Pacific Islander alone (%)
Races - Native Hawaiian and Other Pacific Islander alone (% change since 2000)
Races - Two or more races(%)
Races - Two or more races(% change since 2000)
Races - Other race alone (%)
Races - Other race alone (% change since 2000)
Racial diversity
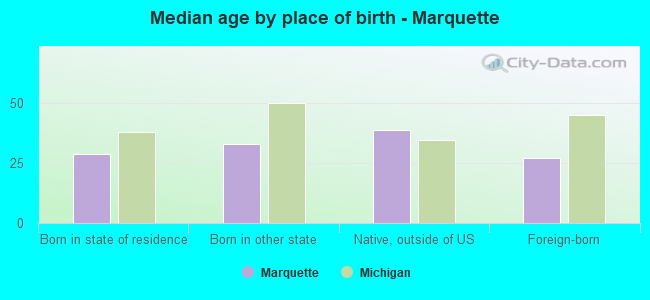
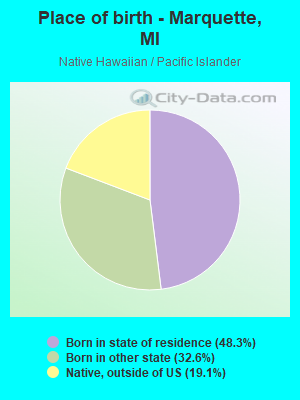
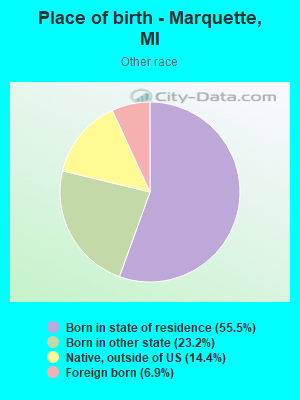
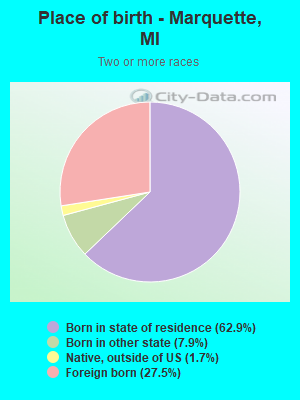
Place of birth - Born in state of residence (%)
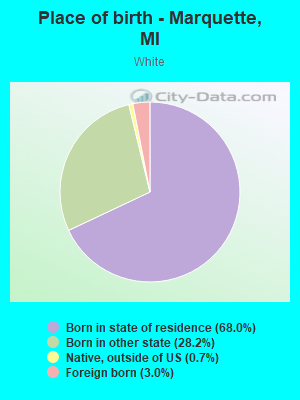
Place of birth - Born in state of residence (%) - White
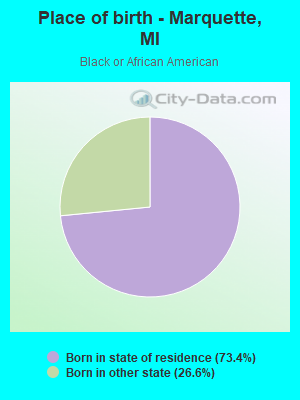
Place of birth - Born in state of residence (%) - Black or African American
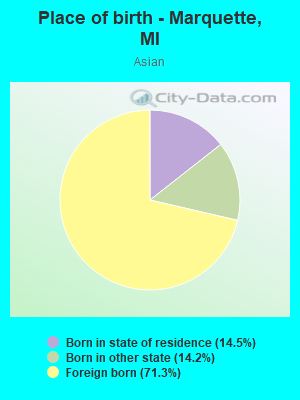
Place of birth - Born in state of residence (%) - Asian
Place of birth - Born in state of residence (%) - Hispanic or Latino
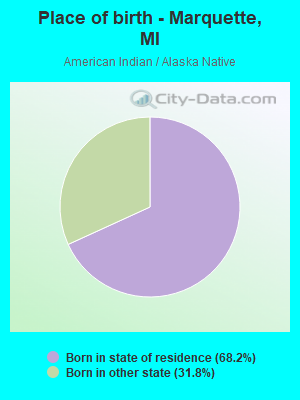
Place of birth - Born in state of residence (%) - American Indian and Alaska Native
Place of birth - Born in state of residence (%) - Multirace
Place of birth - Born in state of residence (%) - Other Race
Place of birth - Born in other state (%)
Place of birth - Born in other state (%) - White
Place of birth - Born in other state (%) - Black or African American
Place of birth - Born in other state (%) - Asian
Place of birth - Born in other state (%) - Hispanic or Latino
Place of birth - Born in other state (%) - American Indian and Alaska Native
Place of birth - Born in other state (%) - Multirace
Place of birth - Born in other state (%) - Other Race
Place of birth - Native, outside of US (%)
Place of birth - Native, outside of US (%) - White
Place of birth - Native, outside of US (%) - Black or African American
Place of birth - Native, outside of US (%) - Asian
Place of birth - Native, outside of US (%) - Hispanic or Latino
Place of birth - Native, outside of US (%) - American Indian and Alaska Native
Place of birth - Native, outside of US (%) - Multirace
Place of birth - Native, outside of US (%) - Other Race
Place of birth - Foreign born (%)
Place of birth - Foreign born (%) - White
Place of birth - Foreign born (%) - Black or African American
Place of birth - Foreign born (%) - Asian
Place of birth - Foreign born (%) - Hispanic or Latino
Place of birth - Foreign born (%) - American Indian and Alaska Native
Place of birth - Foreign born (%) - Multirace
Place of birth - Foreign born (%) - Other Race
Residents speaking English at home (%)
Residents speaking English at home - Born in the United States (%)
Residents speaking English at home - Native, born elsewhere (%)
Residents speaking English at home - Foreign born (%)
Residents speaking Spanish at home (%)
Residents speaking Spanish at home - Born in the United States (%)
Residents speaking Spanish at home - Native, born elsewhere (%)
Residents speaking Spanish at home - Foreign born (%)
Residents speaking other language at home (%)
Residents speaking other language at home - Born in the United States (%)
Residents speaking other language at home - Native, born elsewhere (%)
Residents speaking other language at home - Foreign born (%)
Marital status - Never married (%)
Marital status - Now married (%)
Marital status - Separated (%)
Marital status - Widowed (%)
Marital status - Divorced (%)
Ancestries Reported - Arab (%)
Ancestries Reported - Czech (%)
Ancestries Reported - Danish (%)
Ancestries Reported - Dutch (%)
Ancestries Reported - English (%)
Ancestries Reported - French (%)
Ancestries Reported - French Canadian (%)
Ancestries Reported - German (%)
Ancestries Reported - Greek (%)
Ancestries Reported - Hungarian (%)
Ancestries Reported - Irish (%)
Ancestries Reported - Italian (%)
Ancestries Reported - Lithuanian (%)
Ancestries Reported - Norwegian (%)
Ancestries Reported - Polish (%)
Ancestries Reported - Portuguese (%)
Ancestries Reported - Russian (%)
Ancestries Reported - Scotch-Irish (%)
Ancestries Reported - Scottish (%)
Ancestries Reported - Slovak (%)
Ancestries Reported - Subsaharan African (%)
Ancestries Reported - Swedish (%)
Ancestries Reported - Swiss (%)
Ancestries Reported - Ukrainian (%)
Ancestries Reported - United States (%)
Ancestries Reported - Welsh (%)
Ancestries Reported - West Indian (%)
Ancestries Reported - Other (%)
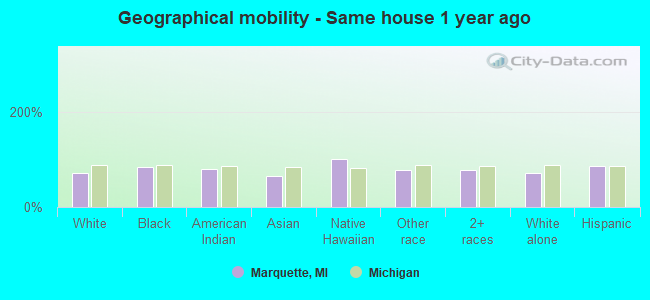
Geographical mobility - Same house 1 year ago (%)
Geographical mobility - Same house 1 year ago (%) - White
Geographical mobility - Same house 1 year ago (%) - Black or African American
Geographical mobility - Same house 1 year ago (%) - Asian
Geographical mobility - Same house 1 year ago (%) - Hispanic or Latino
Geographical mobility - Same house 1 year ago (%) - American Indian and Alaska Native
Geographical mobility - Same house 1 year ago (%) - Multirace
Geographical mobility - Same house 1 year ago (%) - Other Race
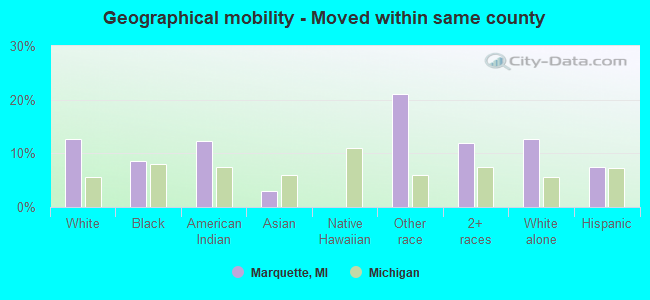
Geographical mobility - Moved within same county (%)
Geographical mobility - Moved within same county (%) - White
Geographical mobility - Moved within same county (%) - Black or African American
Geographical mobility - Moved within same county (%) - Asian
Geographical mobility - Moved within same county (%) - Hispanic or Latino
Geographical mobility - Moved within same county (%) - American Indian and Alaska Native
Geographical mobility - Moved within same county (%) - Multirace
Geographical mobility - Moved within same county (%) - Other Race
Geographical mobility - Moved from different county within same state (%)
Geographical mobility - Moved from different county within same state (%) - White
Geographical mobility - Moved from different county within same state (%) - Black or African American
Geographical mobility - Moved from different county within same state (%) - Asian
Geographical mobility - Moved from different county within same state (%) - Hispanic or Latino
Geographical mobility - Moved from different county within same state (%) - American Indian and Alaska Native
Geographical mobility - Moved from different county within same state (%) - Multirace
Geographical mobility - Moved from different county within same state (%) - Other Race
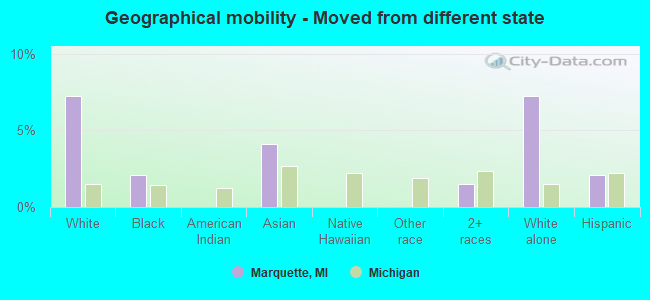
Geographical mobility - Moved from different state (%)
Geographical mobility - Moved from different state (%) - White
Geographical mobility - Moved from different state (%) - Black or African American
Geographical mobility - Moved from different state (%) - Asian
Geographical mobility - Moved from different state (%) - Hispanic or Latino
Geographical mobility - Moved from different state (%) - American Indian and Alaska Native
Geographical mobility - Moved from different state (%) - Multirace
Geographical mobility - Moved from different state (%) - Other Race
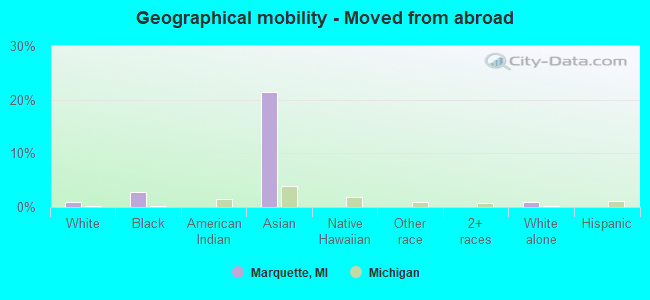
Geographical mobility - Moved from abroad (%)
Geographical mobility - Moved from abroad (%) - White
Geographical mobility - Moved from abroad (%) - Black or African American
Geographical mobility - Moved from abroad (%) - Asian
Geographical mobility - Moved from abroad (%) - Hispanic or Latino
Geographical mobility - Moved from abroad (%) - American Indian and Alaska Native
Geographical mobility - Moved from abroad (%) - Multirace
Geographical mobility - Moved from abroad (%) - Other Race
Place of birth for the foreign-born population - Ireland (%)
Place of birth for the foreign-born population - Denmark (%)
Place of birth for the foreign-born population - Norway (%)
Place of birth for the foreign-born population - Sweden (%)
Place of birth for the foreign-born population - United Kingdom (%)
Place of birth for the foreign-born population - England (%)
Place of birth for the foreign-born population - Scotland (%)
Place of birth for the foreign-born population - Other Northern Europe (%)
Place of birth for the foreign-born population - Austria (%)
Place of birth for the foreign-born population - Belgium (%)
Place of birth for the foreign-born population - France (%)
Place of birth for the foreign-born population - Germany (%)
Place of birth for the foreign-born population - Netherlands (%)
Place of birth for the foreign-born population - Switzerland (%)
Place of birth for the foreign-born population - Other Western Europe (%)
Place of birth for the foreign-born population - Greece (%)
Place of birth for the foreign-born population - Italy (%)
Place of birth for the foreign-born population - Portugal (%)
Place of birth for the foreign-born population - Spain (%)
Place of birth for the foreign-born population - Other Southern Europe (%)
Place of birth for the foreign-born population - Albania (%)
Place of birth for the foreign-born population - Belarus (%)
Place of birth for the foreign-born population - Bosnia and Herzegovina (%)
Place of birth for the foreign-born population - Bulgaria (%)
Place of birth for the foreign-born population - Croatia (%)
Place of birth for the foreign-born population - Czechoslovakia (%)
Place of birth for the foreign-born population - Hungary (%)
Place of birth for the foreign-born population - Latvia (%)
Place of birth for the foreign-born population - Lithuania (%)
Place of birth for the foreign-born population - North Macedonia (Macedonia) (%)
Place of birth for the foreign-born population - Moldova (%)
Place of birth for the foreign-born population - Poland (%)
Place of birth for the foreign-born population - Romania (%)
Place of birth for the foreign-born population - Russia (%)
Place of birth for the foreign-born population - Serbia (%)
Place of birth for the foreign-born population - Ukraine (%)
Place of birth for the foreign-born population - Other Eastern Europe (%)
Place of birth for the foreign-born population - China (%)
Place of birth for the foreign-born population - Hong Kong (%)
Place of birth for the foreign-born population - Taiwan (%)
Place of birth for the foreign-born population - Japan (%)
Place of birth for the foreign-born population - Korea (%)
Place of birth for the foreign-born population - Other Eastern Asia (%)
Place of birth for the foreign-born population - Afghanistan (%)
Place of birth for the foreign-born population - Bangladesh (%)
Place of birth for the foreign-born population - India (%)
Place of birth for the foreign-born population - Iran (%)
Place of birth for the foreign-born population - Kazakhstan (%)
Place of birth for the foreign-born population - Nepal (%)
Place of birth for the foreign-born population - Pakistan (%)
Place of birth for the foreign-born population - Sri Lanka (%)
Place of birth for the foreign-born population - Uzbekistan (%)
Place of birth for the foreign-born population - Other South Central Asia (%)
Place of birth for the foreign-born population - Burma (%)
Place of birth for the foreign-born population - Cambodia (%)
Place of birth for the foreign-born population - Indonesia (%)
Place of birth for the foreign-born population - Laos (%)
Place of birth for the foreign-born population - Malaysia (%)
Place of birth for the foreign-born population - Philippines (%)
Place of birth for the foreign-born population - Singapore (%)
Place of birth for the foreign-born population - Thailand (%)
Place of birth for the foreign-born population - Vietnam (%)
Place of birth for the foreign-born population - Other South Eastern Asia (%)
Place of birth for the foreign-born population - Armenia (%)
Place of birth for the foreign-born population - Iraq (%)
Place of birth for the foreign-born population - Israel (%)
Place of birth for the foreign-born population - Jordan (%)
Place of birth for the foreign-born population - Kuwait (%)
Place of birth for the foreign-born population - Lebanon (%)
Place of birth for the foreign-born population - Saudi Arabia (%)
Place of birth for the foreign-born population - Syria (%)
Place of birth for the foreign-born population - Turkey (%)
Place of birth for the foreign-born population - Yemen (%)
Place of birth for the foreign-born population - Other Western Asia (%)
Place of birth for the foreign-born population - Eritrea (%)
Place of birth for the foreign-born population - Ethiopia (%)
Place of birth for the foreign-born population - Kenya (%)
Place of birth for the foreign-born population - Somalia (%)
Place of birth for the foreign-born population - Uganda (%)
Place of birth for the foreign-born population - Zimbabwe (%)
Place of birth for the foreign-born population - Other Eastern Africa (%)
Place of birth for the foreign-born population - Cameroon (%)
Place of birth for the foreign-born population - Congo (%)
Place of birth for the foreign-born population - Democratic Republic of Congo (Zaire) (%)
Place of birth for the foreign-born population - Other Middle Africa (%)
Place of birth for the foreign-born population - Egypt (%)
Place of birth for the foreign-born population - Morocco (%)
Place of birth for the foreign-born population - Sudan (%)
Place of birth for the foreign-born population - Other Northern Africa (%)
Place of birth for the foreign-born population - South Africa (%)
Place of birth for the foreign-born population - Other Southern Africa (%)
Place of birth for the foreign-born population - Cabo Verde (%)
Place of birth for the foreign-born population - Ghana (%)
Place of birth for the foreign-born population - Liberia (%)
Place of birth for the foreign-born population - Nigeria (%)
Place of birth for the foreign-born population - Senegal (%)
Place of birth for the foreign-born population - Sierra Leone (%)
Place of birth for the foreign-born population - Other Western Africa (%)
Place of birth for the foreign-born population - Australia (%)
Place of birth for the foreign-born population - New Zealand (%)
Place of birth for the foreign-born population - Fiji (%)
Place of birth for the foreign-born population - Micronesia (%)
Place of birth for the foreign-born population - Bahamas (%)
Place of birth for the foreign-born population - Barbados (%)
Place of birth for the foreign-born population - Cuba (%)
Place of birth for the foreign-born population - Dominica (%)
Place of birth for the foreign-born population - Dominican Republic (%)
Place of birth for the foreign-born population - Grenada (%)
Place of birth for the foreign-born population - Haiti (%)
Place of birth for the foreign-born population - Jamaica (%)
Place of birth for the foreign-born population - St. Vincent and the Grenadines (%)
Place of birth for the foreign-born population - Trinidad and Tobago (%)
Place of birth for the foreign-born population - West Indies (%)
Place of birth for the foreign-born population - Other Caribbean (%)
Place of birth for the foreign-born population - Belize (%)
Place of birth for the foreign-born population - Costa Rica (%)
Place of birth for the foreign-born population - El Salvador (%)
Place of birth for the foreign-born population - Guatemala (%)
Place of birth for the foreign-born population - Honduras (%)
Place of birth for the foreign-born population - Mexico (%)
Place of birth for the foreign-born population - Nicaragua (%)
Place of birth for the foreign-born population - Panama (%)
Place of birth for the foreign-born population - Other Central America (%)
Place of birth for the foreign-born population - Argentina (%)
Place of birth for the foreign-born population - Bolivia (%)
Place of birth for the foreign-born population - Brazil (%)
Place of birth for the foreign-born population - Chile (%)
Place of birth for the foreign-born population - Colombia (%)
Place of birth for the foreign-born population - Ecuador (%)
Place of birth for the foreign-born population - Guyana (%)
Place of birth for the foreign-born population - Peru (%)
Place of birth for the foreign-born population - Uruguay (%)
Place of birth for the foreign-born population - Venezuela (%)
Place of birth for the foreign-born population - Other South America (%)
Place of birth for the foreign-born population - Canada (%)
Place of birth for the foreign-born population - Other Northern America (%)
Place of birth for the foreign-born population - Other (%)
Latest news about races in Marquette, MI collected exclusively by city-data.com from local newspapers, TV, and radio stations
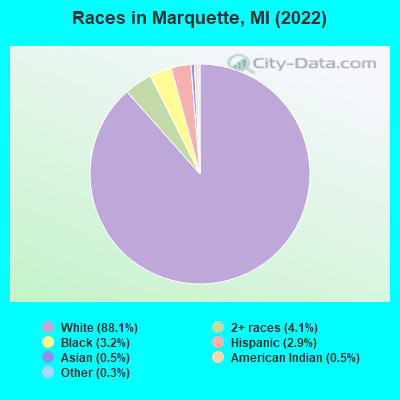
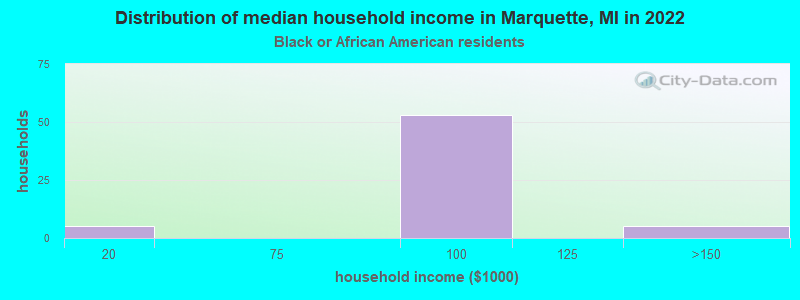
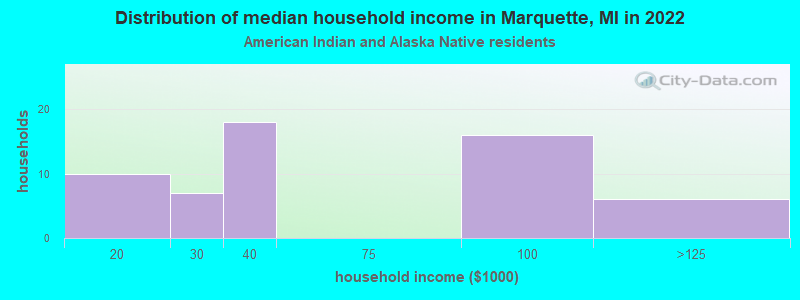
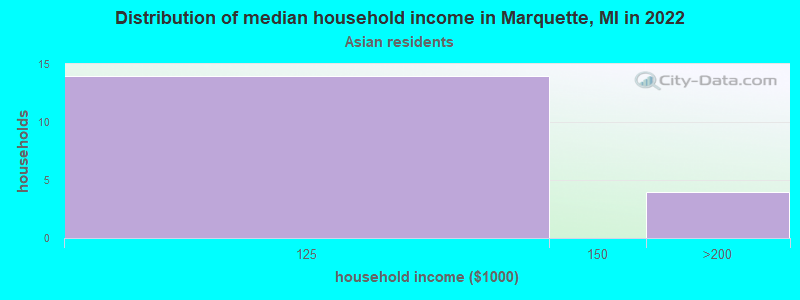
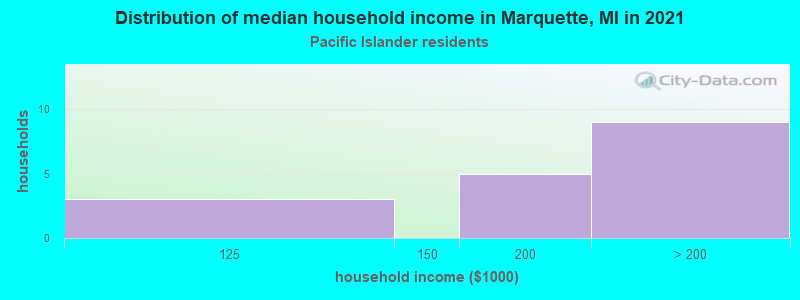
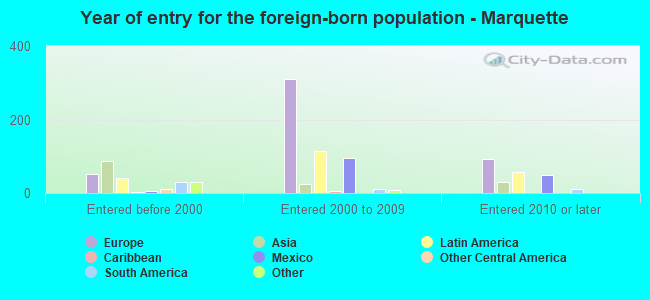
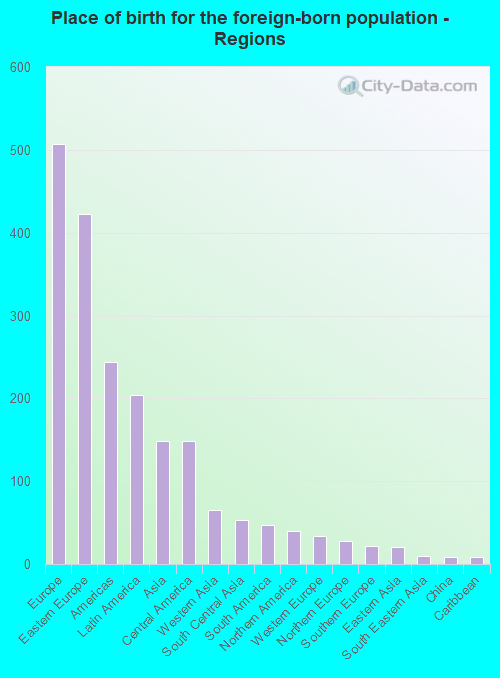
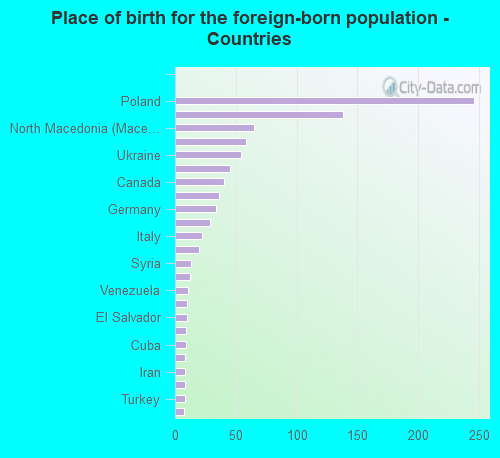
According to 2022 data, the most numerous races in Marquette, MI are White alone (18,172 residents), Black alone (655 residents), and Hispanic (601 residents). 94.5% of Marquette residents speak English at home. 4.3% of Marquette, MI residents are foreign-born (2.5% born in Europe, 1.0% born in Latin America, 0.7% born in Asia), which is 38.4% less than the foreign-born rate of 6.0% across the entire state of Michigan.
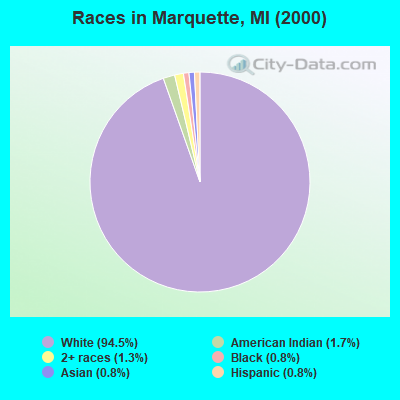
Race distribution in Marquette
2000 2022
7,806,691 78.6% White alone 1,402,047 14.1% Black alone 323,877 3.3% Hispanic 175,311 1.8% Asian alone 163,487 1.6% Two or more races 53,421 0.5% American Indian alone 11,465 0.1% Other race alone 2,145 0.02% Native Hawaiian and Other
7,289,051 72.6% White alone 1,310,464 13.1% Black alone 572,405 5.7% Hispanic 450,031 4.5% Two or more races 335,732 3.3% Asian alone 45,217 0.5% Other race alone 29,011 0.3% American Indian alone 2,207 0.02% Native Hawaiian and Other
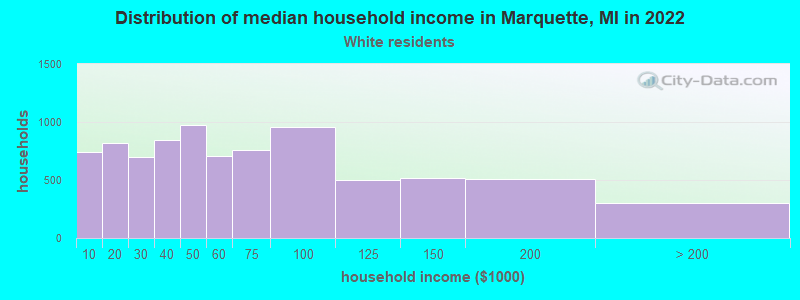
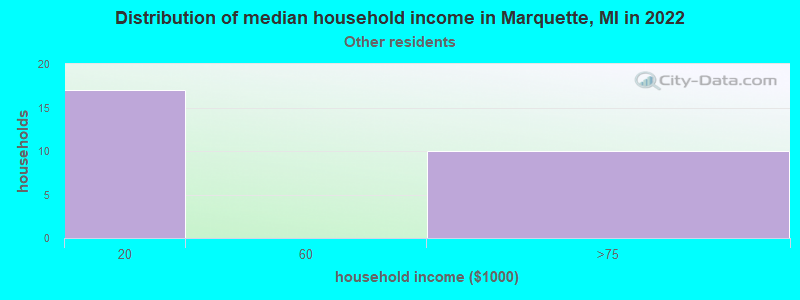
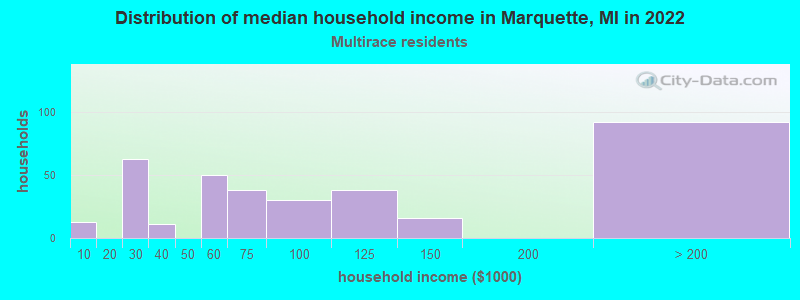
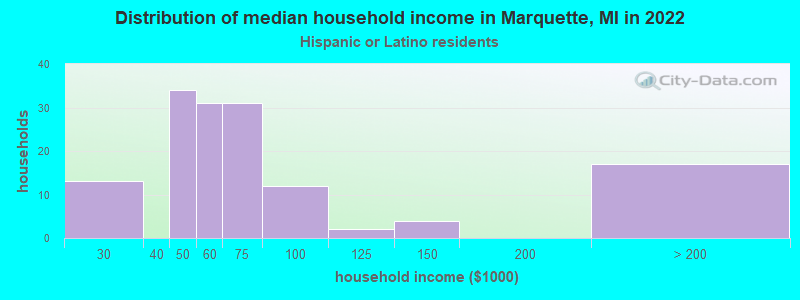
Income and house value in Marquette Median household income in 2022 $50,106 White non-Hispanic householders$71,234 Two or more races householders$57,315 Hispanic or Latino race householdersMedian 2022 house value $261,100 White Non-Hispanic householders$284,671 Black or African American householders$223,627 American Indian or Alaska Native householders $415,524 Asian householders$203,984 Two or more races householders
Median age by race in Marquette
30.7 Median age for White residents30.8 30.4 31.2 Median age for Black or African American residents29.4 70.1 14.4 Median age for American Indian / Alaska Native residents12.8 39.2 35.0 Median age for Asian residents53.9 29.7 68.5 Median age for Native Hawaiian / Pacific Islander residents69.0 -666,666,666.0 24.8 Median age for Other race residents-713,178,293.9 23.7 28.1 Median age for Two or more races residents24.8 28.1 30.9 Median age for White alone residents30.9 30.6 29.8 Median age for Hispanic or Latino residents33.2 28.9
Owner/renter occupied households by race in Marquette
House owners and renters - White residents 3,765 44.2% Owner occupied4,753 55.8% Renter occupiedHouse owners and renters - Black or African American residents 3 28.5% Owner occupied8 71.5% Renter occupiedHouse owners and renters - American Indian / Alaska Native residents 40 31.4% Owner occupied88 68.6% Renter occupiedHouse owners and renters - Asian residents 21 100.0% Owner occupiedHouse owners and renters - Native Hawaiian / Pacific Islander residents 6 66.8% Owner occupied3 33.2% Renter occupiedHouse owners and renters - Other race residents 9 31.4% Owner occupied19 68.6% Renter occupiedHouse owners and renters - Two or more races residents 183 44.8% Owner occupied226 55.2% Renter occupiedHouse owners and renters - White alone residents 3,763 44.2% Owner occupied4,742 55.8% Renter occupiedHouse owners and renters - Hispanic or Latino residents 54 39.7% Owner occupied82 60.3% Renter occupied
Language usage in Marquette
English speakers - Total 94.5% of residents of Marquette speak English at home.
2.2% of residents speak Spanish at home 288 66.2% Speak English very well147 33.8% Speak English less than very well3.2% of residents speak other language at home 472 74.2% Speak English very well164 25.8% Speak English less than very well
English speakers - Born in the United States 95.6% of residents of Marquette speak English at home.
1.2% of residents speak Spanish at home 57 91.9% Speak English very well5 8.1% Speak English less than very well3.0% of residents speak other language at home 60 39.7% Speak English very well91 60.3% Speak English less than very well
English speakers - Native, born elsewhere 52.1% of residents of Marquette speak English at home.
9.5% of residents speak Spanish at home 16 100.0% Speak English very well38.5% of residents speak other language at home 65 100.0% Speak English very well
English speakers - Foreign-born 39.4% of residents of Marquette speak English at home.
23.6% of residents speak Spanish at home 97 45.5% Speak English very well116 54.5% Speak English less than very well35.0% of residents speak other language at home 248 78.7% Speak English very well67 21.3% Speak English less than very well
White (Caucasian) - Speak only English Native:
97.4% (17,024)Foreign-born:
55.5% (317)
White (Caucasian) - Speak another language Native:
2.7% (477)Foreign-born:
21.6% (123)
Asian - Speak only English Native:
77.4% (24)Foreign-born:
14.9% (12)
Asian - Speak another language Native:
20.7% (7)Foreign-born:
85.0% (67)
Other race - Speak another language Native:
28.3% (25)Foreign-born:
100.0% (6)
Two or more races - Speak only English Native:
90.3% (871)Foreign-born:
8.2% (22)
Two or more races - Speak another language Native:
9.2% (89)Foreign-born:
92.7% (250)
White alone - Speak only English Native:
97.5% (16,995)Foreign-born:
54.3% (320)
White alone - Speak another language Native:
2.6% (456)Foreign-born:
20.7% (122)
Hispanic or Latino - Speak another language Native:
31.4% (101)Foreign-born:
100.0% (208)
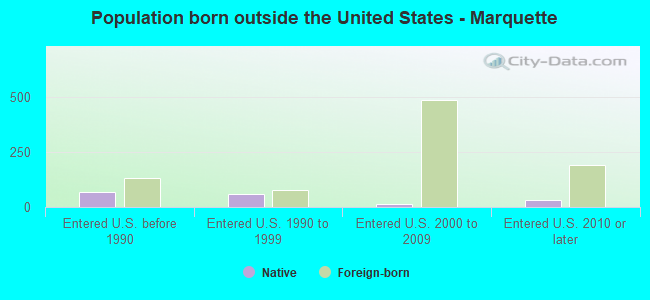
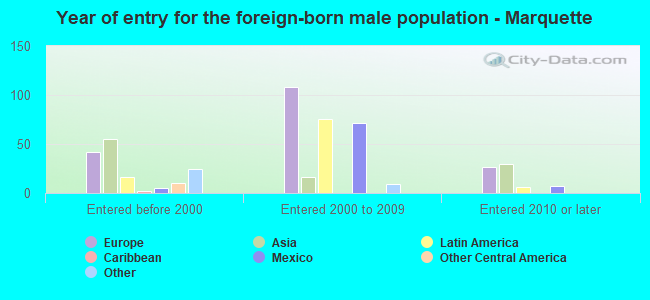
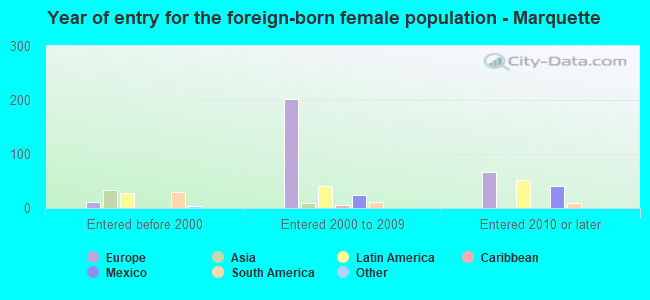
Foreign-born residents in Marquette 900 residents are foreign born (2.5% Europe , 1.0% Latin America , 0.7% Asia ).
This city:
4.3%Michigan:
6.9%
Marital status for residents in Marquette Marital status - White (Caucasian) population 15 years and over
Males 57.8% Never married32.2% Now married0.1% Separated2.9% Widowed7.0% DivorcedFemales 51.3% Never married32.6% Now married0.3% Separated6.7% Widowed9.2% DivorcedWomen who gave birth in the past 12 months Now married:
86.6% (109)Unmarried:
13.4% (17)
Women who did not give birth in the past 12 months Now married:
19.8% (1,102)Unmarried:
80.2% (4,451)
Marital status - Black or African American population 15 years and over
Males 79.6% Never married8.3% Now married3.4% Separated0.0% Widowed8.7% DivorcedFemales 75.0% Never married10.7% Now married5.4% Separated0.0% Widowed8.9% DivorcedWomen who did not give birth in the past 12 months Now married:
12.5% (4)Unmarried:
87.5% (28)
Marital status - American Indian / Alaska Native population 15 years and over
Males 75.8% Never married0.0% Now married0.0% Separated0.0% Widowed24.2% DivorcedFemales 43.8% Never married42.5% Now married0.0% Separated0.0% Widowed13.8% DivorcedWomen who gave birth in the past 12 months Now married:
100.0% (4)Unmarried:
0.0% (0)
Women who did not give birth in the past 12 months Now married:
11.1% (5)Unmarried:
88.9% (41)
Marital status - Asian population 15 years and over
Males 49.3% Never married50.7% Now married0.0% Separated0.0% Widowed0.0% DivorcedFemales 89.5% Never married10.5% Now married0.0% Separated0.0% Widowed0.0% DivorcedWomen who did not give birth in the past 12 months Now married:
10.5% (4)Unmarried:
89.5% (35)
Marital status - Other race population 15 years and over
Males 71.4% Never married28.6% Now married0.0% Separated0.0% Widowed0.0% DivorcedFemales 86.3% Never married13.7% Now married0.0% Separated0.0% Widowed0.0% DivorcedWomen who gave birth in the past 12 months Now married:
100.0% (8)Unmarried:
0.0% (0)
Women who did not give birth in the past 12 months Now married:
0.0% (0)Unmarried:
100.0% (53)
Marital status - Two or more races population 15 years and over
Males 69.3% Never married28.5% Now married0.5% Separated1.7% Widowed0.0% DivorcedFemales 50.1% Never married38.7% Now married0.9% Separated0.0% Widowed10.3% DivorcedWomen who gave birth in the past 12 months Now married:
0.0% (0)Unmarried:
100.0% (1)
Women who did not give birth in the past 12 months Now married:
30.7% (138)Unmarried:
69.3% (311)
Marital status - White alone, not Hispanic / Latino population 15 years and over
Males 57.6% Never married32.3% Now married0.1% Separated2.9% Widowed7.1% DivorcedFemales 51.2% Never married32.7% Now married0.3% Separated6.7% Widowed9.2% DivorcedWomen who gave birth in the past 12 months Now married:
86.6% (110)Unmarried:
13.4% (17)
Women who did not give birth in the past 12 months Now married:
20.0% (1,108)Unmarried:
80.0% (4,439)
Marital status - Hispanic or Latino population 15 years and over
Males 63.8% Never married36.2% Now married0.0% Separated0.0% Widowed0.0% DivorcedFemales 38.7% Never married46.7% Now married1.8% Separated0.0% Widowed12.9% DivorcedWomen who gave birth in the past 12 months Now married:
100.0% (7)Unmarried:
0.0% (0)
Women who did not give birth in the past 12 months Now married:
35.6% (50)Unmarried:
64.4% (91)
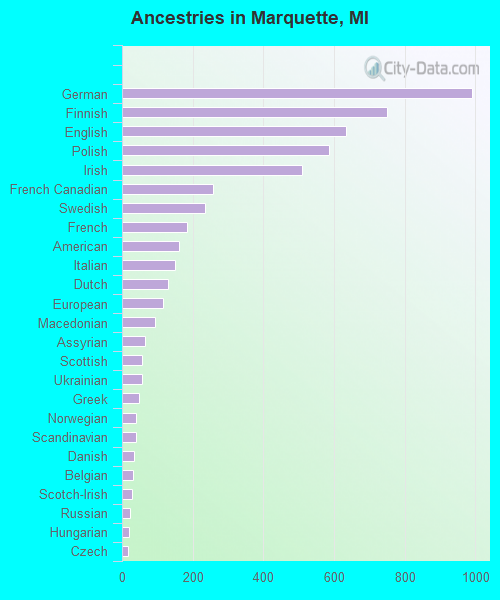
Ancestries in Marquette
989 13.7% German750 10.4% Finnish633 8.7% English585 8.1% Polish508 7.0% Irish257 3.5% French Canadian234 3.2% Swedish185 2.6% French162 2.2% American150 2.1% Italian129 1.8% Dutch116 1.6% European93 1.3% Macedonian64 0.9% Assyrian57 0.8% Scottish56 0.8% Ukrainian48 0.7% Greek40 0.6% Norwegian39 0.5% Scandinavian35 0.5% Danish31 0.4% Belgian27 0.4% Scotch-Irish24 0.3% Russian20 0.3% Hungarian18 0.2% Czech17 0.2% African14 0.2% Swiss12 0.2% Eastern European12 0.2% Canadian11 0.2% British10 0.1% Croatian9 0.1% Arab9 0.1% Iranian8 0.1% Bulgarian7 0.10% Welsh6 0.08% Moroccan6 0.08% Lithuanian5 0.07% Slovene3 0.04% Northern European
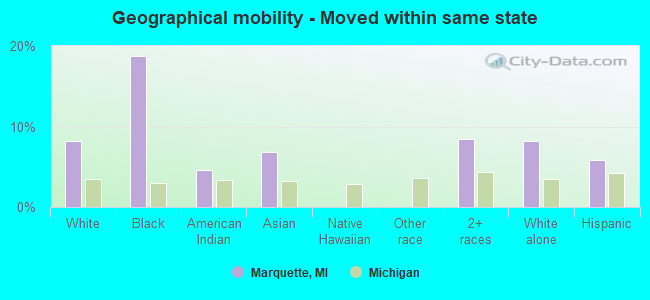
Geographical mobility in Marquette Same house 1 year ago 13,214 72.2% White (Caucasian)516 83.2% Black or African American109 80.3% American Indian / Alaska Native71 64.5% Asian19 100.0% Native Hawaiian / Pacific Islander69 77.7% Other race1,068 77.7% Two or more races13,164 72.3% White alone, not Hispanic / Latino505 84.7% Hispanic or LatinoMoved within same county 2,311 12.6% White / Caucasian53 8.6% Black or African American17 12.4% American Indian / Alaska Native3 3.0% Asian19 21.1% Other race165 12.0% Two or more races2,298 12.6% White alone, not Hispanic / Latino44 7.5% Hispanic or LatinoMoved within same state 1,505 8.2% White / Caucasian116 18.8% Black or African American6 4.7% American Indian / Alaska Native8 6.8% Asian116 8.4% Two or more races1,500 8.2% White alone, not Hispanic / Latino35 5.9% Hispanic or LatinoMoved from different state 1,324 7.2% White / Caucasian13 2.1% Black or African American5 4.1% Asian21 1.5% Two or more races1,315 7.2% White alone, not Hispanic / Latino12 2.1% Hispanic or LatinoMoved from abroad 163 0.9% White17 2.7% Black or African American24 21.4% Asian177 1.0% White alone, not Hispanic / Latino
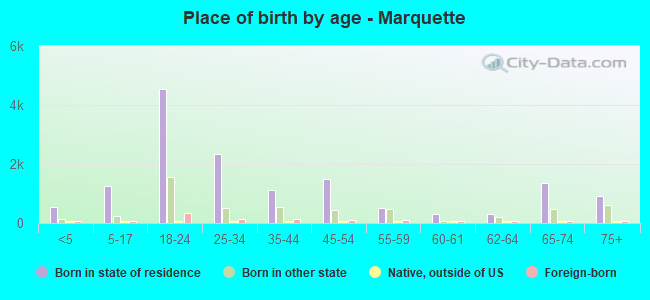
Children Nativity (place of birth) in Marquette
Children under 6 years - Living with two parents Both parents native 399 100.0% NativeBoth parents foreign-born 32 100.0% NativeOne native, one foreign-born parent 42 100.0% NativeChildren under 6 years - Living with one parent Native parent 287 100.0% NativeChildren 6 to 17 years - Living with two parents Both parents native 668 100.0% NativeBoth parents foreign-born 18 100.0% NativeOne native, one foreign-born parent 23 47.7% Native25 52.3% Foreign-bornChildren 6 to 17 years - Living with one parent Native parent 422 100.0% NativeForeign-born parent 84 49.3% Native87 50.7% Foreign-born
Grandparents responsible for own grandchildren in Marquette
Grandparents (30 to 59 years) White / Caucasian 100 85.5% Responsible for grandchildren17 14.5% Not responsible for grandchildrenBlack or African American 1 67.8% Responsible for grandchildrenTwo or more races 57 100.0% Not responsible for grandchildrenWhite alone, not Hispanic / Latino 100 85.5% Responsible for grandchildren17 14.5% Not responsible for grandchildrenHispanic or Latino 58 100.0% Not responsible for grandchildren
Grandparents (60 years and over) White / Caucasian 59 100.0% Not responsible for grandchildrenWhite alone, not Hispanic / Latino 61 100.0% Not responsible for grandchildren