Races in Mason, Michigan (MI) Detailed Stats
Data:
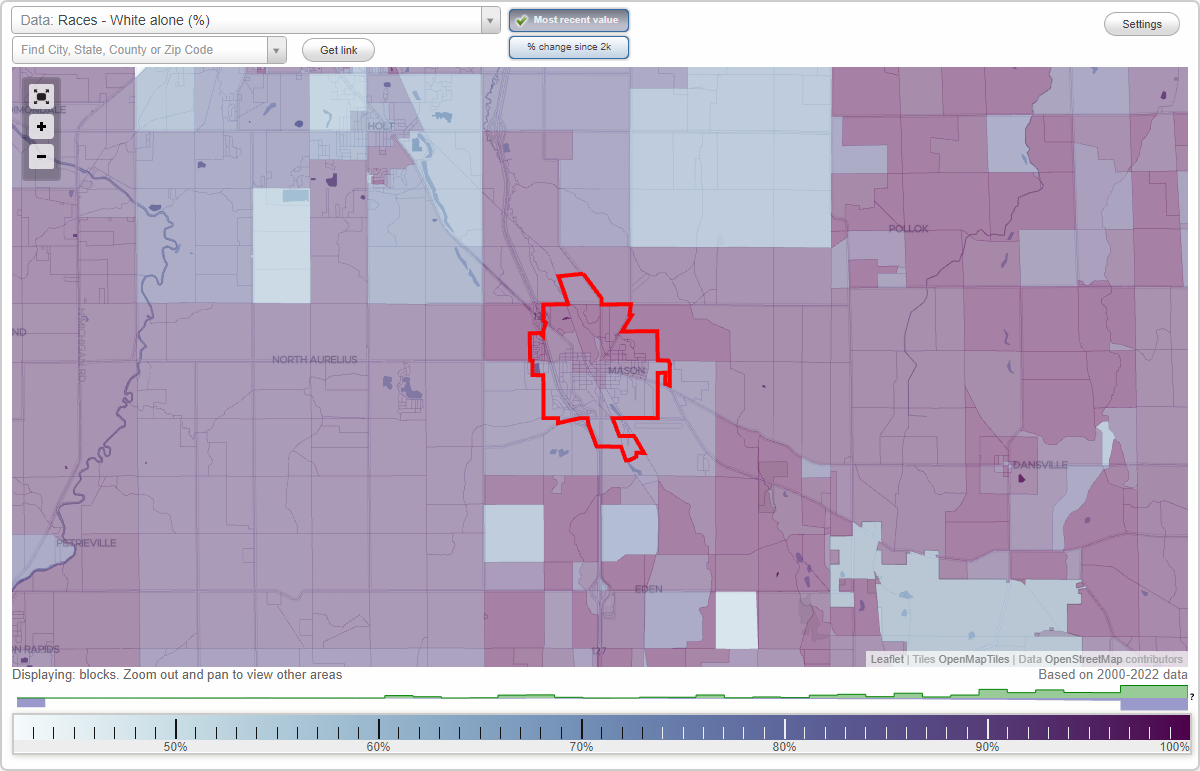
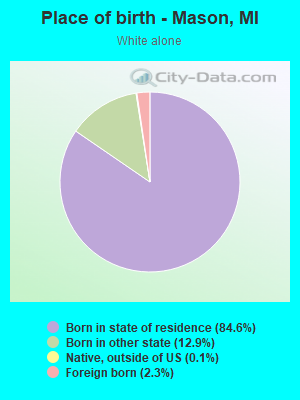
Races - White alone (%)
Races - White alone (% change since 2000)
Races - Black alone (%)
Races - Black alone (% change since 2000)
Races - American Indian alone (%)
Races - American Indian alone (% change since 2000)
Races - Asian alone (%)
Races - Asian alone (% change since 2000)
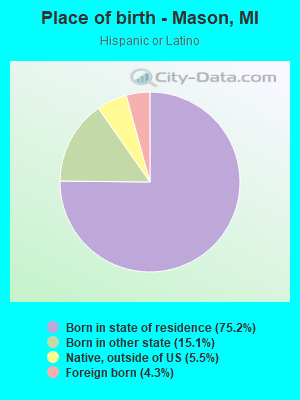
Races - Hispanic (%)
Races - Hispanic (% change since 2000)
Races - Native Hawaiian and Other Pacific Islander alone (%)
Races - Native Hawaiian and Other Pacific Islander alone (% change since 2000)
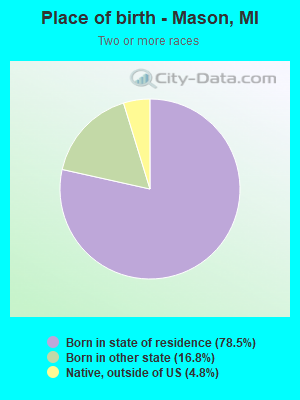
Races - Two or more races(%)
Races - Two or more races(% change since 2000)
Races - Other race alone (%)
Races - Other race alone (% change since 2000)
Racial diversity
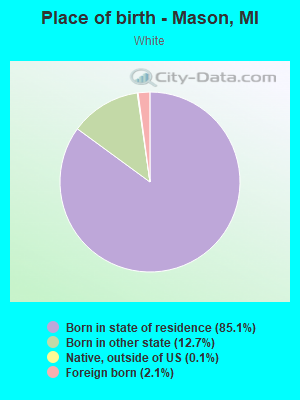
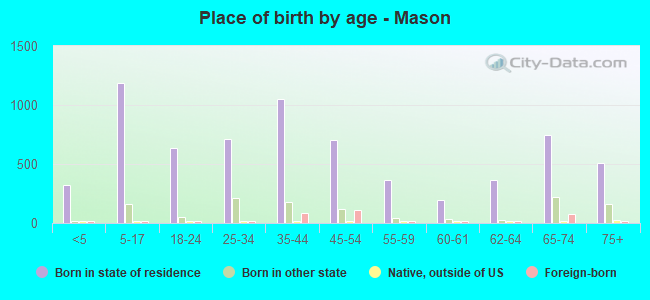
Place of birth - Born in state of residence (%)
Place of birth - Born in state of residence (%) - White
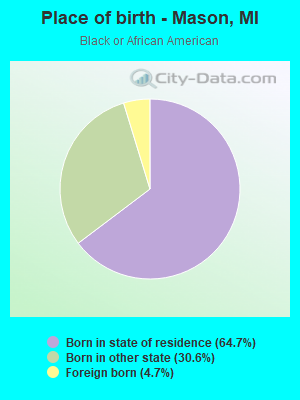
Place of birth - Born in state of residence (%) - Black or African American
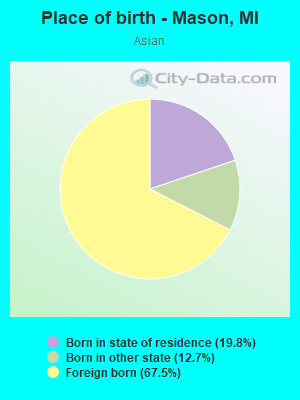
Place of birth - Born in state of residence (%) - Asian
Place of birth - Born in state of residence (%) - Hispanic or Latino
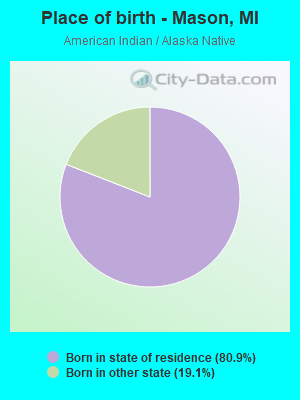
Place of birth - Born in state of residence (%) - American Indian and Alaska Native
Place of birth - Born in state of residence (%) - Multirace
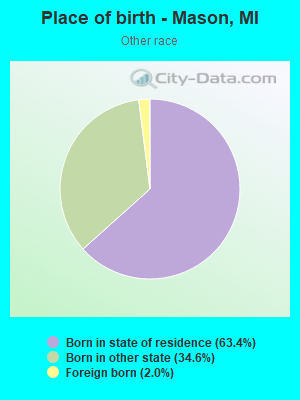
Place of birth - Born in state of residence (%) - Other Race
Place of birth - Born in other state (%)
Place of birth - Born in other state (%) - White
Place of birth - Born in other state (%) - Black or African American
Place of birth - Born in other state (%) - Asian
Place of birth - Born in other state (%) - Hispanic or Latino
Place of birth - Born in other state (%) - American Indian and Alaska Native
Place of birth - Born in other state (%) - Multirace
Place of birth - Born in other state (%) - Other Race
Place of birth - Native, outside of US (%)
Place of birth - Native, outside of US (%) - White
Place of birth - Native, outside of US (%) - Black or African American
Place of birth - Native, outside of US (%) - Asian
Place of birth - Native, outside of US (%) - Hispanic or Latino
Place of birth - Native, outside of US (%) - American Indian and Alaska Native
Place of birth - Native, outside of US (%) - Multirace
Place of birth - Native, outside of US (%) - Other Race
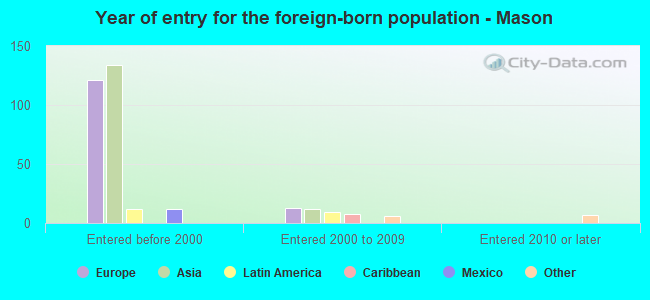
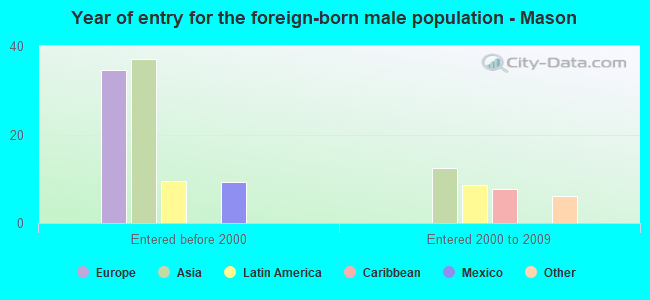
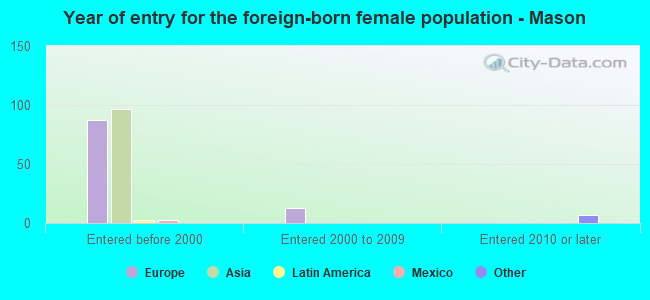
Place of birth - Foreign born (%)
Place of birth - Foreign born (%) - White
Place of birth - Foreign born (%) - Black or African American
Place of birth - Foreign born (%) - Asian
Place of birth - Foreign born (%) - Hispanic or Latino
Place of birth - Foreign born (%) - American Indian and Alaska Native
Place of birth - Foreign born (%) - Multirace
Place of birth - Foreign born (%) - Other Race
Residents speaking English at home (%)
Residents speaking English at home - Born in the United States (%)
Residents speaking English at home - Native, born elsewhere (%)
Residents speaking English at home - Foreign born (%)
Residents speaking Spanish at home (%)
Residents speaking Spanish at home - Born in the United States (%)
Residents speaking Spanish at home - Native, born elsewhere (%)
Residents speaking Spanish at home - Foreign born (%)
Residents speaking other language at home (%)
Residents speaking other language at home - Born in the United States (%)
Residents speaking other language at home - Native, born elsewhere (%)
Residents speaking other language at home - Foreign born (%)
Marital status - Never married (%)
Marital status - Now married (%)
Marital status - Separated (%)
Marital status - Widowed (%)
Marital status - Divorced (%)
Ancestries Reported - Arab (%)
Ancestries Reported - Czech (%)
Ancestries Reported - Danish (%)
Ancestries Reported - Dutch (%)
Ancestries Reported - English (%)
Ancestries Reported - French (%)
Ancestries Reported - French Canadian (%)
Ancestries Reported - German (%)
Ancestries Reported - Greek (%)
Ancestries Reported - Hungarian (%)
Ancestries Reported - Irish (%)
Ancestries Reported - Italian (%)
Ancestries Reported - Lithuanian (%)
Ancestries Reported - Norwegian (%)
Ancestries Reported - Polish (%)
Ancestries Reported - Portuguese (%)
Ancestries Reported - Russian (%)
Ancestries Reported - Scotch-Irish (%)
Ancestries Reported - Scottish (%)
Ancestries Reported - Slovak (%)
Ancestries Reported - Subsaharan African (%)
Ancestries Reported - Swedish (%)
Ancestries Reported - Swiss (%)
Ancestries Reported - Ukrainian (%)
Ancestries Reported - United States (%)
Ancestries Reported - Welsh (%)
Ancestries Reported - West Indian (%)
Ancestries Reported - Other (%)
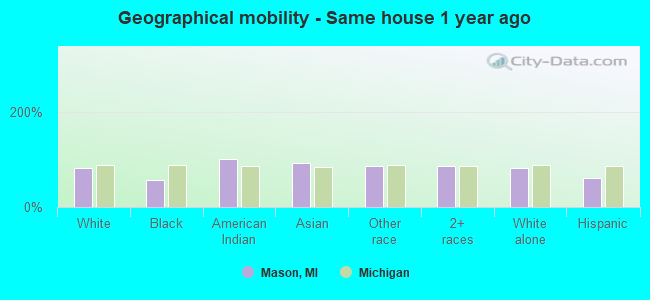
Geographical mobility - Same house 1 year ago (%)
Geographical mobility - Same house 1 year ago (%) - White
Geographical mobility - Same house 1 year ago (%) - Black or African American
Geographical mobility - Same house 1 year ago (%) - Asian
Geographical mobility - Same house 1 year ago (%) - Hispanic or Latino
Geographical mobility - Same house 1 year ago (%) - American Indian and Alaska Native
Geographical mobility - Same house 1 year ago (%) - Multirace
Geographical mobility - Same house 1 year ago (%) - Other Race
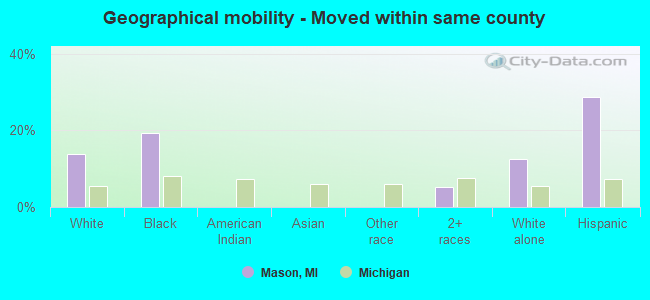
Geographical mobility - Moved within same county (%)
Geographical mobility - Moved within same county (%) - White
Geographical mobility - Moved within same county (%) - Black or African American
Geographical mobility - Moved within same county (%) - Asian
Geographical mobility - Moved within same county (%) - Hispanic or Latino
Geographical mobility - Moved within same county (%) - American Indian and Alaska Native
Geographical mobility - Moved within same county (%) - Multirace
Geographical mobility - Moved within same county (%) - Other Race
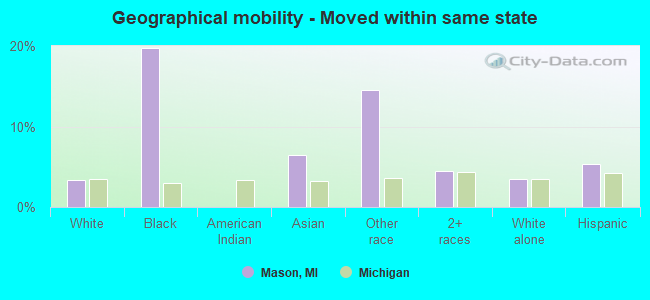
Geographical mobility - Moved from different county within same state (%)
Geographical mobility - Moved from different county within same state (%) - White
Geographical mobility - Moved from different county within same state (%) - Black or African American
Geographical mobility - Moved from different county within same state (%) - Asian
Geographical mobility - Moved from different county within same state (%) - Hispanic or Latino
Geographical mobility - Moved from different county within same state (%) - American Indian and Alaska Native
Geographical mobility - Moved from different county within same state (%) - Multirace
Geographical mobility - Moved from different county within same state (%) - Other Race
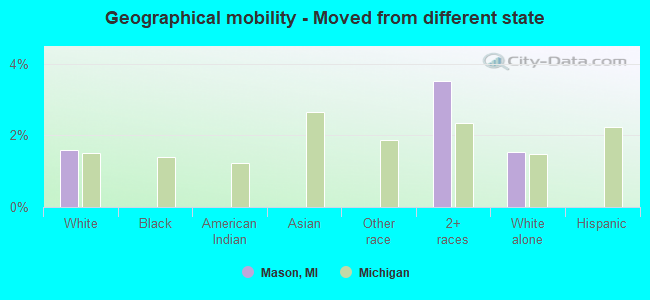
Geographical mobility - Moved from different state (%)
Geographical mobility - Moved from different state (%) - White
Geographical mobility - Moved from different state (%) - Black or African American
Geographical mobility - Moved from different state (%) - Asian
Geographical mobility - Moved from different state (%) - Hispanic or Latino
Geographical mobility - Moved from different state (%) - American Indian and Alaska Native
Geographical mobility - Moved from different state (%) - Multirace
Geographical mobility - Moved from different state (%) - Other Race
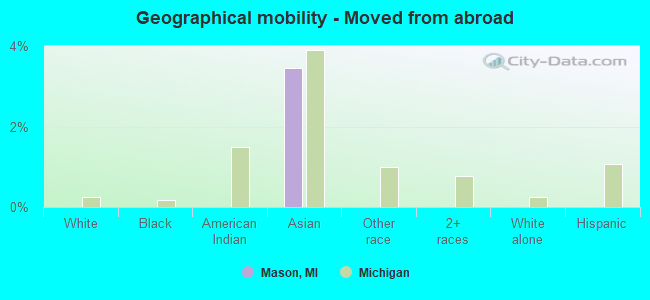
Geographical mobility - Moved from abroad (%)
Geographical mobility - Moved from abroad (%) - White
Geographical mobility - Moved from abroad (%) - Black or African American
Geographical mobility - Moved from abroad (%) - Asian
Geographical mobility - Moved from abroad (%) - Hispanic or Latino
Geographical mobility - Moved from abroad (%) - American Indian and Alaska Native
Geographical mobility - Moved from abroad (%) - Multirace
Geographical mobility - Moved from abroad (%) - Other Race
Place of birth for the foreign-born population - Ireland (%)
Place of birth for the foreign-born population - Denmark (%)
Place of birth for the foreign-born population - Norway (%)
Place of birth for the foreign-born population - Sweden (%)
Place of birth for the foreign-born population - United Kingdom (%)
Place of birth for the foreign-born population - England (%)
Place of birth for the foreign-born population - Scotland (%)
Place of birth for the foreign-born population - Other Northern Europe (%)
Place of birth for the foreign-born population - Austria (%)
Place of birth for the foreign-born population - Belgium (%)
Place of birth for the foreign-born population - France (%)
Place of birth for the foreign-born population - Germany (%)
Place of birth for the foreign-born population - Netherlands (%)
Place of birth for the foreign-born population - Switzerland (%)
Place of birth for the foreign-born population - Other Western Europe (%)
Place of birth for the foreign-born population - Greece (%)
Place of birth for the foreign-born population - Italy (%)
Place of birth for the foreign-born population - Portugal (%)
Place of birth for the foreign-born population - Spain (%)
Place of birth for the foreign-born population - Other Southern Europe (%)
Place of birth for the foreign-born population - Albania (%)
Place of birth for the foreign-born population - Belarus (%)
Place of birth for the foreign-born population - Bosnia and Herzegovina (%)
Place of birth for the foreign-born population - Bulgaria (%)
Place of birth for the foreign-born population - Croatia (%)
Place of birth for the foreign-born population - Czechoslovakia (%)
Place of birth for the foreign-born population - Hungary (%)
Place of birth for the foreign-born population - Latvia (%)
Place of birth for the foreign-born population - Lithuania (%)
Place of birth for the foreign-born population - North Macedonia (Macedonia) (%)
Place of birth for the foreign-born population - Moldova (%)
Place of birth for the foreign-born population - Poland (%)
Place of birth for the foreign-born population - Romania (%)
Place of birth for the foreign-born population - Russia (%)
Place of birth for the foreign-born population - Serbia (%)
Place of birth for the foreign-born population - Ukraine (%)
Place of birth for the foreign-born population - Other Eastern Europe (%)
Place of birth for the foreign-born population - China (%)
Place of birth for the foreign-born population - Hong Kong (%)
Place of birth for the foreign-born population - Taiwan (%)
Place of birth for the foreign-born population - Japan (%)
Place of birth for the foreign-born population - Korea (%)
Place of birth for the foreign-born population - Other Eastern Asia (%)
Place of birth for the foreign-born population - Afghanistan (%)
Place of birth for the foreign-born population - Bangladesh (%)
Place of birth for the foreign-born population - India (%)
Place of birth for the foreign-born population - Iran (%)
Place of birth for the foreign-born population - Kazakhstan (%)
Place of birth for the foreign-born population - Nepal (%)
Place of birth for the foreign-born population - Pakistan (%)
Place of birth for the foreign-born population - Sri Lanka (%)
Place of birth for the foreign-born population - Uzbekistan (%)
Place of birth for the foreign-born population - Other South Central Asia (%)
Place of birth for the foreign-born population - Burma (%)
Place of birth for the foreign-born population - Cambodia (%)
Place of birth for the foreign-born population - Indonesia (%)
Place of birth for the foreign-born population - Laos (%)
Place of birth for the foreign-born population - Malaysia (%)
Place of birth for the foreign-born population - Philippines (%)
Place of birth for the foreign-born population - Singapore (%)
Place of birth for the foreign-born population - Thailand (%)
Place of birth for the foreign-born population - Vietnam (%)
Place of birth for the foreign-born population - Other South Eastern Asia (%)
Place of birth for the foreign-born population - Armenia (%)
Place of birth for the foreign-born population - Iraq (%)
Place of birth for the foreign-born population - Israel (%)
Place of birth for the foreign-born population - Jordan (%)
Place of birth for the foreign-born population - Kuwait (%)
Place of birth for the foreign-born population - Lebanon (%)
Place of birth for the foreign-born population - Saudi Arabia (%)
Place of birth for the foreign-born population - Syria (%)
Place of birth for the foreign-born population - Turkey (%)
Place of birth for the foreign-born population - Yemen (%)
Place of birth for the foreign-born population - Other Western Asia (%)
Place of birth for the foreign-born population - Eritrea (%)
Place of birth for the foreign-born population - Ethiopia (%)
Place of birth for the foreign-born population - Kenya (%)
Place of birth for the foreign-born population - Somalia (%)
Place of birth for the foreign-born population - Uganda (%)
Place of birth for the foreign-born population - Zimbabwe (%)
Place of birth for the foreign-born population - Other Eastern Africa (%)
Place of birth for the foreign-born population - Cameroon (%)
Place of birth for the foreign-born population - Congo (%)
Place of birth for the foreign-born population - Democratic Republic of Congo (Zaire) (%)
Place of birth for the foreign-born population - Other Middle Africa (%)
Place of birth for the foreign-born population - Egypt (%)
Place of birth for the foreign-born population - Morocco (%)
Place of birth for the foreign-born population - Sudan (%)
Place of birth for the foreign-born population - Other Northern Africa (%)
Place of birth for the foreign-born population - South Africa (%)
Place of birth for the foreign-born population - Other Southern Africa (%)
Place of birth for the foreign-born population - Cabo Verde (%)
Place of birth for the foreign-born population - Ghana (%)
Place of birth for the foreign-born population - Liberia (%)
Place of birth for the foreign-born population - Nigeria (%)
Place of birth for the foreign-born population - Senegal (%)
Place of birth for the foreign-born population - Sierra Leone (%)
Place of birth for the foreign-born population - Other Western Africa (%)
Place of birth for the foreign-born population - Australia (%)
Place of birth for the foreign-born population - New Zealand (%)
Place of birth for the foreign-born population - Fiji (%)
Place of birth for the foreign-born population - Micronesia (%)
Place of birth for the foreign-born population - Bahamas (%)
Place of birth for the foreign-born population - Barbados (%)
Place of birth for the foreign-born population - Cuba (%)
Place of birth for the foreign-born population - Dominica (%)
Place of birth for the foreign-born population - Dominican Republic (%)
Place of birth for the foreign-born population - Grenada (%)
Place of birth for the foreign-born population - Haiti (%)
Place of birth for the foreign-born population - Jamaica (%)
Place of birth for the foreign-born population - St. Vincent and the Grenadines (%)
Place of birth for the foreign-born population - Trinidad and Tobago (%)
Place of birth for the foreign-born population - West Indies (%)
Place of birth for the foreign-born population - Other Caribbean (%)
Place of birth for the foreign-born population - Belize (%)
Place of birth for the foreign-born population - Costa Rica (%)
Place of birth for the foreign-born population - El Salvador (%)
Place of birth for the foreign-born population - Guatemala (%)
Place of birth for the foreign-born population - Honduras (%)
Place of birth for the foreign-born population - Mexico (%)
Place of birth for the foreign-born population - Nicaragua (%)
Place of birth for the foreign-born population - Panama (%)
Place of birth for the foreign-born population - Other Central America (%)
Place of birth for the foreign-born population - Argentina (%)
Place of birth for the foreign-born population - Bolivia (%)
Place of birth for the foreign-born population - Brazil (%)
Place of birth for the foreign-born population - Chile (%)
Place of birth for the foreign-born population - Colombia (%)
Place of birth for the foreign-born population - Ecuador (%)
Place of birth for the foreign-born population - Guyana (%)
Place of birth for the foreign-born population - Peru (%)
Place of birth for the foreign-born population - Uruguay (%)
Place of birth for the foreign-born population - Venezuela (%)
Place of birth for the foreign-born population - Other South America (%)
Place of birth for the foreign-born population - Canada (%)
Place of birth for the foreign-born population - Other Northern America (%)
Place of birth for the foreign-born population - Other (%)
Latest news about races in Mason, MI collected exclusively by city-data.com from local newspapers, TV, and radio stations
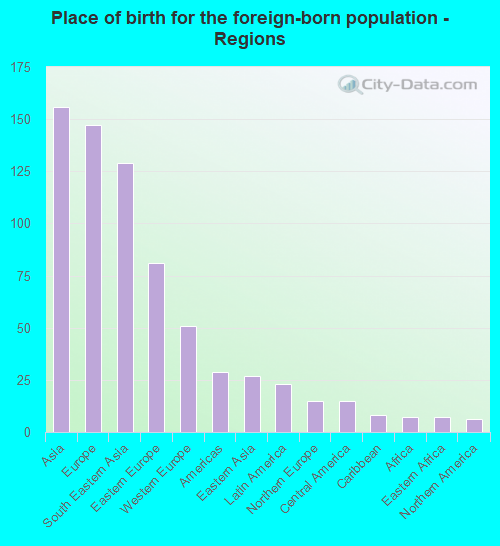
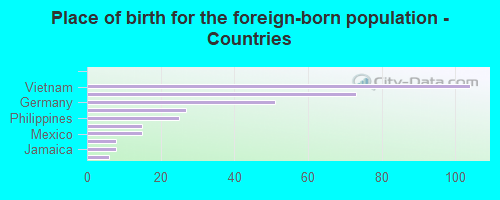
According to 2022 data, the most numerous races in Mason, MI are White alone (7,037 residents), Black alone (296 residents), and Hispanic (347 residents). 92.5% of Mason residents speak English at home. 4.1% of Mason, MI residents are foreign-born (1.9% born in Asia, 1.8% born in Europe), which is 47.4% less than the foreign-born rate of 6.0% across the entire state of Michigan.
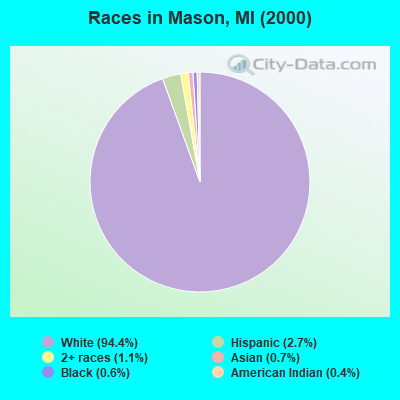
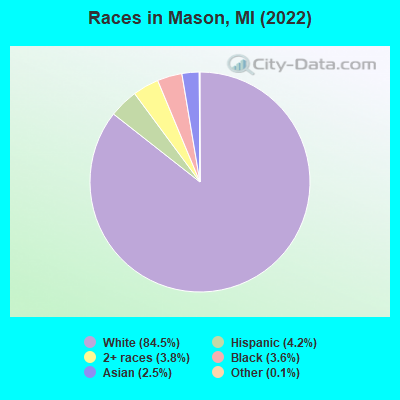
Race distribution in Mason
2000 2022
7,806,691 78.6% White alone 1,402,047 14.1% Black alone 323,877 3.3% Hispanic 175,311 1.8% Asian alone 163,487 1.6% Two or more races 53,421 0.5% American Indian alone 11,465 0.1% Other race alone 2,145 0.02% Native Hawaiian and Other
7,289,051 72.6% White alone 1,310,464 13.1% Black alone 572,405 5.7% Hispanic 450,031 4.5% Two or more races 335,732 3.3% Asian alone 45,217 0.5% Other race alone 29,011 0.3% American Indian alone 2,207 0.02% Native Hawaiian and Other
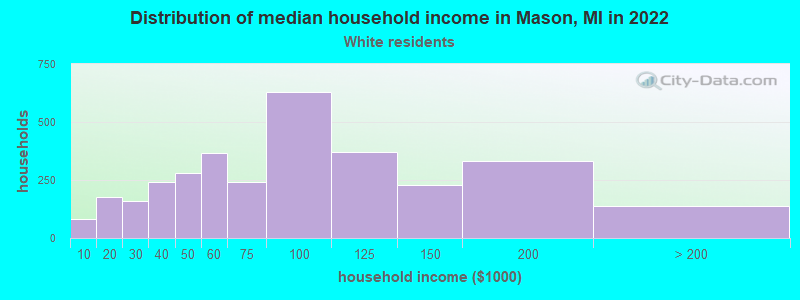
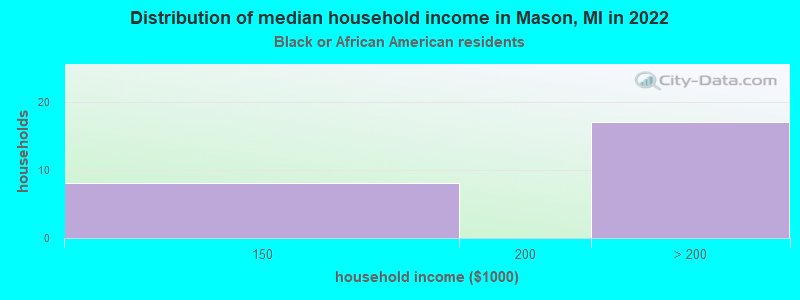
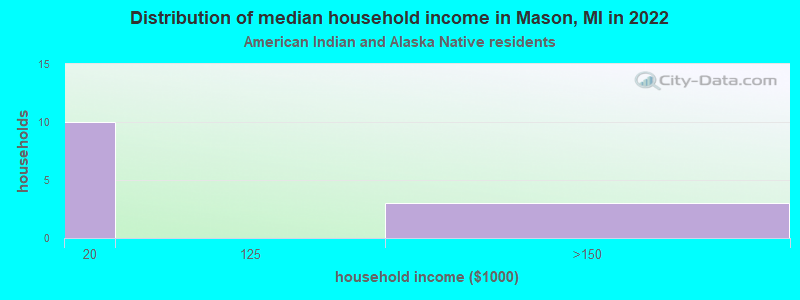
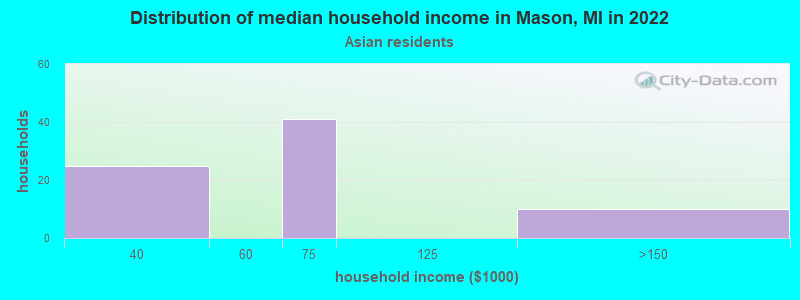
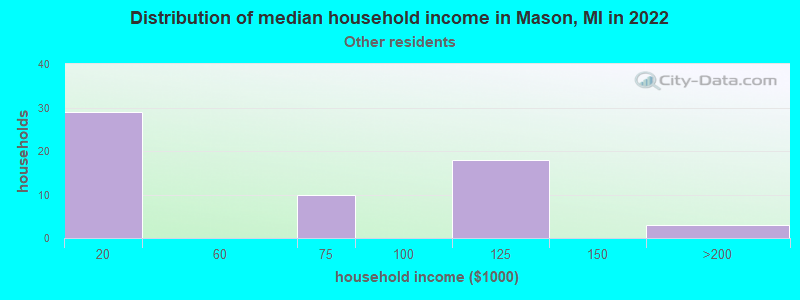
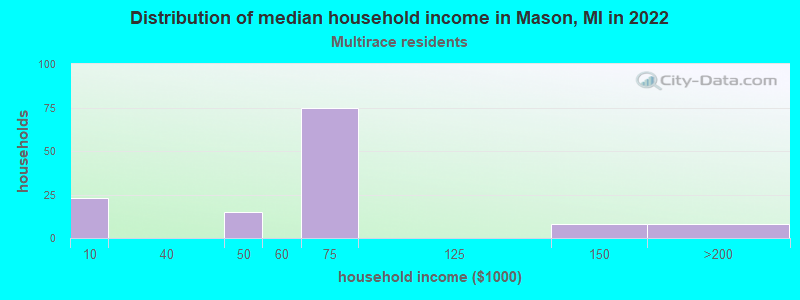
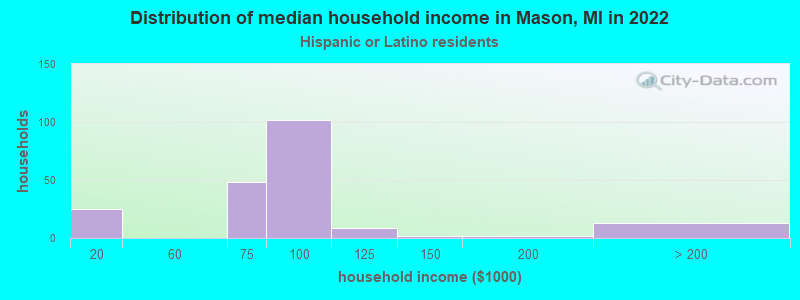
Income and house value in Mason Median household income in 2022 $73,842 White non-Hispanic householders$61,423 Asian householders$64,138 Two or more races householders$72,678 Hispanic or Latino race householdersMedian 2022 house value $216,761 White Non-Hispanic householders $237,232 Asian householders$124,355 Some other race householders$124,355 Hispanic or Latino householders
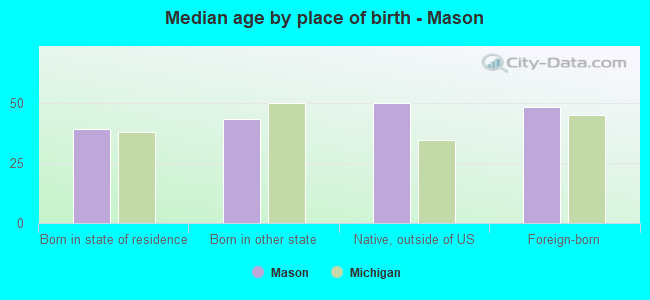
Median age by race in Mason
41.7 Median age for White residents36.5 45.8 38.7 Median age for Black or African American residents38.5 28.1 82.8 Median age for American Indian / Alaska Native residents-623,868,312.1 -1,538,983,049.3 46.5 Median age for Asian residents50.9 38.1 -666,666,666.0 Median age for Native Hawaiian / Pacific Islander residents-666,666,666.0 -666,666,666.0 49.8 Median age for Other race residents59.7 -464,252,552.9 43.8 Median age for Two or more races residents34.7 44.1 41.8 Median age for White alone residents37.7 45.8 24.4 Median age for Hispanic or Latino residents25.1 36.1
Owner/renter occupied households by race in Mason
House owners and renters - White residents 2,268 70.3% Owner occupied957 29.7% Renter occupiedHouse owners and renters - Black or African American residents 8 36.6% Owner occupied14 63.4% Renter occupiedHouse owners and renters - American Indian / Alaska Native residents 2 15.4% Owner occupied11 84.6% Renter occupiedHouse owners and renters - Asian residents 67 78.4% Owner occupied18 21.6% Renter occupiedHouse owners and renters - Other race residents 18 16.3% Owner occupied91 83.7% Renter occupiedHouse owners and renters - Two or more races residents 130 81.1% Owner occupied30 18.9% Renter occupiedHouse owners and renters - White alone residents 2,287 72.2% Owner occupied881 27.8% Renter occupiedHouse owners and renters - Hispanic or Latino residents 29 12.3% Owner occupied205 87.7% Renter occupied
Language usage in Mason
English speakers - Total 92.5% of residents of Mason speak English at home.
1.4% of residents speak Spanish at home 109 98.2% Speak English very well2 1.8% Speak English less than very well5.6% of residents speak other language at home 315 69.7% Speak English very well137 30.3% Speak English less than very well
English speakers - Born in the United States 85.8% of residents of Mason speak English at home.
2.2% of residents speak Spanish at home 26 100.0% Speak English very well10.0% of residents speak other language at home 85 72.6% Speak English very well32 27.4% Speak English less than very well
English speakers - Native, born elsewhere 44.0% of residents of Mason speak English at home.
100.0% of residents speak Spanish at home 25 100.0% Speak English very well
English speakers - Foreign-born 34.1% of residents of Mason speak English at home.
0.9% of residents speak Spanish at home 3 100.0% Speak English less than very well58.6% of residents speak other language at home 85 43.8% Speak English very well109 56.2% Speak English less than very well
White (Caucasian) - Speak only English Native:
97.5% (6,489)Foreign-born:
54.3% (81)
White (Caucasian) - Speak another language Native:
2.5% (164)Foreign-born:
48.5% (73)
Black or African American - Speak only English Native:
98.1% (288)Foreign-born:
53.1% (7)
Asian - Speak another language Native:
100.0% (63)Foreign-born:
82.5% (120)
Other race - Speak another language Native:
60.8% (99)Foreign-born:
89.7% (3)
White alone - Speak only English Native:
97.1% (6,413)Foreign-born:
42.8% (70)
White alone - Speak another language Native:
2.9% (194)Foreign-born:
56.5% (93)
Hispanic or Latino - Speak only English Native:
75.6% (255)Foreign-born:
100.0% (14)
Hispanic or Latino - Speak another language Native:
23.9% (81)Foreign-born:
17.5% (2)
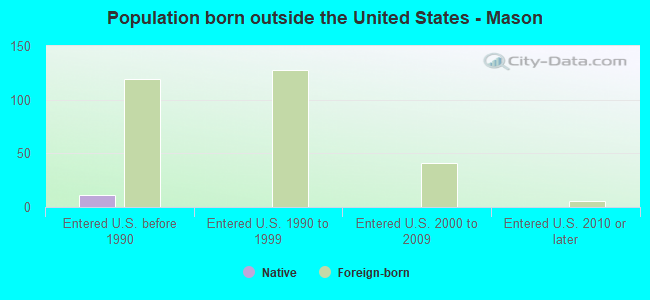
Foreign-born residents in Mason 339 residents are foreign born (1.9% Asia , 1.8% Europe ).
This city:
4.1%Michigan:
6.9%
Marital status for residents in Mason Marital status - White (Caucasian) population 15 years and over
Males 35.6% Never married49.1% Now married0.4% Separated2.7% Widowed12.1% DivorcedFemales 21.8% Never married44.2% Now married0.6% Separated12.0% Widowed21.4% DivorcedWomen who gave birth in the past 12 months Now married:
83.8% (55)Unmarried:
16.2% (11)
Women who did not give birth in the past 12 months Now married:
46.4% (660)Unmarried:
53.6% (763)
Marital status - Black or African American population 15 years and over
Males 72.1% Never married18.6% Now married0.0% Separated0.0% Widowed9.3% DivorcedFemales 57.1% Never married37.1% Now married0.0% Separated5.7% Widowed0.0% DivorcedWomen who did not give birth in the past 12 months Now married:
0.0% (0)Unmarried:
100.0% (18)
Marital status - American Indian / Alaska Native population 15 years and over
Males 60.0% Never married40.0% Now married0.0% Separated0.0% Widowed0.0% DivorcedFemales 100.0% Never married0.0% Now married0.0% Separated0.0% Widowed0.0% DivorcedMarital status - Asian population 15 years and over
Males 32.1% Never married16.0% Now married0.0% Separated0.0% Widowed51.9% DivorcedFemales 88.8% Never married11.2% Now married0.0% Separated0.0% Widowed0.0% DivorcedWomen who did not give birth in the past 12 months Now married:
0.0% (0)Unmarried:
100.0% (94)
Marital status - Other race population 15 years and over
Males 34.9% Never married12.0% Now married43.4% Separated0.0% Widowed9.6% DivorcedFemales 83.3% Never married16.7% Now married0.0% Separated0.0% Widowed0.0% DivorcedWomen who did not give birth in the past 12 months Now married:
0.0% (0)Unmarried:
100.0% (18)
Marital status - Two or more races population 15 years and over
Males 39.7% Never married46.3% Now married0.0% Separated14.0% Widowed0.0% DivorcedFemales 60.9% Never married13.8% Now married0.0% Separated0.0% Widowed25.3% DivorcedWomen who did not give birth in the past 12 months Now married:
25.5% (20)Unmarried:
74.5% (59)
Marital status - White alone, not Hispanic / Latino population 15 years and over
Males 33.6% Never married50.5% Now married0.4% Separated2.9% Widowed12.6% DivorcedFemales 21.9% Never married44.1% Now married0.6% Separated12.0% Widowed21.4% DivorcedWomen who gave birth in the past 12 months Now married:
83.8% (57)Unmarried:
16.2% (11)
Women who did not give birth in the past 12 months Now married:
46.1% (675)Unmarried:
53.9% (790)
Marital status - Hispanic or Latino population 15 years and over
Males 60.2% Never married20.4% Now married15.9% Separated0.0% Widowed3.5% DivorcedFemales 41.4% Never married20.7% Now married0.0% Separated0.0% Widowed37.9% DivorcedWomen who did not give birth in the past 12 months Now married:
19.6% (9)Unmarried:
80.4% (37)
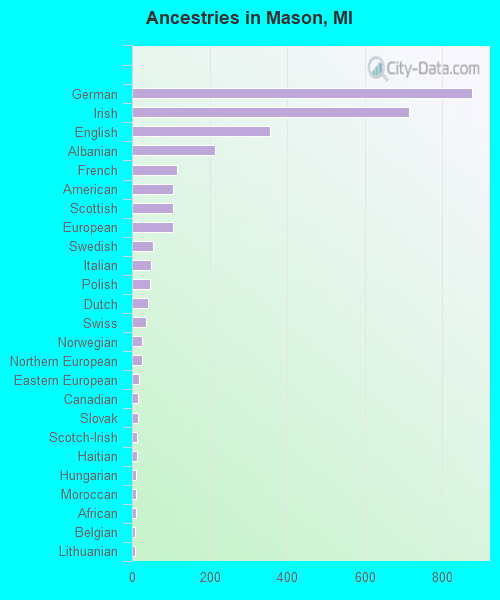
Ancestries in Mason
877 24.5% German715 20.0% Irish357 10.0% English213 5.9% Albanian115 3.2% French107 3.0% American107 3.0% Scottish106 3.0% European55 1.5% Swedish49 1.4% Italian46 1.3% Polish41 1.1% Dutch35 1.0% Swiss26 0.7% Norwegian25 0.7% Northern European19 0.5% Eastern European16 0.4% Canadian15 0.4% Slovak13 0.4% Scotch-Irish13 0.4% Haitian11 0.3% Hungarian10 0.3% Moroccan10 0.3% African9 0.3% Belgian9 0.3% Lithuanian9 0.3% Jamaican8 0.2% French Canadian8 0.2% Ukrainian6 0.2% British6 0.2% Romanian
Children Nativity (place of birth) in Mason
Children under 6 years - Living with two parents Both parents native 244 100.0% NativeChildren under 6 years - Living with one parent Native parent 107 100.0% NativeChildren 6 to 17 years - Living with two parents Both parents native 779 100.0% NativeBoth parents foreign-born 95 100.0% NativeChildren 6 to 17 years - Living with one parent Native parent 280 100.0% NativeForeign-born parent 45 50.9% Native44 49.1% Foreign-born
Grandparents responsible for own grandchildren in Mason
Grandparents (30 to 59 years) White / Caucasian 104 90.3% Responsible for grandchildren11 9.7% Not responsible for grandchildrenWhite alone, not Hispanic / Latino 104 90.2% Responsible for grandchildren11 9.8% Not responsible for grandchildrenGrandparents (60 years and over) White / Caucasian 8 37.8% Responsible for grandchildren13 62.2% Not responsible for grandchildrenWhite alone, not Hispanic / Latino 8 36.0% Responsible for grandchildren14 64.0% Not responsible for grandchildren