Races in Massapequa Park, New York (NY) Detailed Stats
Data:
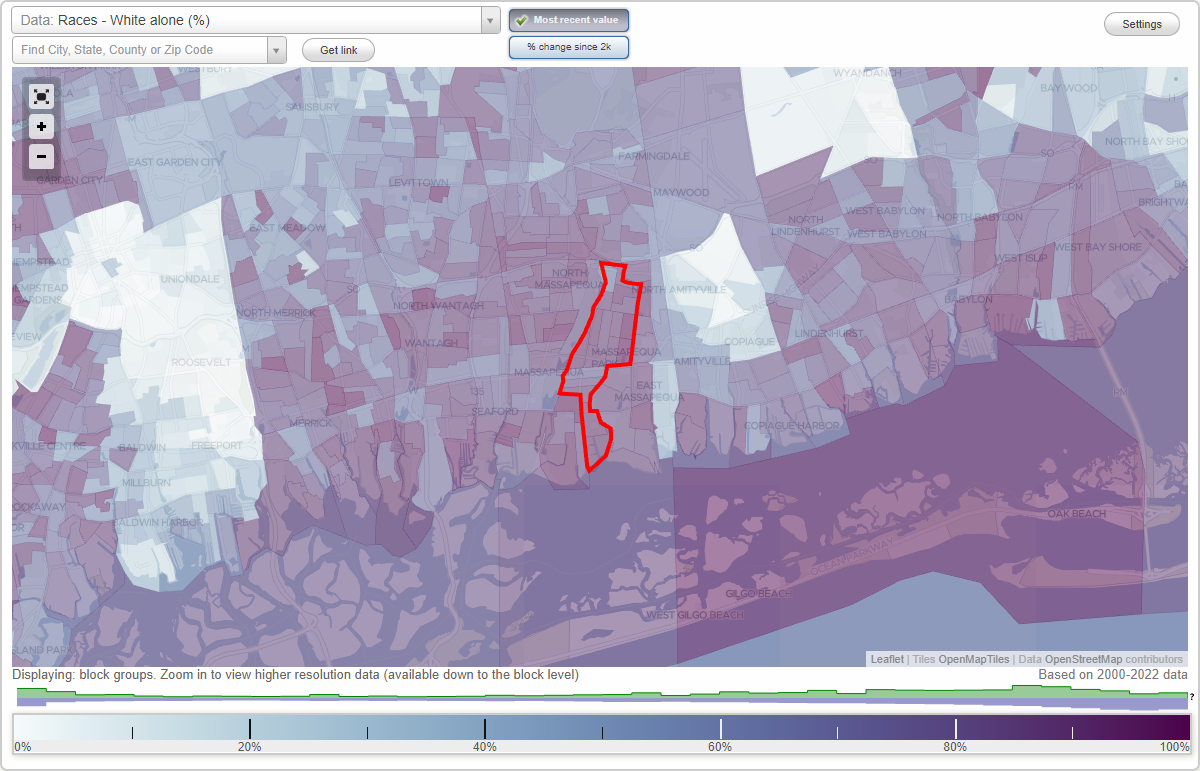
Races - White alone (%)
Races - White alone (% change since 2000)
Races - Black alone (%)
Races - Black alone (% change since 2000)
Races - American Indian alone (%)
Races - American Indian alone (% change since 2000)
Races - Asian alone (%)
Races - Asian alone (% change since 2000)
Races - Hispanic (%)
Races - Hispanic (% change since 2000)
Races - Native Hawaiian and Other Pacific Islander alone (%)
Races - Native Hawaiian and Other Pacific Islander alone (% change since 2000)
Races - Two or more races(%)
Races - Two or more races(% change since 2000)
Races - Other race alone (%)
Races - Other race alone (% change since 2000)
Racial diversity
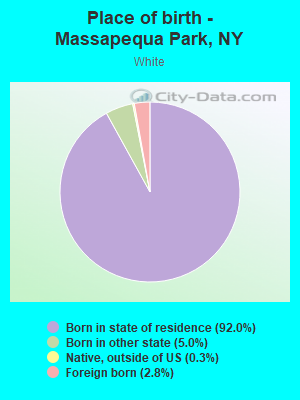
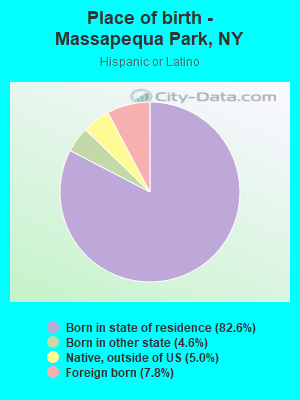
Place of birth - Born in state of residence (%)
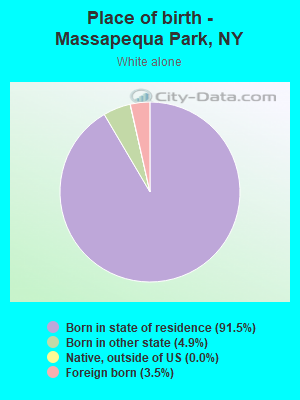
Place of birth - Born in state of residence (%) - White
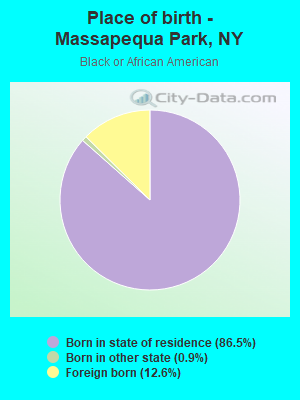
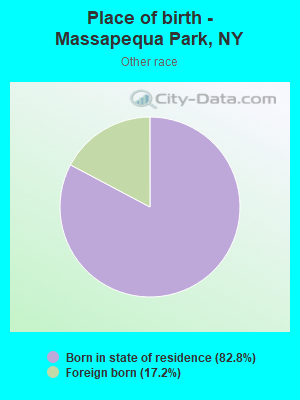
Place of birth - Born in state of residence (%) - Black or African American
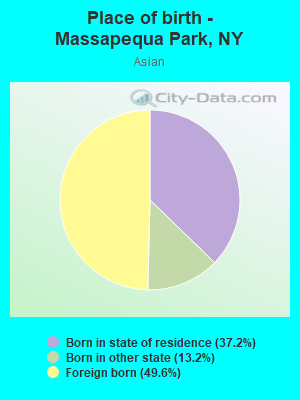
Place of birth - Born in state of residence (%) - Asian
Place of birth - Born in state of residence (%) - Hispanic or Latino
Place of birth - Born in state of residence (%) - American Indian and Alaska Native
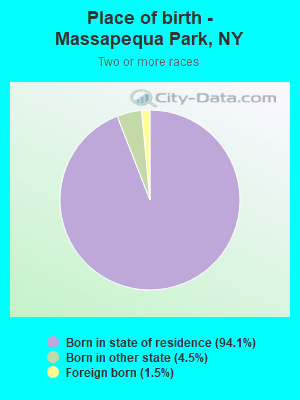
Place of birth - Born in state of residence (%) - Multirace
Place of birth - Born in state of residence (%) - Other Race
Place of birth - Born in other state (%)
Place of birth - Born in other state (%) - White
Place of birth - Born in other state (%) - Black or African American
Place of birth - Born in other state (%) - Asian
Place of birth - Born in other state (%) - Hispanic or Latino
Place of birth - Born in other state (%) - American Indian and Alaska Native
Place of birth - Born in other state (%) - Multirace
Place of birth - Born in other state (%) - Other Race
Place of birth - Native, outside of US (%)
Place of birth - Native, outside of US (%) - White
Place of birth - Native, outside of US (%) - Black or African American
Place of birth - Native, outside of US (%) - Asian
Place of birth - Native, outside of US (%) - Hispanic or Latino
Place of birth - Native, outside of US (%) - American Indian and Alaska Native
Place of birth - Native, outside of US (%) - Multirace
Place of birth - Native, outside of US (%) - Other Race
Place of birth - Foreign born (%)
Place of birth - Foreign born (%) - White
Place of birth - Foreign born (%) - Black or African American
Place of birth - Foreign born (%) - Asian
Place of birth - Foreign born (%) - Hispanic or Latino
Place of birth - Foreign born (%) - American Indian and Alaska Native
Place of birth - Foreign born (%) - Multirace
Place of birth - Foreign born (%) - Other Race
Residents speaking English at home (%)
Residents speaking English at home - Born in the United States (%)
Residents speaking English at home - Native, born elsewhere (%)
Residents speaking English at home - Foreign born (%)
Residents speaking Spanish at home (%)
Residents speaking Spanish at home - Born in the United States (%)
Residents speaking Spanish at home - Native, born elsewhere (%)
Residents speaking Spanish at home - Foreign born (%)
Residents speaking other language at home (%)
Residents speaking other language at home - Born in the United States (%)
Residents speaking other language at home - Native, born elsewhere (%)
Residents speaking other language at home - Foreign born (%)
Marital status - Never married (%)
Marital status - Now married (%)
Marital status - Separated (%)
Marital status - Widowed (%)
Marital status - Divorced (%)
Ancestries Reported - Arab (%)
Ancestries Reported - Czech (%)
Ancestries Reported - Danish (%)
Ancestries Reported - Dutch (%)
Ancestries Reported - English (%)
Ancestries Reported - French (%)
Ancestries Reported - French Canadian (%)
Ancestries Reported - German (%)
Ancestries Reported - Greek (%)
Ancestries Reported - Hungarian (%)
Ancestries Reported - Irish (%)
Ancestries Reported - Italian (%)
Ancestries Reported - Lithuanian (%)
Ancestries Reported - Norwegian (%)
Ancestries Reported - Polish (%)
Ancestries Reported - Portuguese (%)
Ancestries Reported - Russian (%)
Ancestries Reported - Scotch-Irish (%)
Ancestries Reported - Scottish (%)
Ancestries Reported - Slovak (%)
Ancestries Reported - Subsaharan African (%)
Ancestries Reported - Swedish (%)
Ancestries Reported - Swiss (%)
Ancestries Reported - Ukrainian (%)
Ancestries Reported - United States (%)
Ancestries Reported - Welsh (%)
Ancestries Reported - West Indian (%)
Ancestries Reported - Other (%)
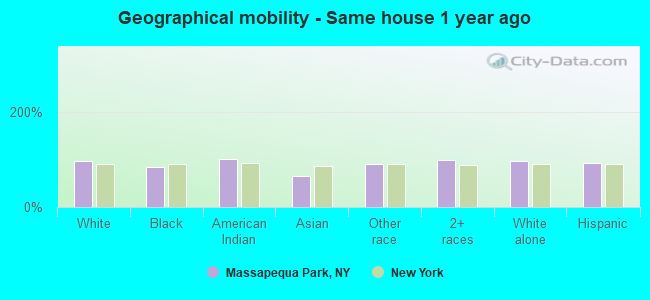
Geographical mobility - Same house 1 year ago (%)
Geographical mobility - Same house 1 year ago (%) - White
Geographical mobility - Same house 1 year ago (%) - Black or African American
Geographical mobility - Same house 1 year ago (%) - Asian
Geographical mobility - Same house 1 year ago (%) - Hispanic or Latino
Geographical mobility - Same house 1 year ago (%) - American Indian and Alaska Native
Geographical mobility - Same house 1 year ago (%) - Multirace
Geographical mobility - Same house 1 year ago (%) - Other Race
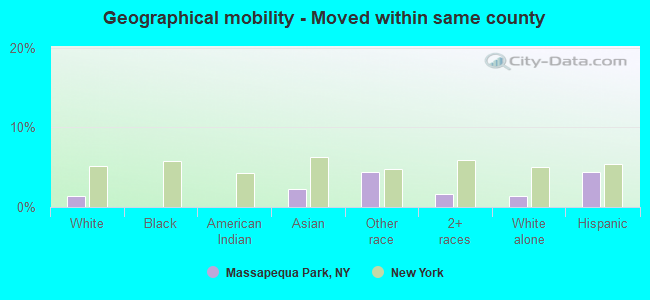
Geographical mobility - Moved within same county (%)
Geographical mobility - Moved within same county (%) - White
Geographical mobility - Moved within same county (%) - Black or African American
Geographical mobility - Moved within same county (%) - Asian
Geographical mobility - Moved within same county (%) - Hispanic or Latino
Geographical mobility - Moved within same county (%) - American Indian and Alaska Native
Geographical mobility - Moved within same county (%) - Multirace
Geographical mobility - Moved within same county (%) - Other Race
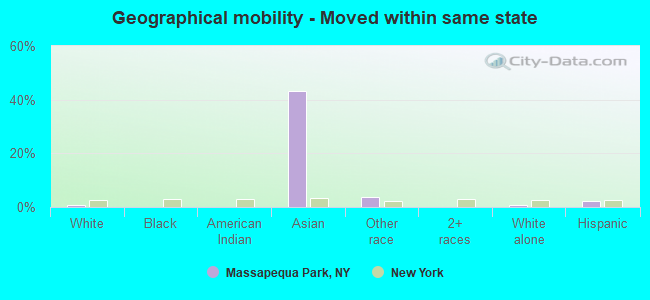
Geographical mobility - Moved from different county within same state (%)
Geographical mobility - Moved from different county within same state (%) - White
Geographical mobility - Moved from different county within same state (%) - Black or African American
Geographical mobility - Moved from different county within same state (%) - Asian
Geographical mobility - Moved from different county within same state (%) - Hispanic or Latino
Geographical mobility - Moved from different county within same state (%) - American Indian and Alaska Native
Geographical mobility - Moved from different county within same state (%) - Multirace
Geographical mobility - Moved from different county within same state (%) - Other Race
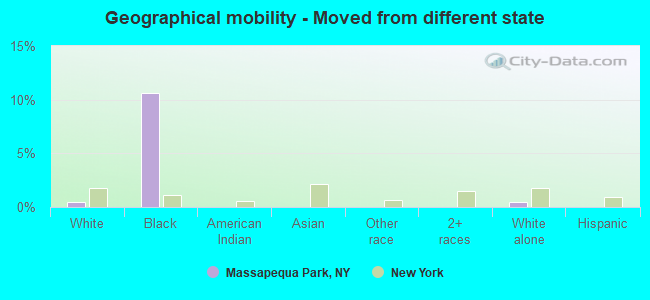
Geographical mobility - Moved from different state (%)
Geographical mobility - Moved from different state (%) - White
Geographical mobility - Moved from different state (%) - Black or African American
Geographical mobility - Moved from different state (%) - Asian
Geographical mobility - Moved from different state (%) - Hispanic or Latino
Geographical mobility - Moved from different state (%) - American Indian and Alaska Native
Geographical mobility - Moved from different state (%) - Multirace
Geographical mobility - Moved from different state (%) - Other Race
Geographical mobility - Moved from abroad (%)
Geographical mobility - Moved from abroad (%) - White
Geographical mobility - Moved from abroad (%) - Black or African American
Geographical mobility - Moved from abroad (%) - Asian
Geographical mobility - Moved from abroad (%) - Hispanic or Latino
Geographical mobility - Moved from abroad (%) - American Indian and Alaska Native
Geographical mobility - Moved from abroad (%) - Multirace
Geographical mobility - Moved from abroad (%) - Other Race
Place of birth for the foreign-born population - Ireland (%)
Place of birth for the foreign-born population - Denmark (%)
Place of birth for the foreign-born population - Norway (%)
Place of birth for the foreign-born population - Sweden (%)
Place of birth for the foreign-born population - United Kingdom (%)
Place of birth for the foreign-born population - England (%)
Place of birth for the foreign-born population - Scotland (%)
Place of birth for the foreign-born population - Other Northern Europe (%)
Place of birth for the foreign-born population - Austria (%)
Place of birth for the foreign-born population - Belgium (%)
Place of birth for the foreign-born population - France (%)
Place of birth for the foreign-born population - Germany (%)
Place of birth for the foreign-born population - Netherlands (%)
Place of birth for the foreign-born population - Switzerland (%)
Place of birth for the foreign-born population - Other Western Europe (%)
Place of birth for the foreign-born population - Greece (%)
Place of birth for the foreign-born population - Italy (%)
Place of birth for the foreign-born population - Portugal (%)
Place of birth for the foreign-born population - Spain (%)
Place of birth for the foreign-born population - Other Southern Europe (%)
Place of birth for the foreign-born population - Albania (%)
Place of birth for the foreign-born population - Belarus (%)
Place of birth for the foreign-born population - Bosnia and Herzegovina (%)
Place of birth for the foreign-born population - Bulgaria (%)
Place of birth for the foreign-born population - Croatia (%)
Place of birth for the foreign-born population - Czechoslovakia (%)
Place of birth for the foreign-born population - Hungary (%)
Place of birth for the foreign-born population - Latvia (%)
Place of birth for the foreign-born population - Lithuania (%)
Place of birth for the foreign-born population - North Macedonia (Macedonia) (%)
Place of birth for the foreign-born population - Moldova (%)
Place of birth for the foreign-born population - Poland (%)
Place of birth for the foreign-born population - Romania (%)
Place of birth for the foreign-born population - Russia (%)
Place of birth for the foreign-born population - Serbia (%)
Place of birth for the foreign-born population - Ukraine (%)
Place of birth for the foreign-born population - Other Eastern Europe (%)
Place of birth for the foreign-born population - China (%)
Place of birth for the foreign-born population - Hong Kong (%)
Place of birth for the foreign-born population - Taiwan (%)
Place of birth for the foreign-born population - Japan (%)
Place of birth for the foreign-born population - Korea (%)
Place of birth for the foreign-born population - Other Eastern Asia (%)
Place of birth for the foreign-born population - Afghanistan (%)
Place of birth for the foreign-born population - Bangladesh (%)
Place of birth for the foreign-born population - India (%)
Place of birth for the foreign-born population - Iran (%)
Place of birth for the foreign-born population - Kazakhstan (%)
Place of birth for the foreign-born population - Nepal (%)
Place of birth for the foreign-born population - Pakistan (%)
Place of birth for the foreign-born population - Sri Lanka (%)
Place of birth for the foreign-born population - Uzbekistan (%)
Place of birth for the foreign-born population - Other South Central Asia (%)
Place of birth for the foreign-born population - Burma (%)
Place of birth for the foreign-born population - Cambodia (%)
Place of birth for the foreign-born population - Indonesia (%)
Place of birth for the foreign-born population - Laos (%)
Place of birth for the foreign-born population - Malaysia (%)
Place of birth for the foreign-born population - Philippines (%)
Place of birth for the foreign-born population - Singapore (%)
Place of birth for the foreign-born population - Thailand (%)
Place of birth for the foreign-born population - Vietnam (%)
Place of birth for the foreign-born population - Other South Eastern Asia (%)
Place of birth for the foreign-born population - Armenia (%)
Place of birth for the foreign-born population - Iraq (%)
Place of birth for the foreign-born population - Israel (%)
Place of birth for the foreign-born population - Jordan (%)
Place of birth for the foreign-born population - Kuwait (%)
Place of birth for the foreign-born population - Lebanon (%)
Place of birth for the foreign-born population - Saudi Arabia (%)
Place of birth for the foreign-born population - Syria (%)
Place of birth for the foreign-born population - Turkey (%)
Place of birth for the foreign-born population - Yemen (%)
Place of birth for the foreign-born population - Other Western Asia (%)
Place of birth for the foreign-born population - Eritrea (%)
Place of birth for the foreign-born population - Ethiopia (%)
Place of birth for the foreign-born population - Kenya (%)
Place of birth for the foreign-born population - Somalia (%)
Place of birth for the foreign-born population - Uganda (%)
Place of birth for the foreign-born population - Zimbabwe (%)
Place of birth for the foreign-born population - Other Eastern Africa (%)
Place of birth for the foreign-born population - Cameroon (%)
Place of birth for the foreign-born population - Congo (%)
Place of birth for the foreign-born population - Democratic Republic of Congo (Zaire) (%)
Place of birth for the foreign-born population - Other Middle Africa (%)
Place of birth for the foreign-born population - Egypt (%)
Place of birth for the foreign-born population - Morocco (%)
Place of birth for the foreign-born population - Sudan (%)
Place of birth for the foreign-born population - Other Northern Africa (%)
Place of birth for the foreign-born population - South Africa (%)
Place of birth for the foreign-born population - Other Southern Africa (%)
Place of birth for the foreign-born population - Cabo Verde (%)
Place of birth for the foreign-born population - Ghana (%)
Place of birth for the foreign-born population - Liberia (%)
Place of birth for the foreign-born population - Nigeria (%)
Place of birth for the foreign-born population - Senegal (%)
Place of birth for the foreign-born population - Sierra Leone (%)
Place of birth for the foreign-born population - Other Western Africa (%)
Place of birth for the foreign-born population - Australia (%)
Place of birth for the foreign-born population - New Zealand (%)
Place of birth for the foreign-born population - Fiji (%)
Place of birth for the foreign-born population - Micronesia (%)
Place of birth for the foreign-born population - Bahamas (%)
Place of birth for the foreign-born population - Barbados (%)
Place of birth for the foreign-born population - Cuba (%)
Place of birth for the foreign-born population - Dominica (%)
Place of birth for the foreign-born population - Dominican Republic (%)
Place of birth for the foreign-born population - Grenada (%)
Place of birth for the foreign-born population - Haiti (%)
Place of birth for the foreign-born population - Jamaica (%)
Place of birth for the foreign-born population - St. Vincent and the Grenadines (%)
Place of birth for the foreign-born population - Trinidad and Tobago (%)
Place of birth for the foreign-born population - West Indies (%)
Place of birth for the foreign-born population - Other Caribbean (%)
Place of birth for the foreign-born population - Belize (%)
Place of birth for the foreign-born population - Costa Rica (%)
Place of birth for the foreign-born population - El Salvador (%)
Place of birth for the foreign-born population - Guatemala (%)
Place of birth for the foreign-born population - Honduras (%)
Place of birth for the foreign-born population - Mexico (%)
Place of birth for the foreign-born population - Nicaragua (%)
Place of birth for the foreign-born population - Panama (%)
Place of birth for the foreign-born population - Other Central America (%)
Place of birth for the foreign-born population - Argentina (%)
Place of birth for the foreign-born population - Bolivia (%)
Place of birth for the foreign-born population - Brazil (%)
Place of birth for the foreign-born population - Chile (%)
Place of birth for the foreign-born population - Colombia (%)
Place of birth for the foreign-born population - Ecuador (%)
Place of birth for the foreign-born population - Guyana (%)
Place of birth for the foreign-born population - Peru (%)
Place of birth for the foreign-born population - Uruguay (%)
Place of birth for the foreign-born population - Venezuela (%)
Place of birth for the foreign-born population - Other South America (%)
Place of birth for the foreign-born population - Canada (%)
Place of birth for the foreign-born population - Other Northern America (%)
Place of birth for the foreign-born population - Other (%)
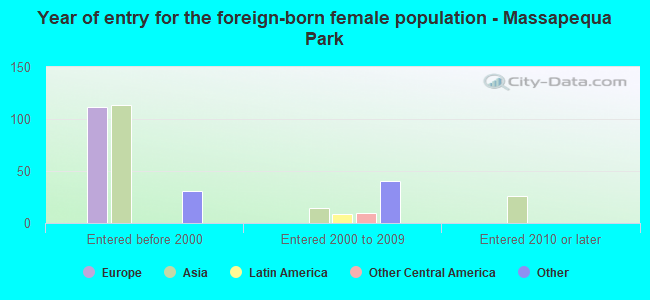
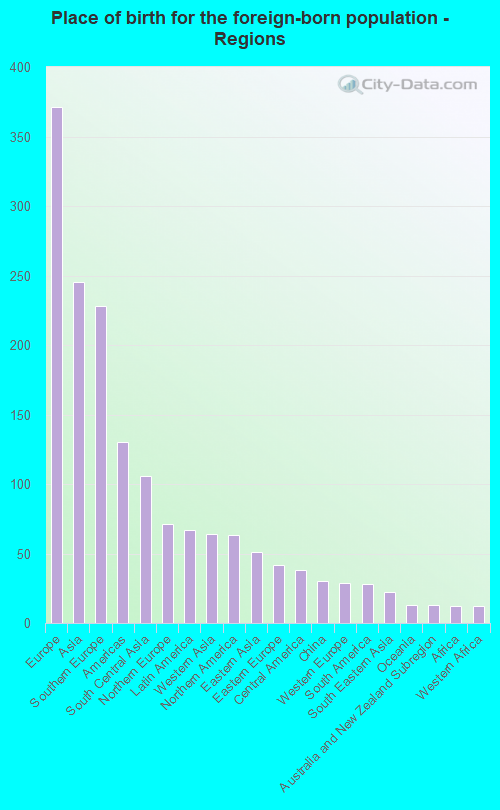
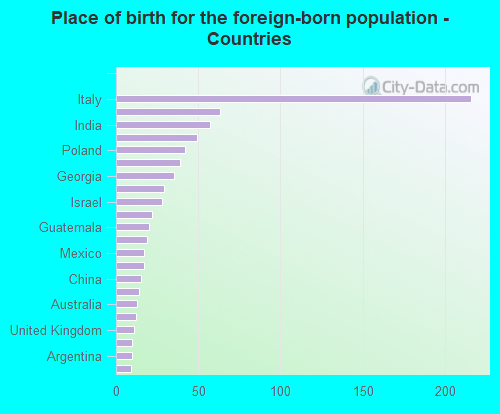
According to 2022 data, the most numerous races in Massapequa Park, NY are White alone (14,459 residents), Hispanic (828 residents), and Black alone (100 residents). 93.9% of Massapequa Park residents speak English at home. 4.6% of Massapequa Park, NY residents are foreign-born (2.2% born in Europe, 1.5% born in Asia), which is 382.6% less than the foreign-born rate of 22.0% across the entire state of New York.
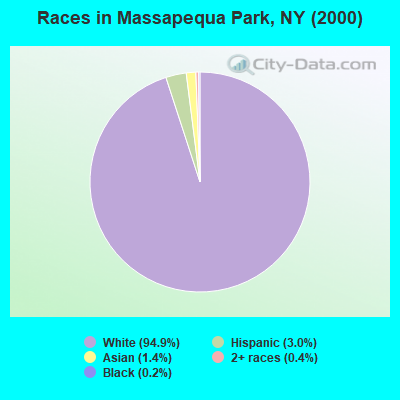
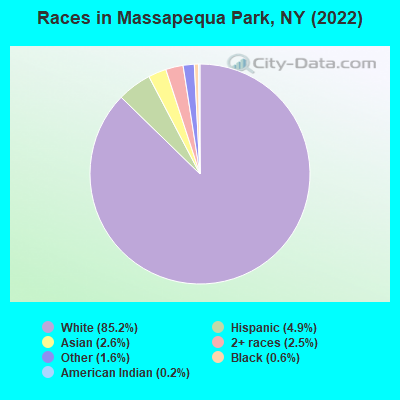
Race distribution in Massapequa Park
2000 2022
11,760,981 62.0% White alone 2,867,583 15.1% Hispanic 2,812,623 14.8% Black alone 1,035,926 5.5% Asian alone 366,116 1.9% Two or more races 75,499 0.4% Other race alone 52,499 0.3% American Indian alone 5,230 0.03% Native Hawaiian and Other
10,408,933 52.9% White alone 3,867,299 19.7% Hispanic 2,633,840 13.4% Black alone 1,776,286 9.0% Asian alone 732,670 3.7% Two or more races 216,110 1.1% Other race alone 35,082 0.2% American Indian alone 6,931 0.04% Native Hawaiian and Other
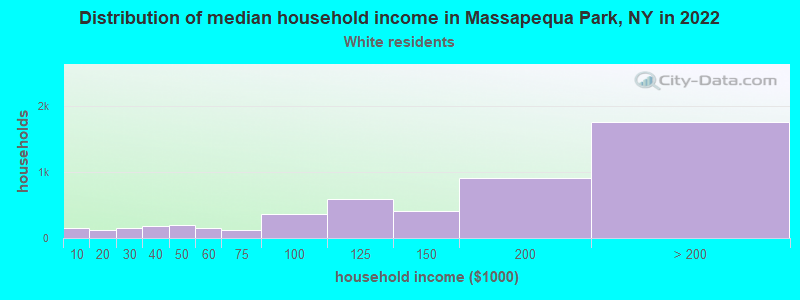
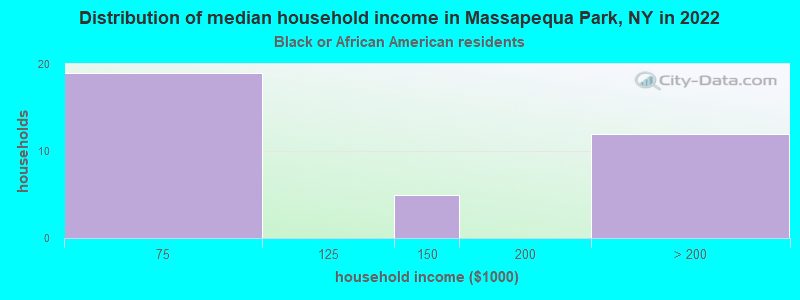
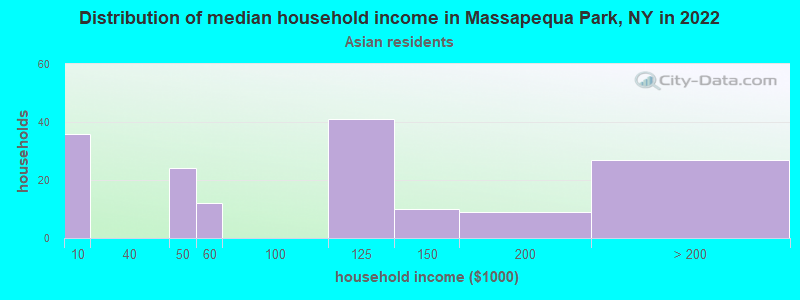
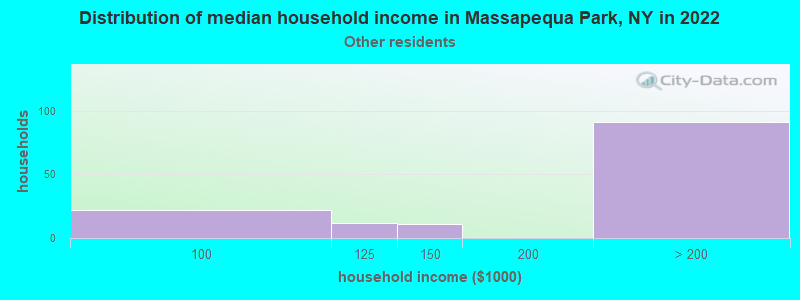
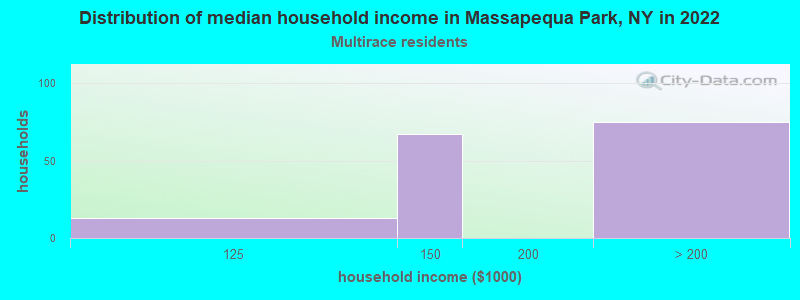
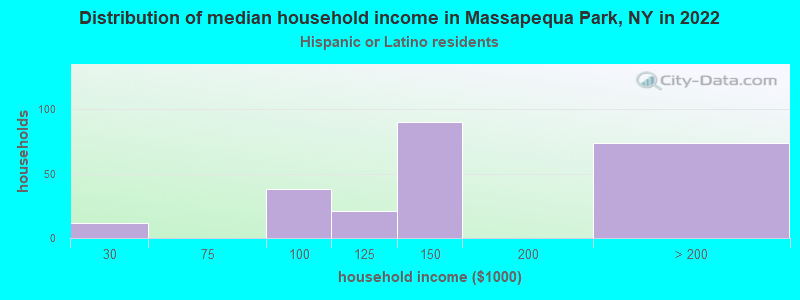
Income and house value in Massapequa Park Median household income in 2022 $157,775 White non-Hispanic householders$100,828 Asian householdersover $200,000 Some other race householders$196,078 Two or more races householders$148,894 Hispanic or Latino race householdersMedian 2022 house value $633,920 White Non-Hispanic householders$302,443 Black or African American householders$302,443 American Indian or Alaska Native householders $689,032 Asian householders$641,179 Some other race householders$566,442 Two or more races householders$634,189 Hispanic or Latino householders
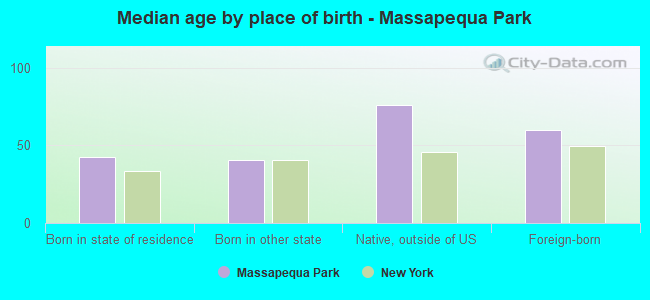
Median age by race in Massapequa Park
47.2 Median age for White residents45.4 48.6 49.1 Median age for Black or African American residents24.9 50.5 -855,158,729.3 Median age for American Indian / Alaska Native residents-607,543,322.5 -837,121,211.3 41.0 Median age for Asian residents44.4 36.7 -487,992,314.6 Median age for Native Hawaiian / Pacific Islander residents-477,502,295.2 -497,387,669.3 39.4 Median age for Other race residents38.2 37.9 20.4 Median age for Two or more races residents28.1 12.2 46.9 Median age for White alone residents45.5 47.9 29.6 Median age for Hispanic or Latino residents28.5 29.8
Owner/renter occupied households by race in Massapequa Park
House owners and renters - White residents 4,966 97.9% Owner occupied105 2.1% Renter occupiedHouse owners and renters - Black or African American residents 36 100.0% Owner occupiedHouse owners and renters - Asian residents 161 96.3% Owner occupied6 3.7% Renter occupiedHouse owners and renters - Other race residents 134 100.0% Owner occupiedHouse owners and renters - Two or more races residents 163 100.0% Owner occupiedHouse owners and renters - White alone residents 5,016 97.8% Owner occupied113 2.2% Renter occupiedHouse owners and renters - Hispanic or Latino residents 231 100.0% Owner occupied
Language usage in Massapequa Park
English speakers - Total 93.9% of residents of Massapequa Park speak English at home.
1.3% of residents speak Spanish at home 151 70.2% Speak English very well64 29.8% Speak English less than very well3.8% of residents speak other language at home 473 77.3% Speak English very well139 22.7% Speak English less than very well
English speakers - Born in the United States 94.3% of residents of Massapequa Park speak English at home.
3.8% of residents speak other language at home 30 100.0% Speak English very well
English speakers - Native, born elsewhere 28.9% of residents of Massapequa Park speak English at home.
68.9% of residents speak Spanish at home 11 35.5% Speak English very well20 64.5% Speak English less than very well
English speakers - Foreign-born 56.2% of residents of Massapequa Park speak English at home.
4.5% of residents speak Spanish at home 15 41.7% Speak English very well21 58.3% Speak English less than very well37.5% of residents speak other language at home 178 59.3% Speak English very well122 40.7% Speak English less than very well
White (Caucasian) - Speak only English Native:
99.5% (13,248)Foreign-born:
90.7% (361)
White (Caucasian) - Speak another language Native:
1.8% (243)Foreign-born:
22.7% (90)
Black or African American - Speak another language Native:
17.4% (15)Foreign-born:
100.0% (13)
Asian - Speak only English Native:
71.5% (148)Foreign-born:
21.9% (47)
Asian - Speak another language Native:
30.0% (62)Foreign-born:
75.5% (160)
Other race - Speak only English Native:
96.7% (238)Foreign-born:
24.7% (15)
Other race - Speak another language Native:
12.1% (30)Foreign-born:
69.9% (43)
Two or more races - Speak only English Native:
84.3% (726)Foreign-born:
89.0% (13)
White alone - Speak only English Native:
98.8% (13,099)Foreign-born:
76.0% (383)
White alone - Speak another language Native:
1.6% (218)Foreign-born:
22.8% (115)
Hispanic or Latino - Speak only English Native:
79.6% (588)Foreign-born:
26.5% (17)
Hispanic or Latino - Speak another language Native:
19.6% (145)Foreign-born:
73.5% (48)
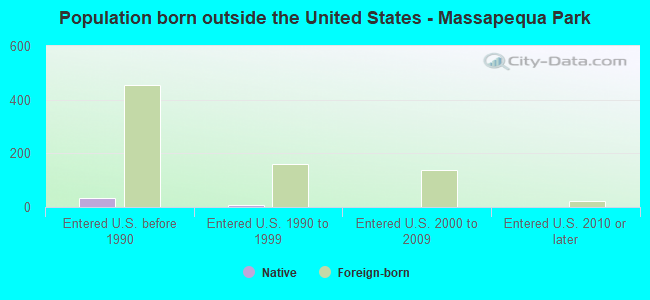
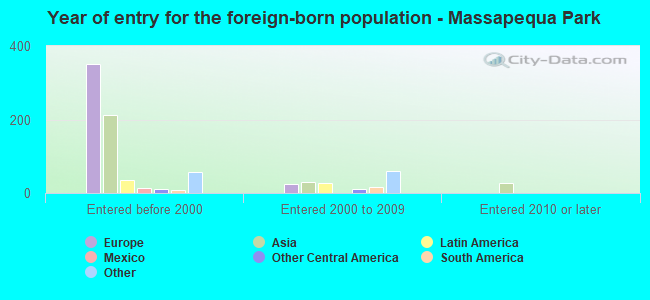
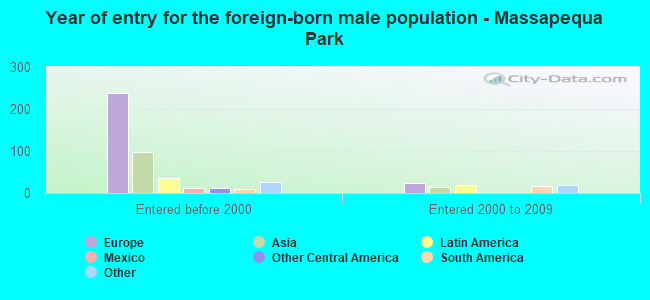
Foreign-born residents in Massapequa Park 774 residents are foreign born (2.2% Europe , 1.5% Asia ).
This city:
4.6%New York:
22.6%
Marital status for residents in Massapequa Park Marital status - White (Caucasian) population 15 years and over
Males 27.2% Never married63.6% Now married0.2% Separated4.3% Widowed4.6% DivorcedFemales 24.4% Never married58.7% Now married0.7% Separated8.7% Widowed7.5% DivorcedWomen who gave birth in the past 12 months Now married:
100.0% (262)Unmarried:
0.0% (0)
Women who did not give birth in the past 12 months Now married:
44.4% (1,152)Unmarried:
55.6% (1,443)
Marital status - Black or African American population 15 years and over
Males 60.5% Never married39.5% Now married0.0% Separated0.0% Widowed0.0% DivorcedFemales 45.8% Never married54.2% Now married0.0% Separated0.0% Widowed0.0% DivorcedWomen who did not give birth in the past 12 months Now married:
100.0% (12)Unmarried:
0.0% (0)
Marital status - Asian population 15 years and over
Males 12.1% Never married80.9% Now married0.0% Separated0.0% Widowed7.0% DivorcedFemales 27.4% Never married72.6% Now married0.0% Separated0.0% Widowed0.0% DivorcedWomen who gave birth in the past 12 months Now married:
100.0% (10)Unmarried:
0.0% (0)
Women who did not give birth in the past 12 months Now married:
49.4% (46)Unmarried:
50.6% (47)
Marital status - Other race population 15 years and over
Males 9.9% Never married82.9% Now married0.0% Separated7.2% Widowed0.0% DivorcedFemales 35.4% Never married64.6% Now married0.0% Separated0.0% Widowed0.0% DivorcedWomen who gave birth in the past 12 months Now married:
100.0% (3)Unmarried:
0.0% (0)
Women who did not give birth in the past 12 months Now married:
63.8% (92)Unmarried:
36.2% (52)
Marital status - Two or more races population 15 years and over
Males 50.4% Never married39.5% Now married0.0% Separated10.2% Widowed0.0% DivorcedFemales 24.7% Never married70.2% Now married0.0% Separated0.0% Widowed5.1% DivorcedWomen who gave birth in the past 12 months Now married:
100.0% (26)Unmarried:
0.0% (0)
Women who did not give birth in the past 12 months Now married:
64.5% (121)Unmarried:
35.5% (67)
Marital status - White alone, not Hispanic / Latino population 15 years and over
Males 27.0% Never married63.7% Now married0.2% Separated4.4% Widowed4.7% DivorcedFemales 24.4% Never married58.8% Now married0.6% Separated8.7% Widowed7.5% DivorcedWomen who gave birth in the past 12 months Now married:
100.0% (280)Unmarried:
0.0% (0)
Women who did not give birth in the past 12 months Now married:
43.9% (1,183)Unmarried:
56.1% (1,512)
Marital status - Hispanic or Latino population 15 years and over
Males 39.1% Never married60.9% Now married0.0% Separated0.0% Widowed0.0% DivorcedFemales 29.2% Never married62.4% Now married2.2% Separated3.1% Widowed3.1% DivorcedWomen who gave birth in the past 12 months Now married:
100.0% (17)Unmarried:
0.0% (0)
Women who did not give birth in the past 12 months Now married:
62.0% (133)Unmarried:
38.0% (81)
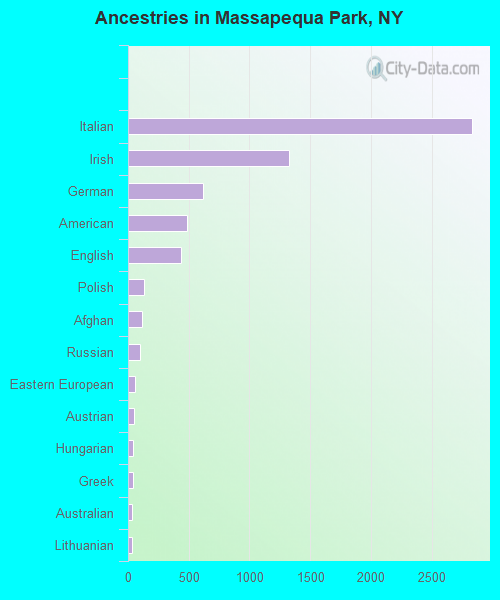
Ancestries in Massapequa Park
2,831 41.6% Italian1,326 19.5% Irish619 9.1% German482 7.1% American439 6.5% English134 2.0% Polish118 1.7% Afghan96 1.4% Russian60 0.9% Eastern European49 0.7% Austrian45 0.7% Hungarian39 0.6% Greek30 0.4% Australian30 0.4% Lithuanian22 0.3% Northern European18 0.3% African14 0.2% Scandinavian13 0.2% European12 0.2% Canadian11 0.2% Maltese10 0.1% Belgian9 0.1% Croatian9 0.1% Scotch-Irish8 0.1% Ukrainian7 0.1% Egyptian7 0.1% Bulgarian6 0.09% Armenian6 0.09% Swiss5 0.07% Danish5 0.07% French4 0.06% Guyanese
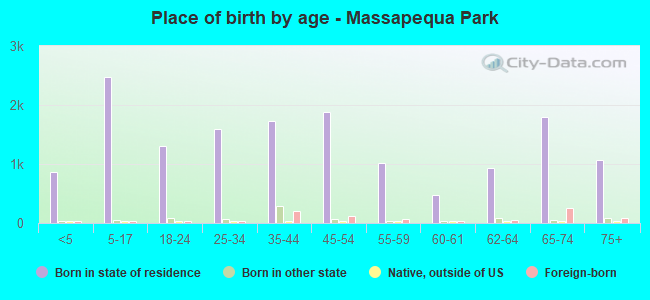
Children Nativity (place of birth) in Massapequa Park
Children under 6 years - Living with two parents Both parents native 943 100.0% NativeOne native, one foreign-born parent 125 100.0% NativeChildren under 6 years - Living with one parent Native parent 44 100.0% Native
Children 6 to 17 years - Living with two parents Both parents native 1,641 99.6% Native6 0.4% Foreign-bornBoth parents foreign-born 149 100.0% NativeOne native, one foreign-born parent 115 100.0% NativeChildren 6 to 17 years - Living with one parent Native parent 306 100.0% Native
Grandparents responsible for own grandchildren in Massapequa Park
Grandparents (30 to 59 years) White / Caucasian 30 80.7% Responsible for grandchildren7 19.3% Not responsible for grandchildrenWhite alone, not Hispanic / Latino 32 87.5% Responsible for grandchildren5 12.5% Not responsible for grandchildrenGrandparents (60 years and over) White / Caucasian 40 27.2% Responsible for grandchildren106 72.8% Not responsible for grandchildrenWhite alone, not Hispanic / Latino 37 25.1% Responsible for grandchildren112 74.9% Not responsible for grandchildren