Races in Medfield, Massachusetts (MA) Detailed Stats
Data:
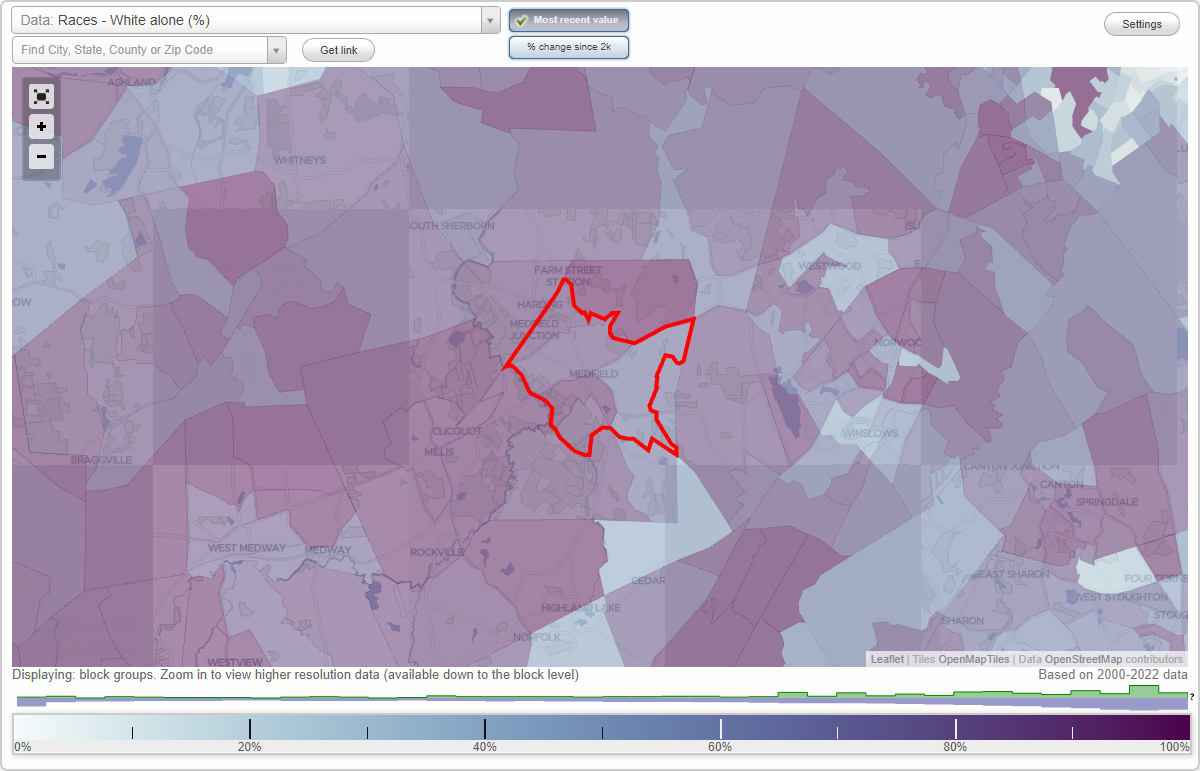
Races - White alone (%)
Races - White alone (% change since 2000)
Races - Black alone (%)
Races - Black alone (% change since 2000)
Races - American Indian alone (%)
Races - American Indian alone (% change since 2000)
Races - Asian alone (%)
Races - Asian alone (% change since 2000)
Races - Hispanic (%)
Races - Hispanic (% change since 2000)
Races - Native Hawaiian and Other Pacific Islander alone (%)
Races - Native Hawaiian and Other Pacific Islander alone (% change since 2000)
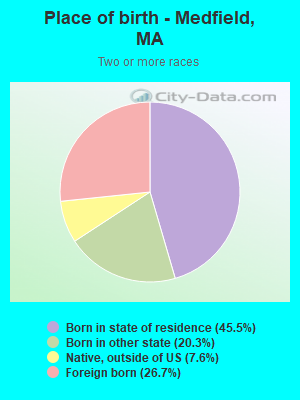
Races - Two or more races(%)
Races - Two or more races(% change since 2000)
Races - Other race alone (%)
Races - Other race alone (% change since 2000)
Racial diversity
Place of birth - Born in state of residence (%)
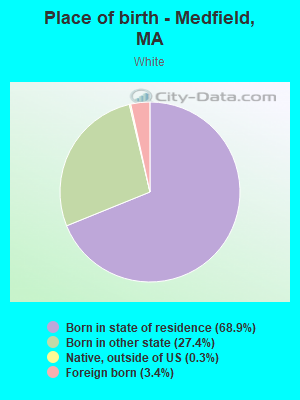
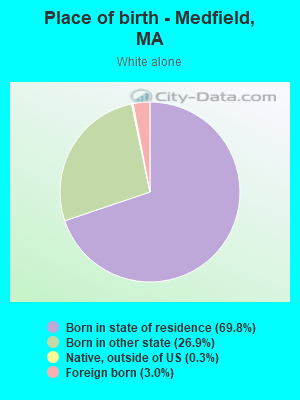
Place of birth - Born in state of residence (%) - White
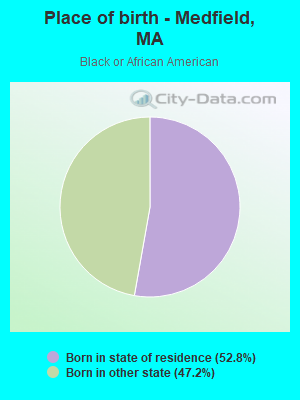
Place of birth - Born in state of residence (%) - Black or African American
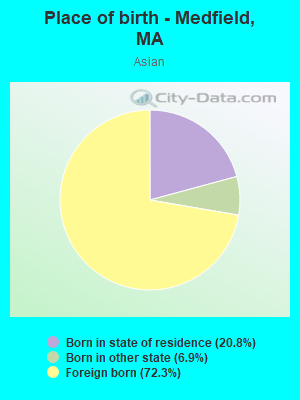
Place of birth - Born in state of residence (%) - Asian
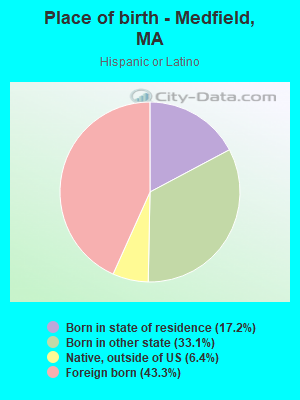
Place of birth - Born in state of residence (%) - Hispanic or Latino
Place of birth - Born in state of residence (%) - American Indian and Alaska Native
Place of birth - Born in state of residence (%) - Multirace
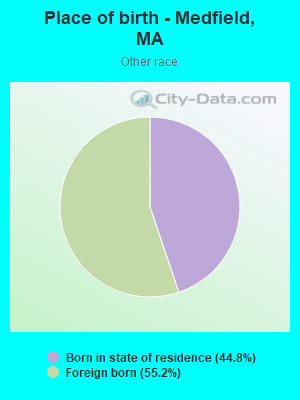
Place of birth - Born in state of residence (%) - Other Race
Place of birth - Born in other state (%)
Place of birth - Born in other state (%) - White
Place of birth - Born in other state (%) - Black or African American
Place of birth - Born in other state (%) - Asian
Place of birth - Born in other state (%) - Hispanic or Latino
Place of birth - Born in other state (%) - American Indian and Alaska Native
Place of birth - Born in other state (%) - Multirace
Place of birth - Born in other state (%) - Other Race
Place of birth - Native, outside of US (%)
Place of birth - Native, outside of US (%) - White
Place of birth - Native, outside of US (%) - Black or African American
Place of birth - Native, outside of US (%) - Asian
Place of birth - Native, outside of US (%) - Hispanic or Latino
Place of birth - Native, outside of US (%) - American Indian and Alaska Native
Place of birth - Native, outside of US (%) - Multirace
Place of birth - Native, outside of US (%) - Other Race
Place of birth - Foreign born (%)
Place of birth - Foreign born (%) - White
Place of birth - Foreign born (%) - Black or African American
Place of birth - Foreign born (%) - Asian
Place of birth - Foreign born (%) - Hispanic or Latino
Place of birth - Foreign born (%) - American Indian and Alaska Native
Place of birth - Foreign born (%) - Multirace
Place of birth - Foreign born (%) - Other Race
Residents speaking English at home (%)
Residents speaking English at home - Born in the United States (%)
Residents speaking English at home - Native, born elsewhere (%)
Residents speaking English at home - Foreign born (%)
Residents speaking Spanish at home (%)
Residents speaking Spanish at home - Born in the United States (%)
Residents speaking Spanish at home - Native, born elsewhere (%)
Residents speaking Spanish at home - Foreign born (%)
Residents speaking other language at home (%)
Residents speaking other language at home - Born in the United States (%)
Residents speaking other language at home - Native, born elsewhere (%)
Residents speaking other language at home - Foreign born (%)
Marital status - Never married (%)
Marital status - Now married (%)
Marital status - Separated (%)
Marital status - Widowed (%)
Marital status - Divorced (%)
Ancestries Reported - Arab (%)
Ancestries Reported - Czech (%)
Ancestries Reported - Danish (%)
Ancestries Reported - Dutch (%)
Ancestries Reported - English (%)
Ancestries Reported - French (%)
Ancestries Reported - French Canadian (%)
Ancestries Reported - German (%)
Ancestries Reported - Greek (%)
Ancestries Reported - Hungarian (%)
Ancestries Reported - Irish (%)
Ancestries Reported - Italian (%)
Ancestries Reported - Lithuanian (%)
Ancestries Reported - Norwegian (%)
Ancestries Reported - Polish (%)
Ancestries Reported - Portuguese (%)
Ancestries Reported - Russian (%)
Ancestries Reported - Scotch-Irish (%)
Ancestries Reported - Scottish (%)
Ancestries Reported - Slovak (%)
Ancestries Reported - Subsaharan African (%)
Ancestries Reported - Swedish (%)
Ancestries Reported - Swiss (%)
Ancestries Reported - Ukrainian (%)
Ancestries Reported - United States (%)
Ancestries Reported - Welsh (%)
Ancestries Reported - West Indian (%)
Ancestries Reported - Other (%)
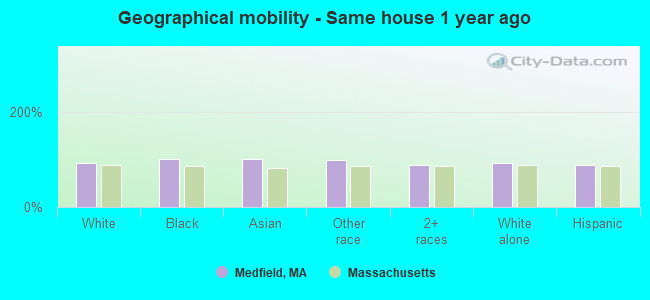
Geographical mobility - Same house 1 year ago (%)
Geographical mobility - Same house 1 year ago (%) - White
Geographical mobility - Same house 1 year ago (%) - Black or African American
Geographical mobility - Same house 1 year ago (%) - Asian
Geographical mobility - Same house 1 year ago (%) - Hispanic or Latino
Geographical mobility - Same house 1 year ago (%) - American Indian and Alaska Native
Geographical mobility - Same house 1 year ago (%) - Multirace
Geographical mobility - Same house 1 year ago (%) - Other Race
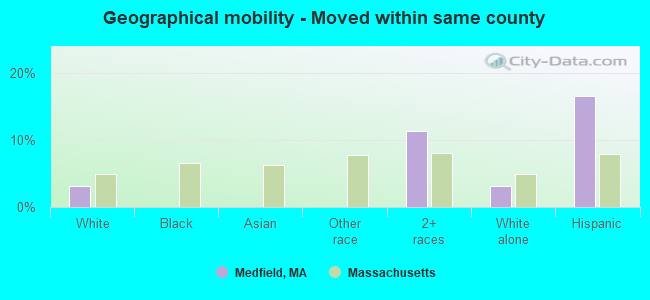
Geographical mobility - Moved within same county (%)
Geographical mobility - Moved within same county (%) - White
Geographical mobility - Moved within same county (%) - Black or African American
Geographical mobility - Moved within same county (%) - Asian
Geographical mobility - Moved within same county (%) - Hispanic or Latino
Geographical mobility - Moved within same county (%) - American Indian and Alaska Native
Geographical mobility - Moved within same county (%) - Multirace
Geographical mobility - Moved within same county (%) - Other Race
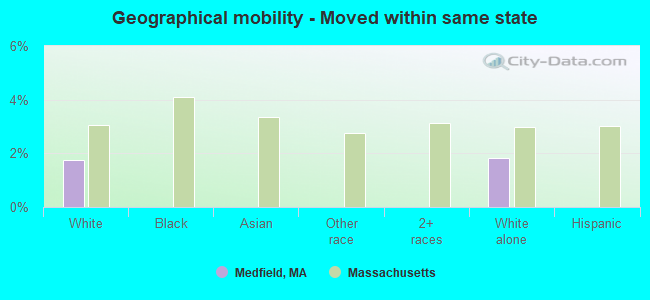
Geographical mobility - Moved from different county within same state (%)
Geographical mobility - Moved from different county within same state (%) - White
Geographical mobility - Moved from different county within same state (%) - Black or African American
Geographical mobility - Moved from different county within same state (%) - Asian
Geographical mobility - Moved from different county within same state (%) - Hispanic or Latino
Geographical mobility - Moved from different county within same state (%) - American Indian and Alaska Native
Geographical mobility - Moved from different county within same state (%) - Multirace
Geographical mobility - Moved from different county within same state (%) - Other Race
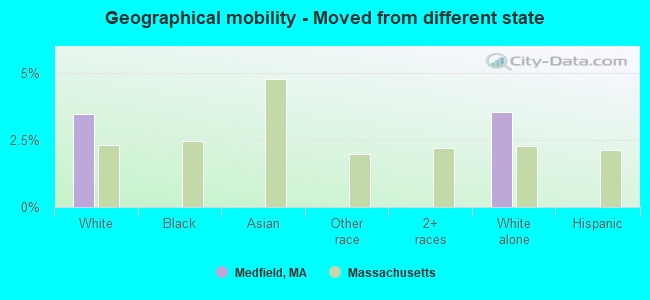
Geographical mobility - Moved from different state (%)
Geographical mobility - Moved from different state (%) - White
Geographical mobility - Moved from different state (%) - Black or African American
Geographical mobility - Moved from different state (%) - Asian
Geographical mobility - Moved from different state (%) - Hispanic or Latino
Geographical mobility - Moved from different state (%) - American Indian and Alaska Native
Geographical mobility - Moved from different state (%) - Multirace
Geographical mobility - Moved from different state (%) - Other Race
Geographical mobility - Moved from abroad (%)
Geographical mobility - Moved from abroad (%) - White
Geographical mobility - Moved from abroad (%) - Black or African American
Geographical mobility - Moved from abroad (%) - Asian
Geographical mobility - Moved from abroad (%) - Hispanic or Latino
Geographical mobility - Moved from abroad (%) - American Indian and Alaska Native
Geographical mobility - Moved from abroad (%) - Multirace
Geographical mobility - Moved from abroad (%) - Other Race
Place of birth for the foreign-born population - Ireland (%)
Place of birth for the foreign-born population - Denmark (%)
Place of birth for the foreign-born population - Norway (%)
Place of birth for the foreign-born population - Sweden (%)
Place of birth for the foreign-born population - United Kingdom (%)
Place of birth for the foreign-born population - England (%)
Place of birth for the foreign-born population - Scotland (%)
Place of birth for the foreign-born population - Other Northern Europe (%)
Place of birth for the foreign-born population - Austria (%)
Place of birth for the foreign-born population - Belgium (%)
Place of birth for the foreign-born population - France (%)
Place of birth for the foreign-born population - Germany (%)
Place of birth for the foreign-born population - Netherlands (%)
Place of birth for the foreign-born population - Switzerland (%)
Place of birth for the foreign-born population - Other Western Europe (%)
Place of birth for the foreign-born population - Greece (%)
Place of birth for the foreign-born population - Italy (%)
Place of birth for the foreign-born population - Portugal (%)
Place of birth for the foreign-born population - Spain (%)
Place of birth for the foreign-born population - Other Southern Europe (%)
Place of birth for the foreign-born population - Albania (%)
Place of birth for the foreign-born population - Belarus (%)
Place of birth for the foreign-born population - Bosnia and Herzegovina (%)
Place of birth for the foreign-born population - Bulgaria (%)
Place of birth for the foreign-born population - Croatia (%)
Place of birth for the foreign-born population - Czechoslovakia (%)
Place of birth for the foreign-born population - Hungary (%)
Place of birth for the foreign-born population - Latvia (%)
Place of birth for the foreign-born population - Lithuania (%)
Place of birth for the foreign-born population - North Macedonia (Macedonia) (%)
Place of birth for the foreign-born population - Moldova (%)
Place of birth for the foreign-born population - Poland (%)
Place of birth for the foreign-born population - Romania (%)
Place of birth for the foreign-born population - Russia (%)
Place of birth for the foreign-born population - Serbia (%)
Place of birth for the foreign-born population - Ukraine (%)
Place of birth for the foreign-born population - Other Eastern Europe (%)
Place of birth for the foreign-born population - China (%)
Place of birth for the foreign-born population - Hong Kong (%)
Place of birth for the foreign-born population - Taiwan (%)
Place of birth for the foreign-born population - Japan (%)
Place of birth for the foreign-born population - Korea (%)
Place of birth for the foreign-born population - Other Eastern Asia (%)
Place of birth for the foreign-born population - Afghanistan (%)
Place of birth for the foreign-born population - Bangladesh (%)
Place of birth for the foreign-born population - India (%)
Place of birth for the foreign-born population - Iran (%)
Place of birth for the foreign-born population - Kazakhstan (%)
Place of birth for the foreign-born population - Nepal (%)
Place of birth for the foreign-born population - Pakistan (%)
Place of birth for the foreign-born population - Sri Lanka (%)
Place of birth for the foreign-born population - Uzbekistan (%)
Place of birth for the foreign-born population - Other South Central Asia (%)
Place of birth for the foreign-born population - Burma (%)
Place of birth for the foreign-born population - Cambodia (%)
Place of birth for the foreign-born population - Indonesia (%)
Place of birth for the foreign-born population - Laos (%)
Place of birth for the foreign-born population - Malaysia (%)
Place of birth for the foreign-born population - Philippines (%)
Place of birth for the foreign-born population - Singapore (%)
Place of birth for the foreign-born population - Thailand (%)
Place of birth for the foreign-born population - Vietnam (%)
Place of birth for the foreign-born population - Other South Eastern Asia (%)
Place of birth for the foreign-born population - Armenia (%)
Place of birth for the foreign-born population - Iraq (%)
Place of birth for the foreign-born population - Israel (%)
Place of birth for the foreign-born population - Jordan (%)
Place of birth for the foreign-born population - Kuwait (%)
Place of birth for the foreign-born population - Lebanon (%)
Place of birth for the foreign-born population - Saudi Arabia (%)
Place of birth for the foreign-born population - Syria (%)
Place of birth for the foreign-born population - Turkey (%)
Place of birth for the foreign-born population - Yemen (%)
Place of birth for the foreign-born population - Other Western Asia (%)
Place of birth for the foreign-born population - Eritrea (%)
Place of birth for the foreign-born population - Ethiopia (%)
Place of birth for the foreign-born population - Kenya (%)
Place of birth for the foreign-born population - Somalia (%)
Place of birth for the foreign-born population - Uganda (%)
Place of birth for the foreign-born population - Zimbabwe (%)
Place of birth for the foreign-born population - Other Eastern Africa (%)
Place of birth for the foreign-born population - Cameroon (%)
Place of birth for the foreign-born population - Congo (%)
Place of birth for the foreign-born population - Democratic Republic of Congo (Zaire) (%)
Place of birth for the foreign-born population - Other Middle Africa (%)
Place of birth for the foreign-born population - Egypt (%)
Place of birth for the foreign-born population - Morocco (%)
Place of birth for the foreign-born population - Sudan (%)
Place of birth for the foreign-born population - Other Northern Africa (%)
Place of birth for the foreign-born population - South Africa (%)
Place of birth for the foreign-born population - Other Southern Africa (%)
Place of birth for the foreign-born population - Cabo Verde (%)
Place of birth for the foreign-born population - Ghana (%)
Place of birth for the foreign-born population - Liberia (%)
Place of birth for the foreign-born population - Nigeria (%)
Place of birth for the foreign-born population - Senegal (%)
Place of birth for the foreign-born population - Sierra Leone (%)
Place of birth for the foreign-born population - Other Western Africa (%)
Place of birth for the foreign-born population - Australia (%)
Place of birth for the foreign-born population - New Zealand (%)
Place of birth for the foreign-born population - Fiji (%)
Place of birth for the foreign-born population - Micronesia (%)
Place of birth for the foreign-born population - Bahamas (%)
Place of birth for the foreign-born population - Barbados (%)
Place of birth for the foreign-born population - Cuba (%)
Place of birth for the foreign-born population - Dominica (%)
Place of birth for the foreign-born population - Dominican Republic (%)
Place of birth for the foreign-born population - Grenada (%)
Place of birth for the foreign-born population - Haiti (%)
Place of birth for the foreign-born population - Jamaica (%)
Place of birth for the foreign-born population - St. Vincent and the Grenadines (%)
Place of birth for the foreign-born population - Trinidad and Tobago (%)
Place of birth for the foreign-born population - West Indies (%)
Place of birth for the foreign-born population - Other Caribbean (%)
Place of birth for the foreign-born population - Belize (%)
Place of birth for the foreign-born population - Costa Rica (%)
Place of birth for the foreign-born population - El Salvador (%)
Place of birth for the foreign-born population - Guatemala (%)
Place of birth for the foreign-born population - Honduras (%)
Place of birth for the foreign-born population - Mexico (%)
Place of birth for the foreign-born population - Nicaragua (%)
Place of birth for the foreign-born population - Panama (%)
Place of birth for the foreign-born population - Other Central America (%)
Place of birth for the foreign-born population - Argentina (%)
Place of birth for the foreign-born population - Bolivia (%)
Place of birth for the foreign-born population - Brazil (%)
Place of birth for the foreign-born population - Chile (%)
Place of birth for the foreign-born population - Colombia (%)
Place of birth for the foreign-born population - Ecuador (%)
Place of birth for the foreign-born population - Guyana (%)
Place of birth for the foreign-born population - Peru (%)
Place of birth for the foreign-born population - Uruguay (%)
Place of birth for the foreign-born population - Venezuela (%)
Place of birth for the foreign-born population - Other South America (%)
Place of birth for the foreign-born population - Canada (%)
Place of birth for the foreign-born population - Other Northern America (%)
Place of birth for the foreign-born population - Other (%)
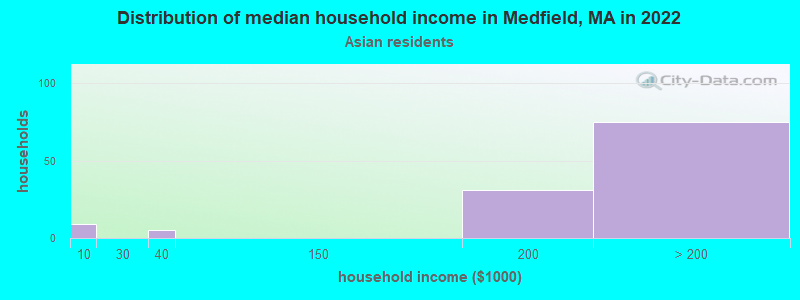
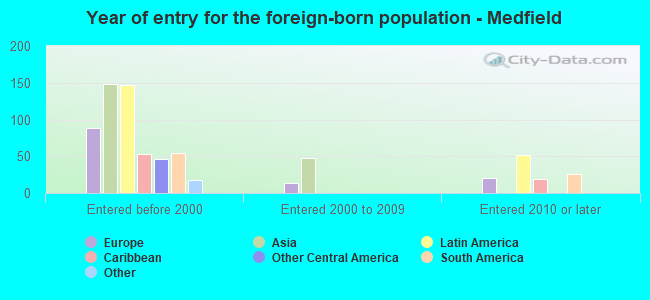
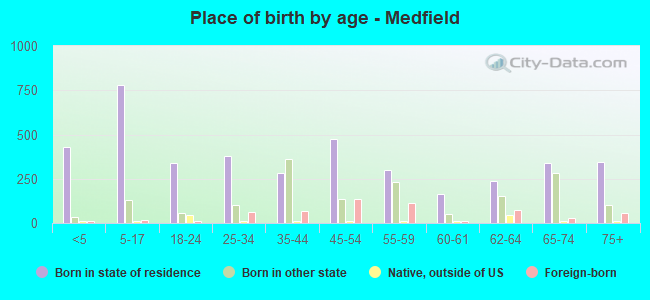
According to 2022 data, the most numerous races in Medfield, MA are White alone (5,160 residents), Hispanic (411 residents), and Asian alone (297 residents). 88.1% of Medfield residents speak English at home. 8.7% of Medfield, MA residents are foreign-born (3.1% born in Asia, 2.8% born in Latin America, 2.2% born in Europe), which is 106.6% less than the foreign-born rate of 18.0% across the entire state of Massachusetts.
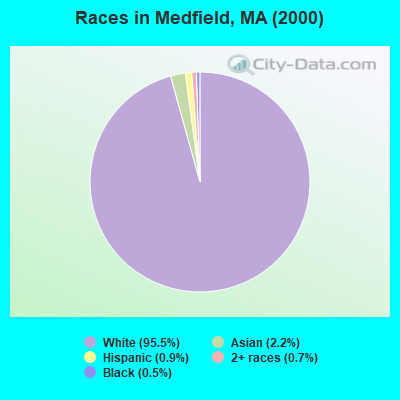
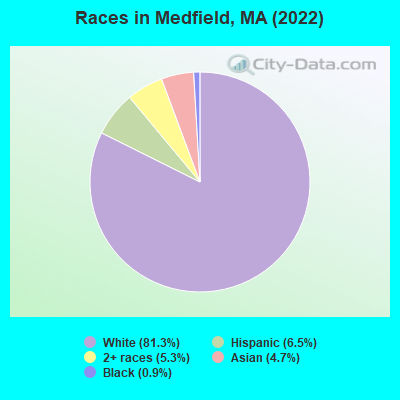
Race distribution in Medfield
2000 2022
5,198,359 81.9% White alone 428,729 6.8% Hispanic 318,329 5.0% Black alone 236,786 3.7% Asian alone 110,338 1.7% Two or more races 43,586 0.7% Other race alone 11,264 0.2% American Indian alone 1,706 0.03% Native Hawaiian and Other
4,676,627 67.0% White alone 911,038 13.0% Hispanic 501,463 7.2% Asian alone 459,740 6.6% Black alone 341,889 4.9% Two or more races 84,403 1.2% Other race alone 5,838 0.08% American Indian alone 976 0.01% Native Hawaiian and Other
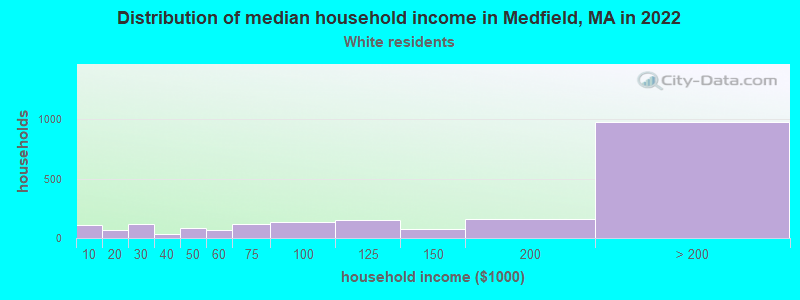
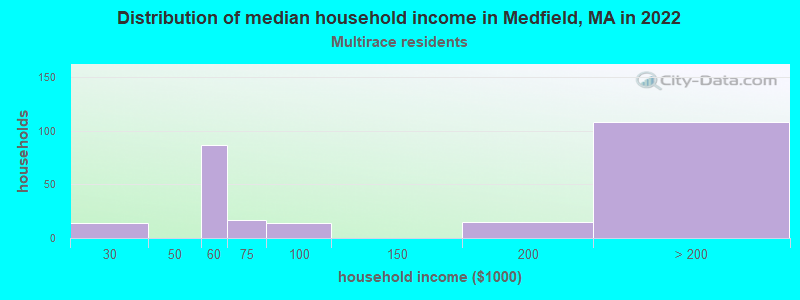
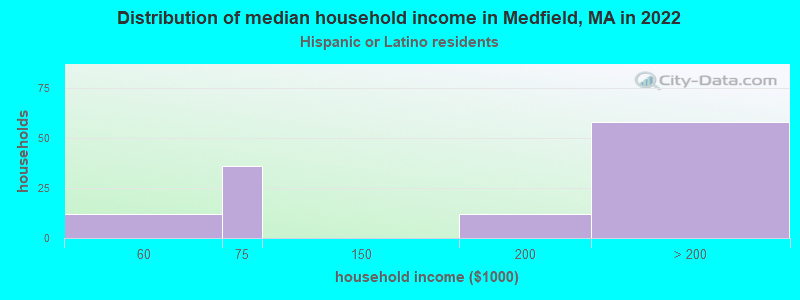
Income and house value in Medfield Median household income in 2022 $174,063 White non-Hispanic householdersover $200,000 Asian householdersover $200,000 Hispanic or Latino race householdersMedian 2022 house value $802,837 White Non-Hispanic householders$598,933 Black or African American householders over $1,000,000 Asian householders$931,674 Hispanic or Latino householders
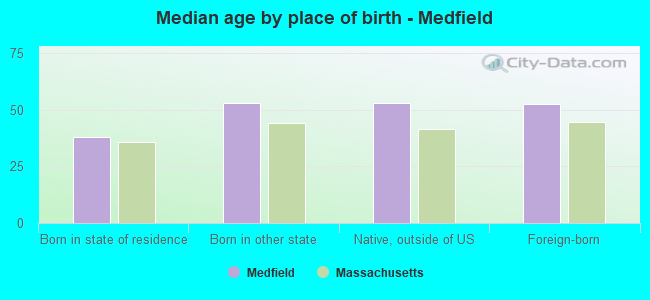
Median age by race in Medfield
48.0 Median age for White residents47.0 48.6 56.7 Median age for Black or African American residents-647,000,982.6 57.0 -655,238,094.6 Median age for American Indian / Alaska Native residents-649,474,688.9 -657,223,795.4 44.6 Median age for Asian residents36.9 58.1 -514,227,641.8 Median age for Native Hawaiian / Pacific Islander residents-513,131,312.6 -508,717,948.2 -684,684,684.0 Median age for Other race residents-723,362,658.1 -671,009,771.3 29.9 Median age for Two or more races residents45.7 24.4 47.8 Median age for White alone residents46.8 48.7 45.9 Median age for Hispanic or Latino residents47.7 50.4
Owner/renter occupied households by race in Medfield
House owners and renters - White residents 1,787 84.6% Owner occupied325 15.4% Renter occupiedHouse owners and renters - Asian residents 128 100.0% Owner occupiedHouse owners and renters - Other race residents 23 100.0% Renter occupiedHouse owners and renters - Two or more races residents 161 71.8% Owner occupied63 28.2% Renter occupiedHouse owners and renters - White alone residents 1,787 84.3% Owner occupied332 15.7% Renter occupiedHouse owners and renters - Hispanic or Latino residents 89 76.8% Owner occupied27 23.2% Renter occupied
Language usage in Medfield
English speakers - Total 88.1% of residents of Medfield speak English at home.
5.2% of residents speak Spanish at home 292 94.5% Speak English very well17 5.5% Speak English less than very well6.0% of residents speak other language at home 307 87.2% Speak English very well45 12.8% Speak English less than very well
English speakers - Born in the United States 93.7% of residents of Medfield speak English at home.
3.5% of residents speak Spanish at home 56 100.0% Speak English very well2.7% of residents speak other language at home 43 100.0% Speak English very well
English speakers - Native, born elsewhere 71.6% of residents of Medfield speak English at home.
34.6% of residents speak Spanish at home 28 100.0% Speak English very well
English speakers - Foreign-born 38.1% of residents of Medfield speak English at home.
19.2% of residents speak Spanish at home 91 85.0% Speak English very well16 15.0% Speak English less than very well40.4% of residents speak other language at home 181 80.4% Speak English very well44 19.6% Speak English less than very well
White (Caucasian) - Speak only English Native:
96.8% (4,528)Foreign-born:
58.8% (105)
White (Caucasian) - Speak another language Native:
3.2% (149)Foreign-born:
40.5% (72)
Asian - Speak only English Native:
32.7% (25)Foreign-born:
25.7% (55)
Asian - Speak another language Native:
66.7% (52)Foreign-born:
76.5% (165)
Other race - Speak another language Native:
85.0% (13)Foreign-born:
98.2% (18)
Two or more races - Speak only English Native:
75.3% (343)Foreign-born:
39.3% (75)
Two or more races - Speak another language Native:
25.1% (114)Foreign-born:
55.9% (107)
White alone - Speak only English Native:
97.0% (4,519)Foreign-born:
68.1% (106)
White alone - Speak another language Native:
2.9% (136)Foreign-born:
28.1% (44)
Hispanic or Latino - Speak only English Native:
51.7% (118)Foreign-born:
27.3% (50)
Hispanic or Latino - Speak another language Native:
48.0% (110)Foreign-born:
70.2% (130)
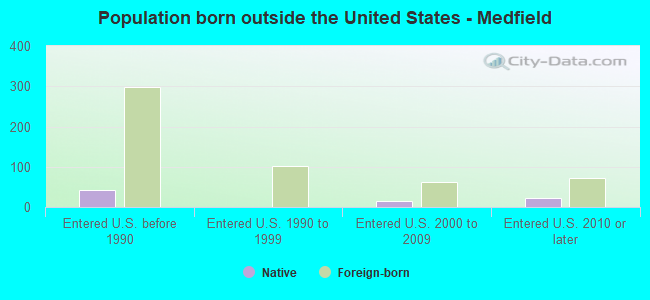
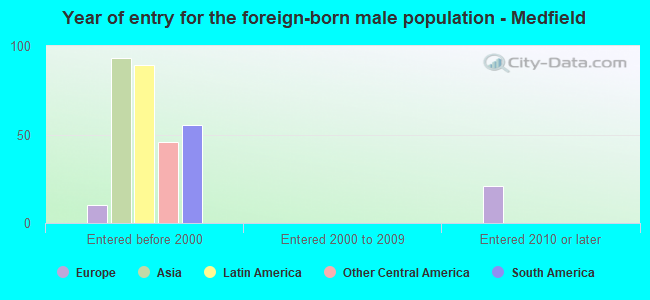
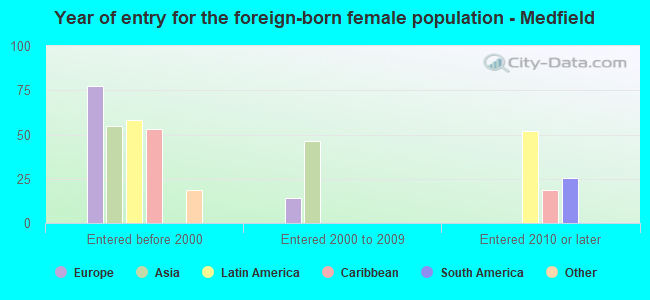
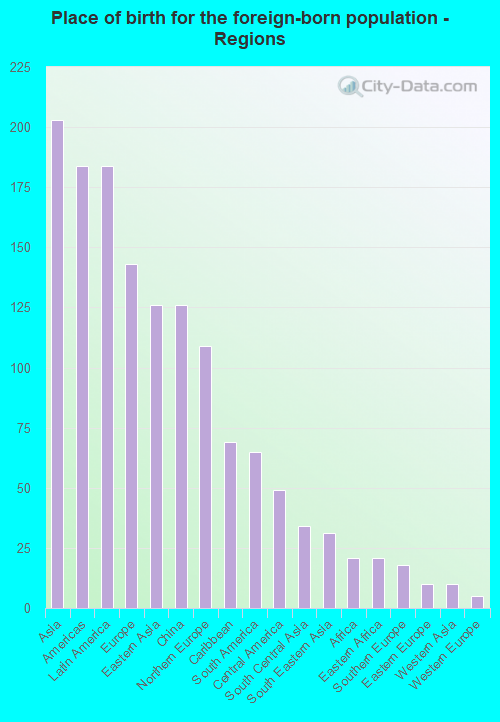
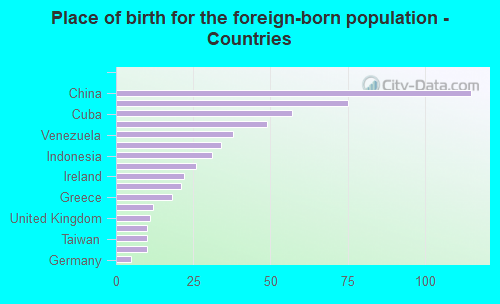
Foreign-born residents in Medfield 553 residents are foreign born (3.1% Asia , 2.8% Latin America , 2.2% Europe ).
This city:
8.7%Massachusetts:
17.6%
Marital status for residents in Medfield Marital status - White (Caucasian) population 15 years and over
Males 22.0% Never married72.6% Now married0.2% Separated2.7% Widowed2.4% DivorcedFemales 21.0% Never married55.6% Now married0.0% Separated9.5% Widowed13.9% DivorcedWomen who gave birth in the past 12 months Now married:
84.3% (55)Unmarried:
15.7% (10)
Women who did not give birth in the past 12 months Now married:
50.6% (453)Unmarried:
49.4% (442)
Marital status - Asian population 15 years and over
Males 16.9% Never married64.7% Now married0.0% Separated0.0% Widowed18.4% DivorcedFemales 6.6% Never married67.9% Now married0.0% Separated0.0% Widowed25.5% DivorcedWomen who did not give birth in the past 12 months Now married:
66.7% (15)Unmarried:
33.3% (7)
Marital status - Other race population 15 years and over
Males 100.0% Never married0.0% Now married0.0% Separated0.0% Widowed0.0% DivorcedFemales 0.0% Never married0.0% Now married100.0% Separated0.0% Widowed0.0% DivorcedMarital status - Two or more races population 15 years and over
Males 71.4% Never married13.5% Now married0.0% Separated0.0% Widowed15.0% DivorcedFemales 28.5% Never married64.9% Now married0.0% Separated0.0% Widowed6.6% DivorcedWomen who did not give birth in the past 12 months Now married:
35.8% (32)Unmarried:
64.2% (58)
Marital status - White alone, not Hispanic / Latino population 15 years and over
Males 22.6% Never married71.9% Now married0.2% Separated2.8% Widowed2.5% DivorcedFemales 21.0% Never married55.6% Now married0.0% Separated9.5% Widowed13.9% DivorcedWomen who gave birth in the past 12 months Now married:
84.3% (56)Unmarried:
15.7% (10)
Women who did not give birth in the past 12 months Now married:
50.6% (459)Unmarried:
49.4% (448)
Marital status - Hispanic or Latino population 15 years and over
Males 62.3% Never married23.5% Now married0.0% Separated0.0% Widowed14.2% DivorcedFemales 19.1% Never married72.1% Now married8.8% Separated0.0% Widowed0.0% DivorcedWomen who did not give birth in the past 12 months Now married:
48.0% (26)Unmarried:
52.0% (29)
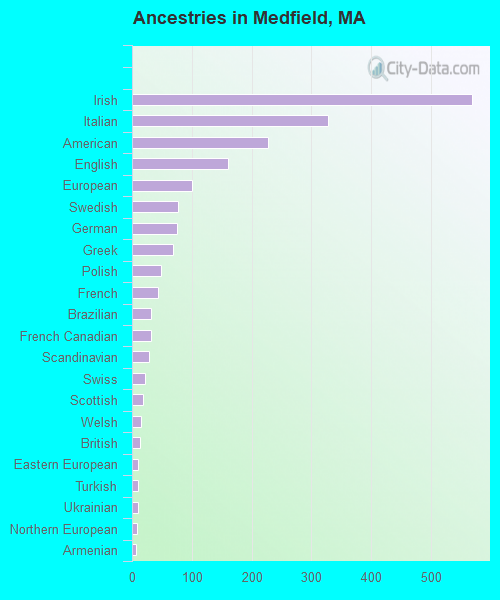
Ancestries in Medfield
569 22.7% Irish328 13.1% Italian227 9.1% American160 6.4% English101 4.0% European77 3.1% Swedish76 3.0% German69 2.8% Greek49 2.0% Polish43 1.7% French31 1.2% Brazilian31 1.2% French Canadian29 1.2% Scandinavian22 0.9% Swiss18 0.7% Scottish15 0.6% Welsh14 0.6% British10 0.4% Eastern European10 0.4% Turkish10 0.4% Ukrainian9 0.4% Northern European7 0.3% Armenian4 0.2% Latvian4 0.2% Russian4 0.2% Scotch-Irish
Children Nativity (place of birth) in Medfield
Children under 6 years - Living with two parents Both parents native 404 100.0% NativeBoth parents foreign-born 17 100.0% NativeOne native, one foreign-born parent 73 100.0% NativeChildren under 6 years - Living with one parent Native parent 37 100.0% NativeChildren 6 to 17 years - Living with two parents Both parents native 650 99.8% Native1 0.2% Foreign-bornBoth parents foreign-born 10 39.7% Native15 60.3% Foreign-bornOne native, one foreign-born parent 82 100.0% NativeChildren 6 to 17 years - Living with one parent Native parent 114 100.0% Native
Grandparents responsible for own grandchildren in Medfield
Grandparents (30 to 59 years) White / Caucasian 6 100.0% Responsible for grandchildrenBlack or African American 18 100.0% Not responsible for grandchildrenWhite alone, not Hispanic / Latino 7 100.0% Responsible for grandchildrenGrandparents (60 years and over) White / Caucasian 2 17.6% Responsible for grandchildren8 82.4% Not responsible for grandchildrenWhite alone, not Hispanic / Latino 2 17.6% Responsible for grandchildren8 82.4% Not responsible for grandchildren