Races in Meriden, Connecticut (CT) Detailed Stats
Data:
Races - White alone (%)
Races - White alone (% change since 2000)
Races - Black alone (%)
Races - Black alone (% change since 2000)
Races - American Indian alone (%)
Races - American Indian alone (% change since 2000)
Races - Asian alone (%)
Races - Asian alone (% change since 2000)
Races - Hispanic (%)
Races - Hispanic (% change since 2000)
Races - Native Hawaiian and Other Pacific Islander alone (%)
Races - Native Hawaiian and Other Pacific Islander alone (% change since 2000)
Races - Two or more races(%)
Races - Two or more races(% change since 2000)
Races - Other race alone (%)
Races - Other race alone (% change since 2000)
Racial diversity
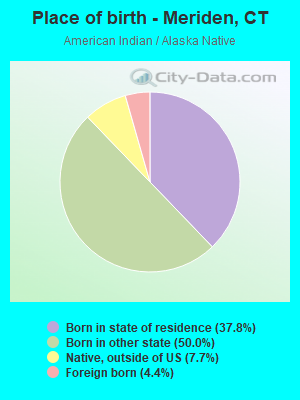
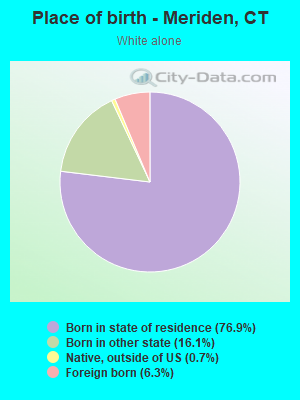
Place of birth - Born in state of residence (%)
Place of birth - Born in state of residence (%) - White
Place of birth - Born in state of residence (%) - Black or African American
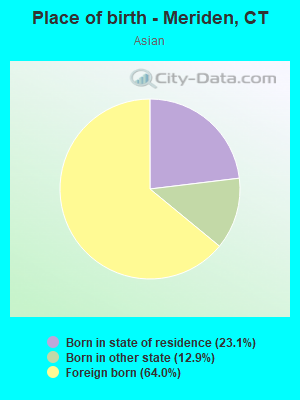
Place of birth - Born in state of residence (%) - Asian
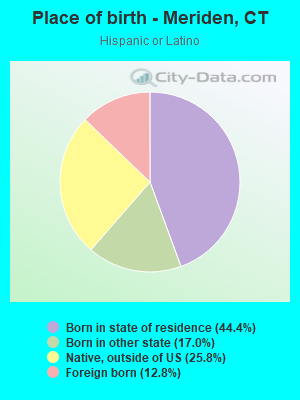
Place of birth - Born in state of residence (%) - Hispanic or Latino
Place of birth - Born in state of residence (%) - American Indian and Alaska Native
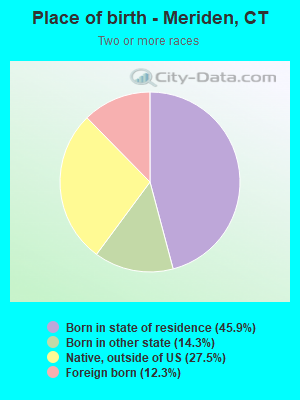
Place of birth - Born in state of residence (%) - Multirace
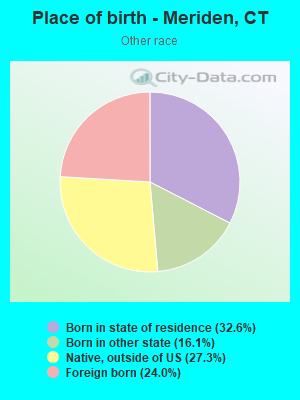
Place of birth - Born in state of residence (%) - Other Race
Place of birth - Born in other state (%)
Place of birth - Born in other state (%) - White
Place of birth - Born in other state (%) - Black or African American
Place of birth - Born in other state (%) - Asian
Place of birth - Born in other state (%) - Hispanic or Latino
Place of birth - Born in other state (%) - American Indian and Alaska Native
Place of birth - Born in other state (%) - Multirace
Place of birth - Born in other state (%) - Other Race
Place of birth - Native, outside of US (%)
Place of birth - Native, outside of US (%) - White
Place of birth - Native, outside of US (%) - Black or African American
Place of birth - Native, outside of US (%) - Asian
Place of birth - Native, outside of US (%) - Hispanic or Latino
Place of birth - Native, outside of US (%) - American Indian and Alaska Native
Place of birth - Native, outside of US (%) - Multirace
Place of birth - Native, outside of US (%) - Other Race
Place of birth - Foreign born (%)
Place of birth - Foreign born (%) - White
Place of birth - Foreign born (%) - Black or African American
Place of birth - Foreign born (%) - Asian
Place of birth - Foreign born (%) - Hispanic or Latino
Place of birth - Foreign born (%) - American Indian and Alaska Native
Place of birth - Foreign born (%) - Multirace
Place of birth - Foreign born (%) - Other Race
Residents speaking English at home (%)
Residents speaking English at home - Born in the United States (%)
Residents speaking English at home - Native, born elsewhere (%)
Residents speaking English at home - Foreign born (%)
Residents speaking Spanish at home (%)
Residents speaking Spanish at home - Born in the United States (%)
Residents speaking Spanish at home - Native, born elsewhere (%)
Residents speaking Spanish at home - Foreign born (%)
Residents speaking other language at home (%)
Residents speaking other language at home - Born in the United States (%)
Residents speaking other language at home - Native, born elsewhere (%)
Residents speaking other language at home - Foreign born (%)
Marital status - Never married (%)
Marital status - Now married (%)
Marital status - Separated (%)
Marital status - Widowed (%)
Marital status - Divorced (%)
Ancestries Reported - Arab (%)
Ancestries Reported - Czech (%)
Ancestries Reported - Danish (%)
Ancestries Reported - Dutch (%)
Ancestries Reported - English (%)
Ancestries Reported - French (%)
Ancestries Reported - French Canadian (%)
Ancestries Reported - German (%)
Ancestries Reported - Greek (%)
Ancestries Reported - Hungarian (%)
Ancestries Reported - Irish (%)
Ancestries Reported - Italian (%)
Ancestries Reported - Lithuanian (%)
Ancestries Reported - Norwegian (%)
Ancestries Reported - Polish (%)
Ancestries Reported - Portuguese (%)
Ancestries Reported - Russian (%)
Ancestries Reported - Scotch-Irish (%)
Ancestries Reported - Scottish (%)
Ancestries Reported - Slovak (%)
Ancestries Reported - Subsaharan African (%)
Ancestries Reported - Swedish (%)
Ancestries Reported - Swiss (%)
Ancestries Reported - Ukrainian (%)
Ancestries Reported - United States (%)
Ancestries Reported - Welsh (%)
Ancestries Reported - West Indian (%)
Ancestries Reported - Other (%)
Geographical mobility - Same house 1 year ago (%)
Geographical mobility - Same house 1 year ago (%) - White
Geographical mobility - Same house 1 year ago (%) - Black or African American
Geographical mobility - Same house 1 year ago (%) - Asian
Geographical mobility - Same house 1 year ago (%) - Hispanic or Latino
Geographical mobility - Same house 1 year ago (%) - American Indian and Alaska Native
Geographical mobility - Same house 1 year ago (%) - Multirace
Geographical mobility - Same house 1 year ago (%) - Other Race
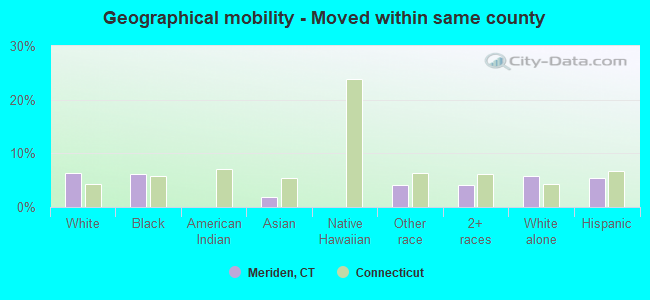
Geographical mobility - Moved within same county (%)
Geographical mobility - Moved within same county (%) - White
Geographical mobility - Moved within same county (%) - Black or African American
Geographical mobility - Moved within same county (%) - Asian
Geographical mobility - Moved within same county (%) - Hispanic or Latino
Geographical mobility - Moved within same county (%) - American Indian and Alaska Native
Geographical mobility - Moved within same county (%) - Multirace
Geographical mobility - Moved within same county (%) - Other Race
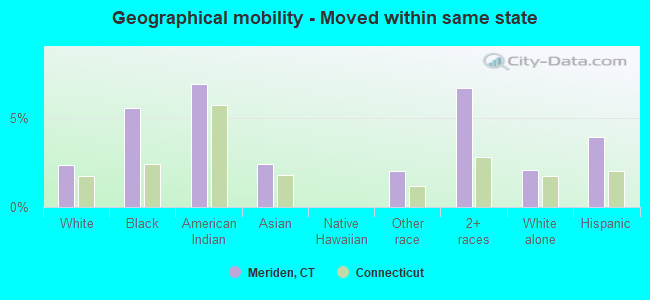
Geographical mobility - Moved from different county within same state (%)
Geographical mobility - Moved from different county within same state (%) - White
Geographical mobility - Moved from different county within same state (%) - Black or African American
Geographical mobility - Moved from different county within same state (%) - Asian
Geographical mobility - Moved from different county within same state (%) - Hispanic or Latino
Geographical mobility - Moved from different county within same state (%) - American Indian and Alaska Native
Geographical mobility - Moved from different county within same state (%) - Multirace
Geographical mobility - Moved from different county within same state (%) - Other Race
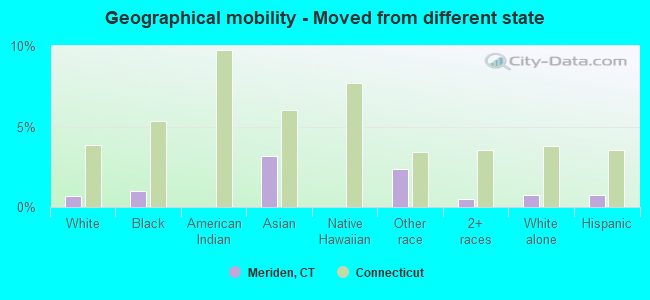
Geographical mobility - Moved from different state (%)
Geographical mobility - Moved from different state (%) - White
Geographical mobility - Moved from different state (%) - Black or African American
Geographical mobility - Moved from different state (%) - Asian
Geographical mobility - Moved from different state (%) - Hispanic or Latino
Geographical mobility - Moved from different state (%) - American Indian and Alaska Native
Geographical mobility - Moved from different state (%) - Multirace
Geographical mobility - Moved from different state (%) - Other Race
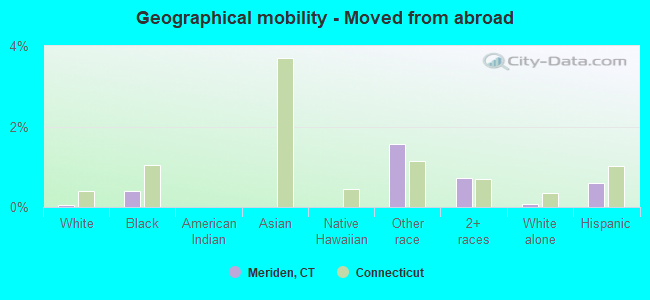
Geographical mobility - Moved from abroad (%)
Geographical mobility - Moved from abroad (%) - White
Geographical mobility - Moved from abroad (%) - Black or African American
Geographical mobility - Moved from abroad (%) - Asian
Geographical mobility - Moved from abroad (%) - Hispanic or Latino
Geographical mobility - Moved from abroad (%) - American Indian and Alaska Native
Geographical mobility - Moved from abroad (%) - Multirace
Geographical mobility - Moved from abroad (%) - Other Race
Place of birth for the foreign-born population - Ireland (%)
Place of birth for the foreign-born population - Denmark (%)
Place of birth for the foreign-born population - Norway (%)
Place of birth for the foreign-born population - Sweden (%)
Place of birth for the foreign-born population - United Kingdom (%)
Place of birth for the foreign-born population - England (%)
Place of birth for the foreign-born population - Scotland (%)
Place of birth for the foreign-born population - Other Northern Europe (%)
Place of birth for the foreign-born population - Austria (%)
Place of birth for the foreign-born population - Belgium (%)
Place of birth for the foreign-born population - France (%)
Place of birth for the foreign-born population - Germany (%)
Place of birth for the foreign-born population - Netherlands (%)
Place of birth for the foreign-born population - Switzerland (%)
Place of birth for the foreign-born population - Other Western Europe (%)
Place of birth for the foreign-born population - Greece (%)
Place of birth for the foreign-born population - Italy (%)
Place of birth for the foreign-born population - Portugal (%)
Place of birth for the foreign-born population - Spain (%)
Place of birth for the foreign-born population - Other Southern Europe (%)
Place of birth for the foreign-born population - Albania (%)
Place of birth for the foreign-born population - Belarus (%)
Place of birth for the foreign-born population - Bosnia and Herzegovina (%)
Place of birth for the foreign-born population - Bulgaria (%)
Place of birth for the foreign-born population - Croatia (%)
Place of birth for the foreign-born population - Czechoslovakia (%)
Place of birth for the foreign-born population - Hungary (%)
Place of birth for the foreign-born population - Latvia (%)
Place of birth for the foreign-born population - Lithuania (%)
Place of birth for the foreign-born population - North Macedonia (Macedonia) (%)
Place of birth for the foreign-born population - Moldova (%)
Place of birth for the foreign-born population - Poland (%)
Place of birth for the foreign-born population - Romania (%)
Place of birth for the foreign-born population - Russia (%)
Place of birth for the foreign-born population - Serbia (%)
Place of birth for the foreign-born population - Ukraine (%)
Place of birth for the foreign-born population - Other Eastern Europe (%)
Place of birth for the foreign-born population - China (%)
Place of birth for the foreign-born population - Hong Kong (%)
Place of birth for the foreign-born population - Taiwan (%)
Place of birth for the foreign-born population - Japan (%)
Place of birth for the foreign-born population - Korea (%)
Place of birth for the foreign-born population - Other Eastern Asia (%)
Place of birth for the foreign-born population - Afghanistan (%)
Place of birth for the foreign-born population - Bangladesh (%)
Place of birth for the foreign-born population - India (%)
Place of birth for the foreign-born population - Iran (%)
Place of birth for the foreign-born population - Kazakhstan (%)
Place of birth for the foreign-born population - Nepal (%)
Place of birth for the foreign-born population - Pakistan (%)
Place of birth for the foreign-born population - Sri Lanka (%)
Place of birth for the foreign-born population - Uzbekistan (%)
Place of birth for the foreign-born population - Other South Central Asia (%)
Place of birth for the foreign-born population - Burma (%)
Place of birth for the foreign-born population - Cambodia (%)
Place of birth for the foreign-born population - Indonesia (%)
Place of birth for the foreign-born population - Laos (%)
Place of birth for the foreign-born population - Malaysia (%)
Place of birth for the foreign-born population - Philippines (%)
Place of birth for the foreign-born population - Singapore (%)
Place of birth for the foreign-born population - Thailand (%)
Place of birth for the foreign-born population - Vietnam (%)
Place of birth for the foreign-born population - Other South Eastern Asia (%)
Place of birth for the foreign-born population - Armenia (%)
Place of birth for the foreign-born population - Iraq (%)
Place of birth for the foreign-born population - Israel (%)
Place of birth for the foreign-born population - Jordan (%)
Place of birth for the foreign-born population - Kuwait (%)
Place of birth for the foreign-born population - Lebanon (%)
Place of birth for the foreign-born population - Saudi Arabia (%)
Place of birth for the foreign-born population - Syria (%)
Place of birth for the foreign-born population - Turkey (%)
Place of birth for the foreign-born population - Yemen (%)
Place of birth for the foreign-born population - Other Western Asia (%)
Place of birth for the foreign-born population - Eritrea (%)
Place of birth for the foreign-born population - Ethiopia (%)
Place of birth for the foreign-born population - Kenya (%)
Place of birth for the foreign-born population - Somalia (%)
Place of birth for the foreign-born population - Uganda (%)
Place of birth for the foreign-born population - Zimbabwe (%)
Place of birth for the foreign-born population - Other Eastern Africa (%)
Place of birth for the foreign-born population - Cameroon (%)
Place of birth for the foreign-born population - Congo (%)
Place of birth for the foreign-born population - Democratic Republic of Congo (Zaire) (%)
Place of birth for the foreign-born population - Other Middle Africa (%)
Place of birth for the foreign-born population - Egypt (%)
Place of birth for the foreign-born population - Morocco (%)
Place of birth for the foreign-born population - Sudan (%)
Place of birth for the foreign-born population - Other Northern Africa (%)
Place of birth for the foreign-born population - South Africa (%)
Place of birth for the foreign-born population - Other Southern Africa (%)
Place of birth for the foreign-born population - Cabo Verde (%)
Place of birth for the foreign-born population - Ghana (%)
Place of birth for the foreign-born population - Liberia (%)
Place of birth for the foreign-born population - Nigeria (%)
Place of birth for the foreign-born population - Senegal (%)
Place of birth for the foreign-born population - Sierra Leone (%)
Place of birth for the foreign-born population - Other Western Africa (%)
Place of birth for the foreign-born population - Australia (%)
Place of birth for the foreign-born population - New Zealand (%)
Place of birth for the foreign-born population - Fiji (%)
Place of birth for the foreign-born population - Micronesia (%)
Place of birth for the foreign-born population - Bahamas (%)
Place of birth for the foreign-born population - Barbados (%)
Place of birth for the foreign-born population - Cuba (%)
Place of birth for the foreign-born population - Dominica (%)
Place of birth for the foreign-born population - Dominican Republic (%)
Place of birth for the foreign-born population - Grenada (%)
Place of birth for the foreign-born population - Haiti (%)
Place of birth for the foreign-born population - Jamaica (%)
Place of birth for the foreign-born population - St. Vincent and the Grenadines (%)
Place of birth for the foreign-born population - Trinidad and Tobago (%)
Place of birth for the foreign-born population - West Indies (%)
Place of birth for the foreign-born population - Other Caribbean (%)
Place of birth for the foreign-born population - Belize (%)
Place of birth for the foreign-born population - Costa Rica (%)
Place of birth for the foreign-born population - El Salvador (%)
Place of birth for the foreign-born population - Guatemala (%)
Place of birth for the foreign-born population - Honduras (%)
Place of birth for the foreign-born population - Mexico (%)
Place of birth for the foreign-born population - Nicaragua (%)
Place of birth for the foreign-born population - Panama (%)
Place of birth for the foreign-born population - Other Central America (%)
Place of birth for the foreign-born population - Argentina (%)
Place of birth for the foreign-born population - Bolivia (%)
Place of birth for the foreign-born population - Brazil (%)
Place of birth for the foreign-born population - Chile (%)
Place of birth for the foreign-born population - Colombia (%)
Place of birth for the foreign-born population - Ecuador (%)
Place of birth for the foreign-born population - Guyana (%)
Place of birth for the foreign-born population - Peru (%)
Place of birth for the foreign-born population - Uruguay (%)
Place of birth for the foreign-born population - Venezuela (%)
Place of birth for the foreign-born population - Other South America (%)
Place of birth for the foreign-born population - Canada (%)
Place of birth for the foreign-born population - Other Northern America (%)
Place of birth for the foreign-born population - Other (%)
Latest news about races in Meriden, CT collected exclusively by city-data.com from local newspapers, TV, and radio stations
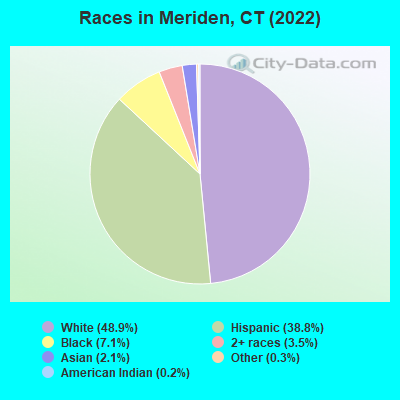
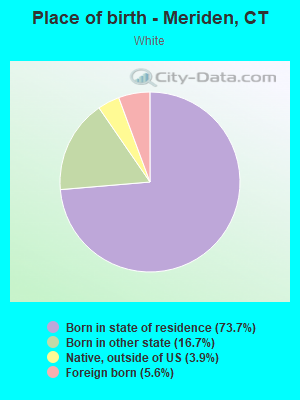
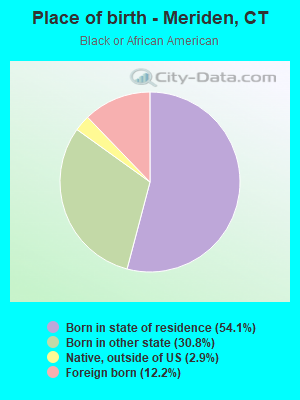
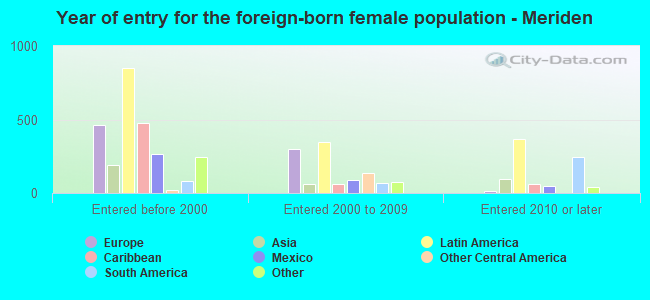
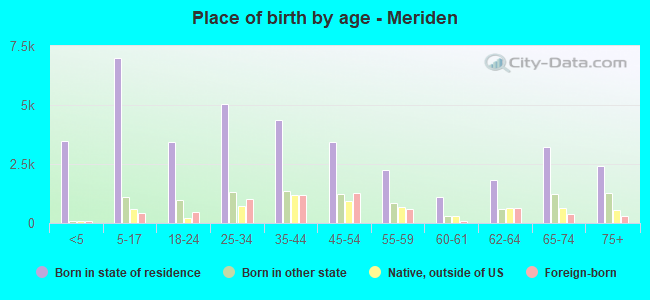
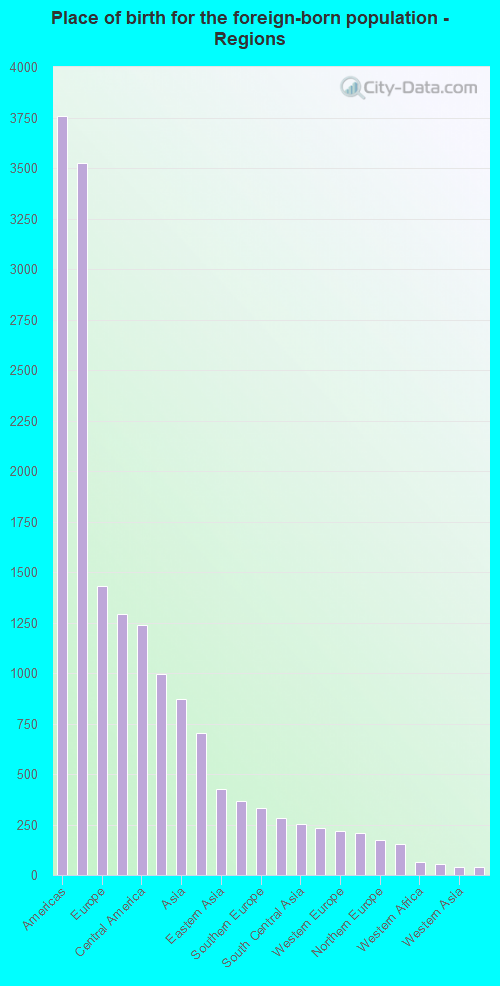
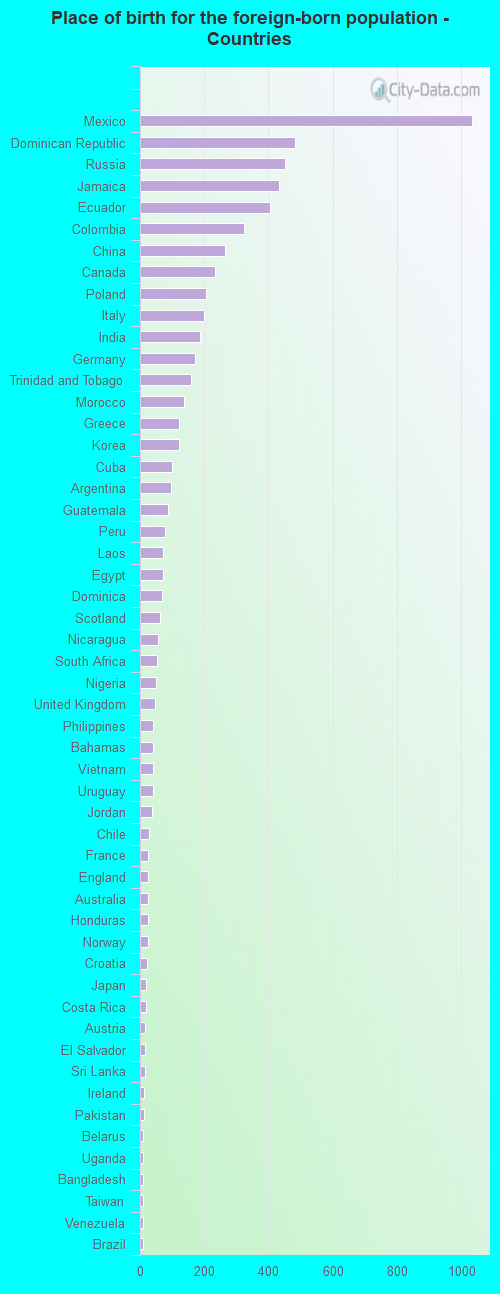
According to 2022 data, the most numerous races in Meriden, CT are White alone (29,761 residents), Hispanic (23,576 residents), and Black alone (4,308 residents). 68.8% of Meriden residents speak English at home. 10.6% of Meriden, CT residents are foreign-born (5.6% born in Latin America, 2.3% born in Europe, 1.4% born in Asia), which is 41.4% less than the foreign-born rate of 15.0% across the entire state of Connecticut.
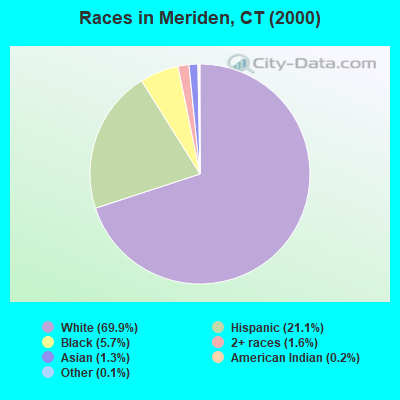
Race distribution in Meriden
2000 2022
2,638,845 77.5% White alone 320,323 9.4% Hispanic 295,571 8.7% Black alone 81,564 2.4% Asian alone 52,896 1.6% Two or more races 8,141 0.2% Other race alone 7,267 0.2% American Indian alone 958 0.03% Native Hawaiian and Other
2,246,913 62.0% White alone 658,978 18.2% Hispanic 353,973 9.8% Black alone 172,929 4.8% Asian alone 159,631 4.4% Two or more races 29,761 0.8% Other race alone 3,428 0.09% American Indian alone 592 0.02% Native Hawaiian and Other
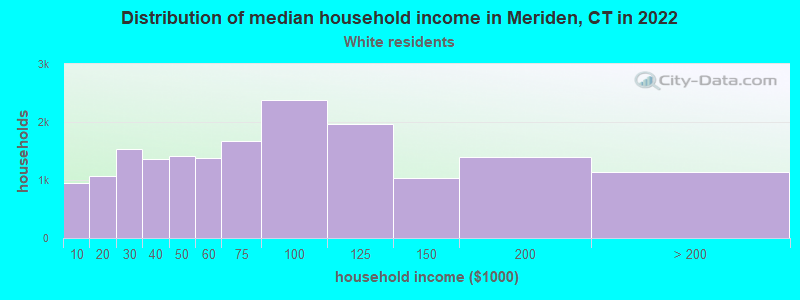
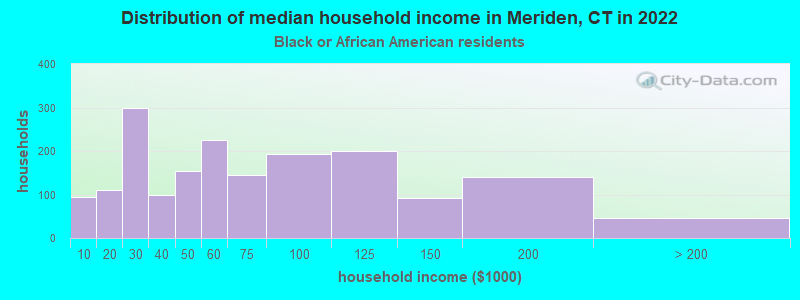
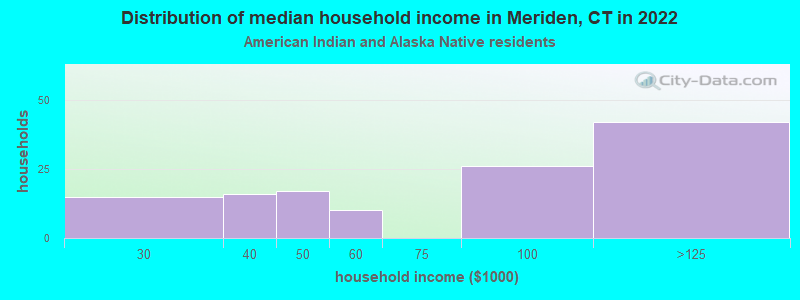
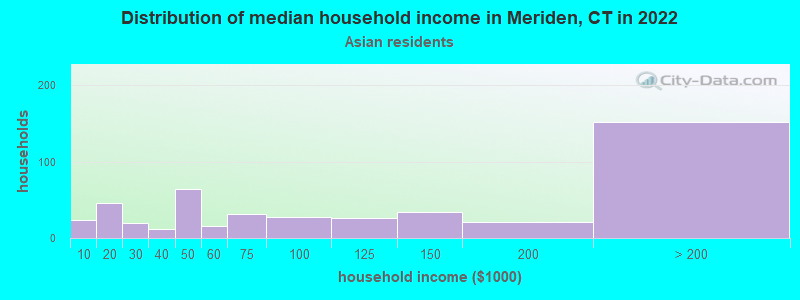
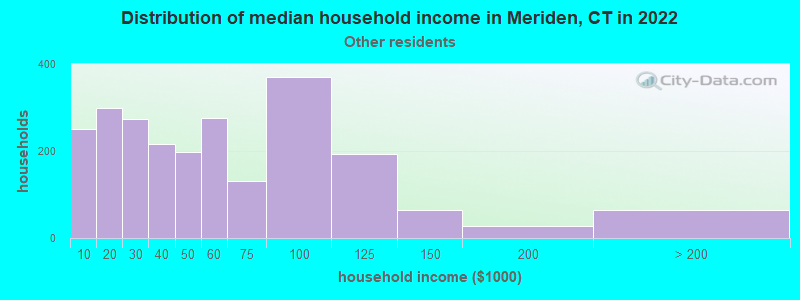
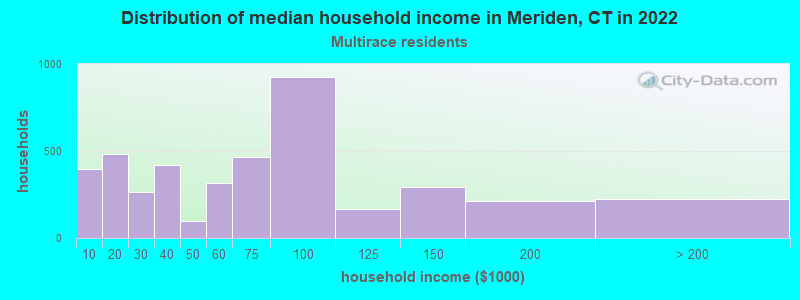
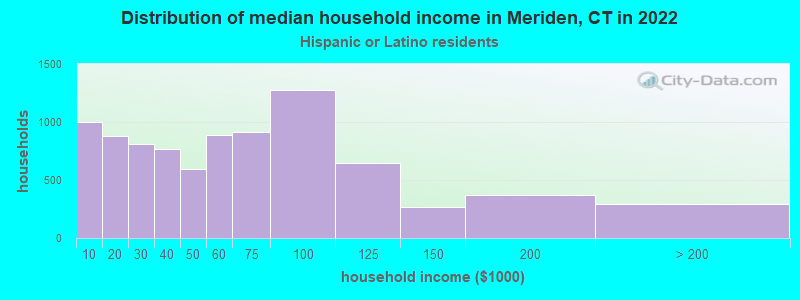
Income and house value in Meriden Median household income in 2022 $73,222 White non-Hispanic householders$59,834 Black householders$100,886 Asian householders$50,223 Some other race householders$63,292 Two or more races householders$54,583 Hispanic or Latino race householdersMedian 2022 house value $224,353 White Non-Hispanic householders$182,461 Black or African American householders$244,461 American Indian or Alaska Native householders $227,331 Asian householders$210,575 Some other race householders$214,857 Two or more races householders$205,734 Hispanic or Latino householders
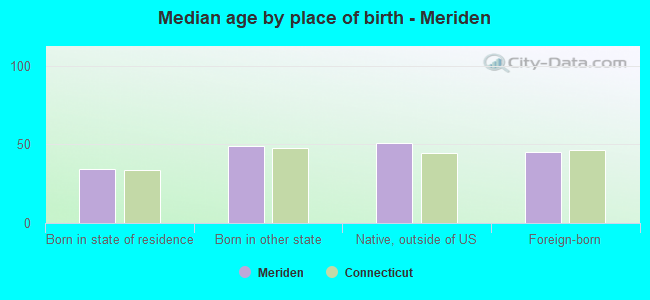
Median age by race in Meriden
46.6 Median age for White residents43.4 49.5 34.2 Median age for Black or African American residents36.4 32.9 39.4 Median age for American Indian / Alaska Native residents57.7 11.6 38.8 Median age for Asian residents39.3 35.7 53.3 Median age for Native Hawaiian / Pacific Islander residents-414,239,481.8 -691,588,784.4 34.0 Median age for Other race residents28.2 41.5 32.2 Median age for Two or more races residents30.2 32.8 52.1 Median age for White alone residents49.9 54.8 30.3 Median age for Hispanic or Latino residents26.3 34.5
Owner/renter occupied households by race in Meriden
House owners and renters - White residents 11,443 66.5% Owner occupied5,764 33.5% Renter occupiedHouse owners and renters - Black or African American residents 937 52.0% Owner occupied865 48.0% Renter occupiedHouse owners and renters - American Indian / Alaska Native residents 17 15.2% Owner occupied94 84.8% Renter occupiedHouse owners and renters - Asian residents 315 67.0% Owner occupied155 33.0% Renter occupiedHouse owners and renters - Native Hawaiian / Pacific Islander residents 12 67.7% Owner occupied6 32.3% Renter occupiedHouse owners and renters - Other race residents 864 35.5% Owner occupied1,570 64.5% Renter occupiedHouse owners and renters - Two or more races residents 2,002 47.1% Owner occupied2,246 52.9% Renter occupiedHouse owners and renters - White alone residents 10,104 71.9% Owner occupied3,948 28.1% Renter occupiedHouse owners and renters - Hispanic or Latino residents 3,680 41.9% Owner occupied5,112 58.1% Renter occupied
Language usage in Meriden
English speakers - Total 68.8% of residents of Meriden speak English at home.
27.7% of residents speak Spanish at home 9,356 59.1% Speak English very well6,476 40.9% Speak English less than very well4.1% of residents speak other language at home 1,402 60.1% Speak English very well932 39.9% Speak English less than very well
English speakers - Born in the United States 74.0% of residents of Meriden speak English at home.
26.3% of residents speak Spanish at home 2,492 92.6% Speak English very well199 7.4% Speak English less than very well2.0% of residents speak other language at home 195 93.3% Speak English very well14 6.7% Speak English less than very well
English speakers - Native, born elsewhere 10.5% of residents of Meriden speak English at home.
85.2% of residents speak Spanish at home 2,357 42.8% Speak English very well3,155 57.2% Speak English less than very well0.1% of residents speak other language at home 7 100.0% Speak English very well
English speakers - Foreign-born 35.3% of residents of Meriden speak English at home.
42.7% of residents speak Spanish at home 824 30.4% Speak English very well1,887 69.6% Speak English less than very well22.9% of residents speak other language at home 604 41.5% Speak English very well851 58.5% Speak English less than very well
White (Caucasian) - Speak only English Native:
85.9% (28,860)Foreign-born:
56.1% (1,132)
White (Caucasian) - Speak another language Native:
11.9% (4,008)Foreign-born:
48.4% (976)
Black or African American - Speak only English Native:
89.3% (3,539)Foreign-born:
97.4% (569)
Black or African American - Speak another language Native:
11.0% (435)Foreign-born:
10.4% (61)
American Indian / Alaska Native - Speak another language Native:
29.7% (61)Foreign-born:
92.6% (9)
Asian - Speak only English Native:
29.9% (126)Foreign-born:
20.5% (170)
Asian - Speak another language Native:
68.9% (291)Foreign-born:
79.2% (656)
Other race - Speak only English Native:
26.4% (1,168)Foreign-born:
11.8% (174)
Other race - Speak another language Native:
72.5% (3,212)Foreign-born:
87.2% (1,285)
Two or more races - Speak only English Native:
35.8% (3,542)Foreign-born:
4.8% (78)
Two or more races - Speak another language Native:
69.0% (6,829)Foreign-born:
98.0% (1,579)
White alone - Speak only English Native:
97.5% (26,371)Foreign-born:
58.8% (1,109)
White alone - Speak another language Native:
2.5% (676)Foreign-born:
42.0% (792)
Hispanic or Latino - Speak only English Native:
31.5% (5,731)Foreign-born:
8.9% (258)
Hispanic or Latino - Speak another language Native:
67.7% (12,321)Foreign-born:
90.4% (2,608)
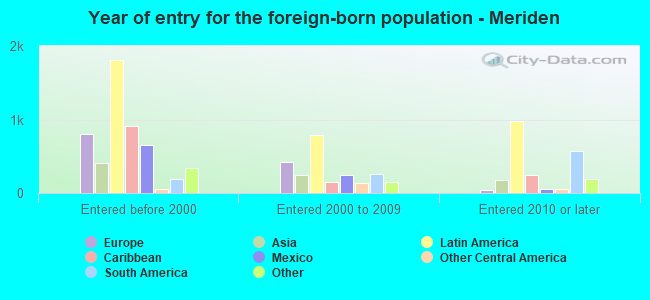
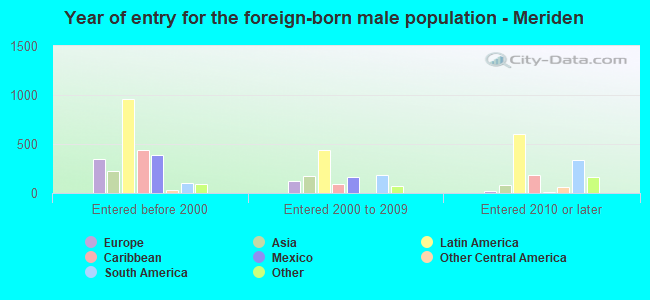
Foreign-born residents in Meriden 6,451 residents are foreign born (5.6% Latin America , 2.3% Europe , 1.4% Asia ).
This city:
10.6%Connecticut:
15.0%
Marital status for residents in Meriden Marital status - White (Caucasian) population 15 years and over
Males 37.8% Never married45.4% Now married0.7% Separated3.5% Widowed12.5% DivorcedFemales 32.0% Never married37.2% Now married1.2% Separated12.2% Widowed17.5% DivorcedWomen who gave birth in the past 12 months Now married:
58.5% (240)Unmarried:
41.5% (170)
Women who did not give birth in the past 12 months Now married:
33.3% (2,378)Unmarried:
66.7% (4,769)
Marital status - Black or African American population 15 years and over
Males 42.8% Never married39.9% Now married5.7% Separated4.0% Widowed7.6% DivorcedFemales 60.8% Never married30.9% Now married0.6% Separated2.8% Widowed4.9% DivorcedWomen who gave birth in the past 12 months Now married:
0.0% (0)Unmarried:
100.0% (5)
Women who did not give birth in the past 12 months Now married:
26.4% (400)Unmarried:
73.6% (1,117)
Marital status - American Indian / Alaska Native population 15 years and over
Males 21.4% Never married78.6% Now married0.0% Separated0.0% Widowed0.0% DivorcedFemales 24.3% Never married10.8% Now married0.0% Separated6.8% Widowed58.1% DivorcedWomen who gave birth in the past 12 months Now married:
38.1% (8)Unmarried:
61.9% (13)
Women who did not give birth in the past 12 months Now married:
0.0% (0)Unmarried:
100.0% (27)
Marital status - Asian population 15 years and over
Males 23.8% Never married72.2% Now married0.0% Separated0.2% Widowed3.8% DivorcedFemales 27.3% Never married64.7% Now married0.0% Separated6.3% Widowed1.7% DivorcedWomen who gave birth in the past 12 months Now married:
100.0% (21)Unmarried:
0.0% (0)
Women who did not give birth in the past 12 months Now married:
59.7% (220)Unmarried:
40.3% (148)
Marital status - Native Hawaiian / Pacific Islander population 15 years and over
Males 0.0% Never married66.7% Now married0.0% Separated0.0% Widowed33.3% DivorcedFemales 0.0% Never married100.0% Now married0.0% Separated0.0% Widowed0.0% DivorcedMarital status - Other race population 15 years and over
Males 56.6% Never married32.1% Now married4.1% Separated1.3% Widowed5.9% DivorcedFemales 41.1% Never married32.5% Now married4.0% Separated2.5% Widowed19.9% DivorcedWomen who gave birth in the past 12 months Now married:
30.2% (16)Unmarried:
69.8% (37)
Women who did not give birth in the past 12 months Now married:
35.6% (549)Unmarried:
64.4% (994)
Marital status - Two or more races population 15 years and over
Males 57.7% Never married34.8% Now married2.6% Separated1.0% Widowed3.8% DivorcedFemales 45.5% Never married31.4% Now married3.8% Separated6.5% Widowed12.7% DivorcedWomen who gave birth in the past 12 months Now married:
6.2% (18)Unmarried:
93.8% (277)
Women who did not give birth in the past 12 months Now married:
27.9% (763)Unmarried:
72.1% (1,972)
Marital status - White alone, not Hispanic / Latino population 15 years and over
Males 37.1% Never married46.7% Now married0.7% Separated3.9% Widowed11.6% DivorcedFemales 28.2% Never married39.0% Now married0.6% Separated14.0% Widowed18.1% DivorcedWomen who gave birth in the past 12 months Now married:
60.3% (85)Unmarried:
39.7% (56)
Women who did not give birth in the past 12 months Now married:
35.5% (1,907)Unmarried:
64.5% (3,462)
Marital status - Hispanic or Latino population 15 years and over
Males 50.7% Never married36.2% Now married3.1% Separated1.4% Widowed8.6% DivorcedFemales 45.2% Never married30.1% Now married3.8% Separated5.0% Widowed15.9% DivorcedWomen who gave birth in the past 12 months Now married:
35.5% (203)Unmarried:
64.5% (369)
Women who did not give birth in the past 12 months Now married:
28.6% (1,506)Unmarried:
71.4% (3,751)
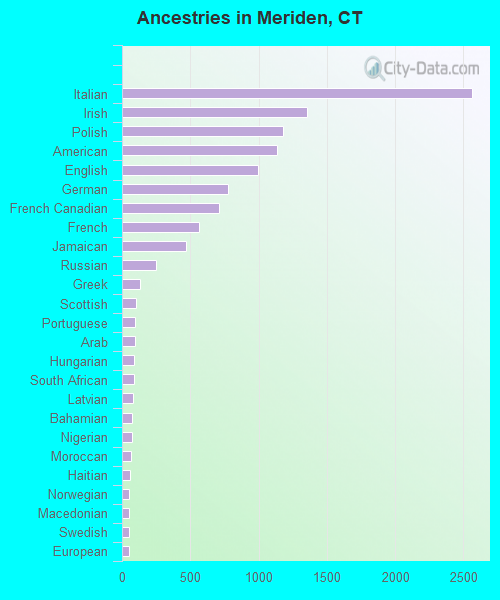
Ancestries in Meriden
2,560 8.7% Italian1,356 4.6% Irish1,179 4.0% Polish1,132 3.8% American994 3.4% English773 2.6% German714 2.4% French Canadian562 1.9% French466 1.6% Jamaican246 0.8% Russian131 0.4% Greek106 0.4% Scottish95 0.3% Portuguese92 0.3% Arab90 0.3% Hungarian87 0.3% South African78 0.3% Latvian75 0.3% Bahamian75 0.3% Nigerian66 0.2% Moroccan59 0.2% Haitian53 0.2% Norwegian53 0.2% Macedonian52 0.2% Swedish49 0.2% European42 0.1% Lithuanian36 0.1% Ukrainian33 0.1% Danish28 0.10% Eastern European26 0.09% Canadian25 0.09% Welsh23 0.08% Scotch-Irish21 0.07% Scandinavian17 0.06% Czechoslovakian16 0.05% Slavic16 0.05% British16 0.05% Armenian15 0.05% Ghanaian12 0.04% Pennsylvania German10 0.03% Lebanese7 0.02% Romanian6 0.02% Dutch5 0.02% Belgian3 0.01% African2 0.01% Iranian2 0.01% Sudanese
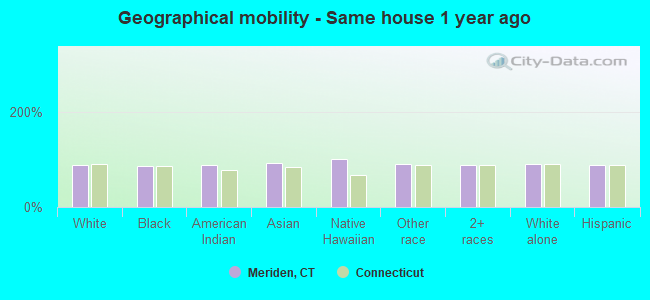
Geographical mobility in Meriden Same house 1 year ago 32,930 89.2% White (Caucasian)4,109 85.1% Black or African American213 88.1% American Indian / Alaska Native1,199 92.1% Asian25 100.0% Native Hawaiian / Pacific Islander5,510 89.9% Other race11,160 88.2% Two or more races26,812 90.3% White alone, not Hispanic / Latino20,200 88.6% Hispanic or LatinoMoved within same county 2,345 6.4% White / Caucasian295 6.1% Black or African American25 1.9% Asian254 4.1% Other race521 4.1% Two or more races1,693 5.7% White alone, not Hispanic / Latino1,237 5.4% Hispanic or LatinoMoved within same state 858 2.3% White / Caucasian267 5.5% Black or African American17 6.9% American Indian / Alaska Native31 2.4% Asian122 2.0% Other race841 6.6% Two or more races610 2.1% White alone, not Hispanic / Latino897 3.9% Hispanic or LatinoMoved from different state 250 0.7% White / Caucasian48 1.0% Black or African American41 3.1% Asian146 2.4% Other race65 0.5% Two or more races219 0.7% White alone, not Hispanic / Latino172 0.8% Hispanic or LatinoMoved from abroad 20 0.1% White19 0.4% Black or African American95 1.6% Other race91 0.7% Two or more races21 0.1% White alone, not Hispanic / Latino134 0.6% Hispanic or Latino
Children Nativity (place of birth) in Meriden
Children under 6 years - Living with two parents Both parents native 1,799 100.0% NativeBoth parents foreign-born 117 54.3% Native99 45.7% Foreign-bornOne native, one foreign-born parent 114 100.0% NativeChildren under 6 years - Living with one parent Native parent 2,315 100.0% NativeForeign-born parent 247 100.0% NativeChildren 6 to 17 years - Living with two parents Both parents native 2,199 90.5% Native231 9.5% Foreign-bornBoth parents foreign-born 817 97.3% Native22 2.7% Foreign-bornOne native, one foreign-born parent 541 97.6% Native13 2.4% Foreign-bornChildren 6 to 17 years - Living with one parent Native parent 3,317 100.0% NativeForeign-born parent 514 57.3% Native383 42.7% Foreign-born
Grandparents responsible for own grandchildren in Meriden
Grandparents (30 to 59 years) White / Caucasian 120 33.9% Responsible for grandchildren234 66.1% Not responsible for grandchildrenBlack or African American 4 11.7% Responsible for grandchildren32 88.3% Not responsible for grandchildrenAmerican Indian / Alaska Native 20 100.0% Responsible for grandchildrenOther race 39 100.0% Not responsible for grandchildrenTwo or more races 38 31.2% Responsible for grandchildren84 68.8% Not responsible for grandchildrenWhite alone, not Hispanic / Latino 30 18.7% Responsible for grandchildren130 81.3% Not responsible for grandchildrenHispanic or Latino 158 40.9% Responsible for grandchildren228 59.1% Not responsible for grandchildrenGrandparents (60 years and over) White / Caucasian 103 36.8% Responsible for grandchildren177 63.2% Not responsible for grandchildrenBlack or African American 1 3.3% Responsible for grandchildren43 96.7% Not responsible for grandchildrenOther race 16 26.4% Responsible for grandchildren46 73.6% Not responsible for grandchildrenTwo or more races 13 100.0% Responsible for grandchildrenWhite alone, not Hispanic / Latino 110 37.7% Responsible for grandchildren181 62.3% Not responsible for grandchildrenHispanic or Latino 16 26.9% Responsible for grandchildren43 73.1% Not responsible for grandchildren