Races in Merritt Island, Florida (FL) Detailed Stats
Data:
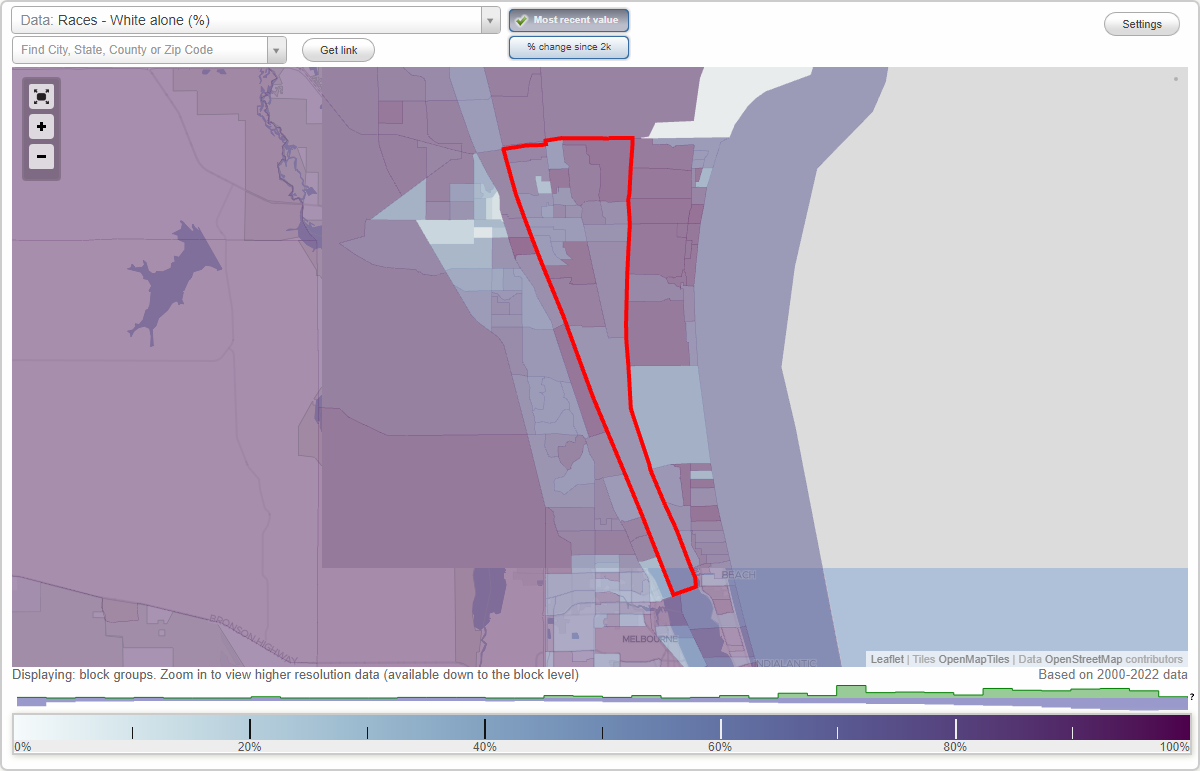
Races - White alone (%)
Races - White alone (% change since 2000)
Races - Black alone (%)
Races - Black alone (% change since 2000)
Races - American Indian alone (%)
Races - American Indian alone (% change since 2000)
Races - Asian alone (%)
Races - Asian alone (% change since 2000)
Races - Hispanic (%)
Races - Hispanic (% change since 2000)
Races - Native Hawaiian and Other Pacific Islander alone (%)
Races - Native Hawaiian and Other Pacific Islander alone (% change since 2000)
Races - Two or more races(%)
Races - Two or more races(% change since 2000)
Races - Other race alone (%)
Races - Other race alone (% change since 2000)
Racial diversity
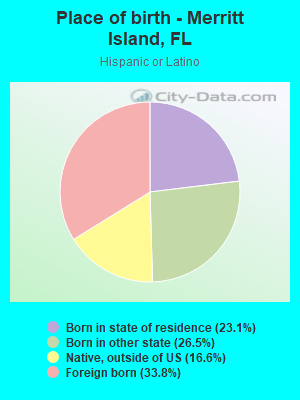
Place of birth - Born in state of residence (%)
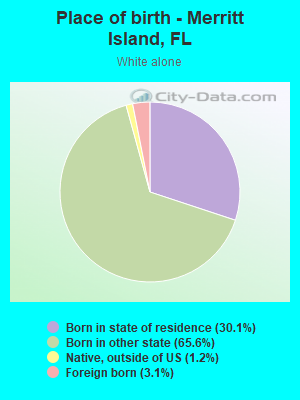
Place of birth - Born in state of residence (%) - White
Place of birth - Born in state of residence (%) - Black or African American
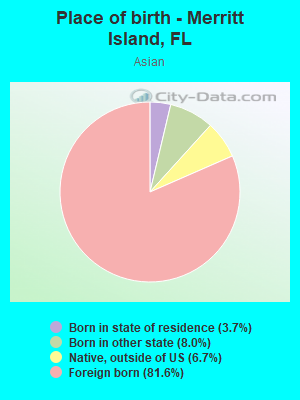
Place of birth - Born in state of residence (%) - Asian
Place of birth - Born in state of residence (%) - Hispanic or Latino
Place of birth - Born in state of residence (%) - American Indian and Alaska Native
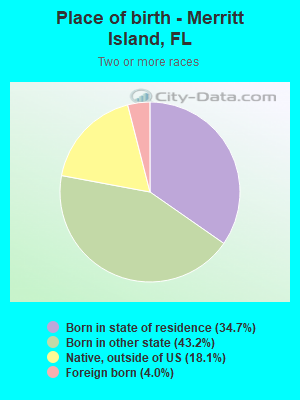
Place of birth - Born in state of residence (%) - Multirace
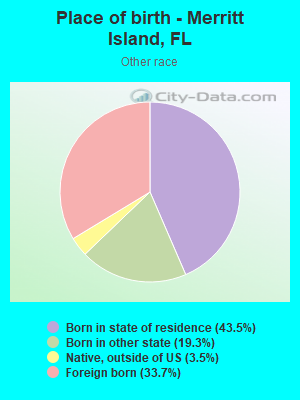
Place of birth - Born in state of residence (%) - Other Race
Place of birth - Born in other state (%)
Place of birth - Born in other state (%) - White
Place of birth - Born in other state (%) - Black or African American
Place of birth - Born in other state (%) - Asian
Place of birth - Born in other state (%) - Hispanic or Latino
Place of birth - Born in other state (%) - American Indian and Alaska Native
Place of birth - Born in other state (%) - Multirace
Place of birth - Born in other state (%) - Other Race
Place of birth - Native, outside of US (%)
Place of birth - Native, outside of US (%) - White
Place of birth - Native, outside of US (%) - Black or African American
Place of birth - Native, outside of US (%) - Asian
Place of birth - Native, outside of US (%) - Hispanic or Latino
Place of birth - Native, outside of US (%) - American Indian and Alaska Native
Place of birth - Native, outside of US (%) - Multirace
Place of birth - Native, outside of US (%) - Other Race
Place of birth - Foreign born (%)
Place of birth - Foreign born (%) - White
Place of birth - Foreign born (%) - Black or African American
Place of birth - Foreign born (%) - Asian
Place of birth - Foreign born (%) - Hispanic or Latino
Place of birth - Foreign born (%) - American Indian and Alaska Native
Place of birth - Foreign born (%) - Multirace
Place of birth - Foreign born (%) - Other Race
Residents speaking English at home (%)
Residents speaking English at home - Born in the United States (%)
Residents speaking English at home - Native, born elsewhere (%)
Residents speaking English at home - Foreign born (%)
Residents speaking Spanish at home (%)
Residents speaking Spanish at home - Born in the United States (%)
Residents speaking Spanish at home - Native, born elsewhere (%)
Residents speaking Spanish at home - Foreign born (%)
Residents speaking other language at home (%)
Residents speaking other language at home - Born in the United States (%)
Residents speaking other language at home - Native, born elsewhere (%)
Residents speaking other language at home - Foreign born (%)
Marital status - Never married (%)
Marital status - Now married (%)
Marital status - Separated (%)
Marital status - Widowed (%)
Marital status - Divorced (%)
Ancestries Reported - Arab (%)
Ancestries Reported - Czech (%)
Ancestries Reported - Danish (%)
Ancestries Reported - Dutch (%)
Ancestries Reported - English (%)
Ancestries Reported - French (%)
Ancestries Reported - French Canadian (%)
Ancestries Reported - German (%)
Ancestries Reported - Greek (%)
Ancestries Reported - Hungarian (%)
Ancestries Reported - Irish (%)
Ancestries Reported - Italian (%)
Ancestries Reported - Lithuanian (%)
Ancestries Reported - Norwegian (%)
Ancestries Reported - Polish (%)
Ancestries Reported - Portuguese (%)
Ancestries Reported - Russian (%)
Ancestries Reported - Scotch-Irish (%)
Ancestries Reported - Scottish (%)
Ancestries Reported - Slovak (%)
Ancestries Reported - Subsaharan African (%)
Ancestries Reported - Swedish (%)
Ancestries Reported - Swiss (%)
Ancestries Reported - Ukrainian (%)
Ancestries Reported - United States (%)
Ancestries Reported - Welsh (%)
Ancestries Reported - West Indian (%)
Ancestries Reported - Other (%)
Geographical mobility - Same house 1 year ago (%)
Geographical mobility - Same house 1 year ago (%) - White
Geographical mobility - Same house 1 year ago (%) - Black or African American
Geographical mobility - Same house 1 year ago (%) - Asian
Geographical mobility - Same house 1 year ago (%) - Hispanic or Latino
Geographical mobility - Same house 1 year ago (%) - American Indian and Alaska Native
Geographical mobility - Same house 1 year ago (%) - Multirace
Geographical mobility - Same house 1 year ago (%) - Other Race
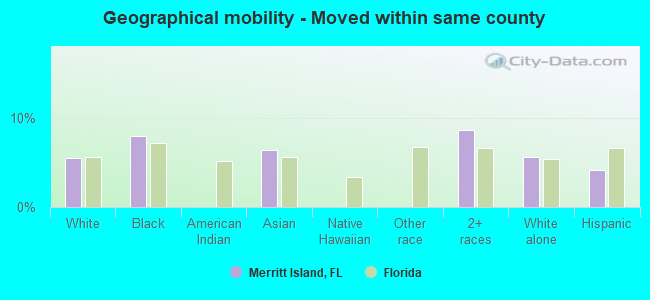
Geographical mobility - Moved within same county (%)
Geographical mobility - Moved within same county (%) - White
Geographical mobility - Moved within same county (%) - Black or African American
Geographical mobility - Moved within same county (%) - Asian
Geographical mobility - Moved within same county (%) - Hispanic or Latino
Geographical mobility - Moved within same county (%) - American Indian and Alaska Native
Geographical mobility - Moved within same county (%) - Multirace
Geographical mobility - Moved within same county (%) - Other Race
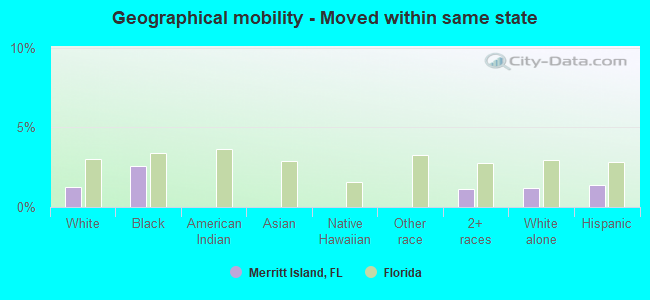
Geographical mobility - Moved from different county within same state (%)
Geographical mobility - Moved from different county within same state (%) - White
Geographical mobility - Moved from different county within same state (%) - Black or African American
Geographical mobility - Moved from different county within same state (%) - Asian
Geographical mobility - Moved from different county within same state (%) - Hispanic or Latino
Geographical mobility - Moved from different county within same state (%) - American Indian and Alaska Native
Geographical mobility - Moved from different county within same state (%) - Multirace
Geographical mobility - Moved from different county within same state (%) - Other Race
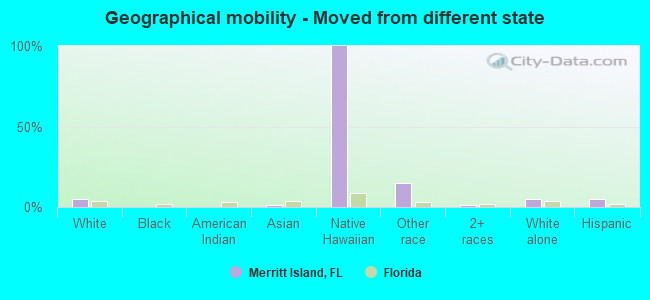
Geographical mobility - Moved from different state (%)
Geographical mobility - Moved from different state (%) - White
Geographical mobility - Moved from different state (%) - Black or African American
Geographical mobility - Moved from different state (%) - Asian
Geographical mobility - Moved from different state (%) - Hispanic or Latino
Geographical mobility - Moved from different state (%) - American Indian and Alaska Native
Geographical mobility - Moved from different state (%) - Multirace
Geographical mobility - Moved from different state (%) - Other Race
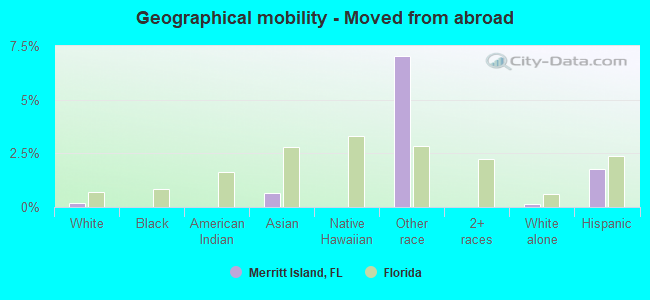
Geographical mobility - Moved from abroad (%)
Geographical mobility - Moved from abroad (%) - White
Geographical mobility - Moved from abroad (%) - Black or African American
Geographical mobility - Moved from abroad (%) - Asian
Geographical mobility - Moved from abroad (%) - Hispanic or Latino
Geographical mobility - Moved from abroad (%) - American Indian and Alaska Native
Geographical mobility - Moved from abroad (%) - Multirace
Geographical mobility - Moved from abroad (%) - Other Race
Place of birth for the foreign-born population - Ireland (%)
Place of birth for the foreign-born population - Denmark (%)
Place of birth for the foreign-born population - Norway (%)
Place of birth for the foreign-born population - Sweden (%)
Place of birth for the foreign-born population - United Kingdom (%)
Place of birth for the foreign-born population - England (%)
Place of birth for the foreign-born population - Scotland (%)
Place of birth for the foreign-born population - Other Northern Europe (%)
Place of birth for the foreign-born population - Austria (%)
Place of birth for the foreign-born population - Belgium (%)
Place of birth for the foreign-born population - France (%)
Place of birth for the foreign-born population - Germany (%)
Place of birth for the foreign-born population - Netherlands (%)
Place of birth for the foreign-born population - Switzerland (%)
Place of birth for the foreign-born population - Other Western Europe (%)
Place of birth for the foreign-born population - Greece (%)
Place of birth for the foreign-born population - Italy (%)
Place of birth for the foreign-born population - Portugal (%)
Place of birth for the foreign-born population - Spain (%)
Place of birth for the foreign-born population - Other Southern Europe (%)
Place of birth for the foreign-born population - Albania (%)
Place of birth for the foreign-born population - Belarus (%)
Place of birth for the foreign-born population - Bosnia and Herzegovina (%)
Place of birth for the foreign-born population - Bulgaria (%)
Place of birth for the foreign-born population - Croatia (%)
Place of birth for the foreign-born population - Czechoslovakia (%)
Place of birth for the foreign-born population - Hungary (%)
Place of birth for the foreign-born population - Latvia (%)
Place of birth for the foreign-born population - Lithuania (%)
Place of birth for the foreign-born population - North Macedonia (Macedonia) (%)
Place of birth for the foreign-born population - Moldova (%)
Place of birth for the foreign-born population - Poland (%)
Place of birth for the foreign-born population - Romania (%)
Place of birth for the foreign-born population - Russia (%)
Place of birth for the foreign-born population - Serbia (%)
Place of birth for the foreign-born population - Ukraine (%)
Place of birth for the foreign-born population - Other Eastern Europe (%)
Place of birth for the foreign-born population - China (%)
Place of birth for the foreign-born population - Hong Kong (%)
Place of birth for the foreign-born population - Taiwan (%)
Place of birth for the foreign-born population - Japan (%)
Place of birth for the foreign-born population - Korea (%)
Place of birth for the foreign-born population - Other Eastern Asia (%)
Place of birth for the foreign-born population - Afghanistan (%)
Place of birth for the foreign-born population - Bangladesh (%)
Place of birth for the foreign-born population - India (%)
Place of birth for the foreign-born population - Iran (%)
Place of birth for the foreign-born population - Kazakhstan (%)
Place of birth for the foreign-born population - Nepal (%)
Place of birth for the foreign-born population - Pakistan (%)
Place of birth for the foreign-born population - Sri Lanka (%)
Place of birth for the foreign-born population - Uzbekistan (%)
Place of birth for the foreign-born population - Other South Central Asia (%)
Place of birth for the foreign-born population - Burma (%)
Place of birth for the foreign-born population - Cambodia (%)
Place of birth for the foreign-born population - Indonesia (%)
Place of birth for the foreign-born population - Laos (%)
Place of birth for the foreign-born population - Malaysia (%)
Place of birth for the foreign-born population - Philippines (%)
Place of birth for the foreign-born population - Singapore (%)
Place of birth for the foreign-born population - Thailand (%)
Place of birth for the foreign-born population - Vietnam (%)
Place of birth for the foreign-born population - Other South Eastern Asia (%)
Place of birth for the foreign-born population - Armenia (%)
Place of birth for the foreign-born population - Iraq (%)
Place of birth for the foreign-born population - Israel (%)
Place of birth for the foreign-born population - Jordan (%)
Place of birth for the foreign-born population - Kuwait (%)
Place of birth for the foreign-born population - Lebanon (%)
Place of birth for the foreign-born population - Saudi Arabia (%)
Place of birth for the foreign-born population - Syria (%)
Place of birth for the foreign-born population - Turkey (%)
Place of birth for the foreign-born population - Yemen (%)
Place of birth for the foreign-born population - Other Western Asia (%)
Place of birth for the foreign-born population - Eritrea (%)
Place of birth for the foreign-born population - Ethiopia (%)
Place of birth for the foreign-born population - Kenya (%)
Place of birth for the foreign-born population - Somalia (%)
Place of birth for the foreign-born population - Uganda (%)
Place of birth for the foreign-born population - Zimbabwe (%)
Place of birth for the foreign-born population - Other Eastern Africa (%)
Place of birth for the foreign-born population - Cameroon (%)
Place of birth for the foreign-born population - Congo (%)
Place of birth for the foreign-born population - Democratic Republic of Congo (Zaire) (%)
Place of birth for the foreign-born population - Other Middle Africa (%)
Place of birth for the foreign-born population - Egypt (%)
Place of birth for the foreign-born population - Morocco (%)
Place of birth for the foreign-born population - Sudan (%)
Place of birth for the foreign-born population - Other Northern Africa (%)
Place of birth for the foreign-born population - South Africa (%)
Place of birth for the foreign-born population - Other Southern Africa (%)
Place of birth for the foreign-born population - Cabo Verde (%)
Place of birth for the foreign-born population - Ghana (%)
Place of birth for the foreign-born population - Liberia (%)
Place of birth for the foreign-born population - Nigeria (%)
Place of birth for the foreign-born population - Senegal (%)
Place of birth for the foreign-born population - Sierra Leone (%)
Place of birth for the foreign-born population - Other Western Africa (%)
Place of birth for the foreign-born population - Australia (%)
Place of birth for the foreign-born population - New Zealand (%)
Place of birth for the foreign-born population - Fiji (%)
Place of birth for the foreign-born population - Micronesia (%)
Place of birth for the foreign-born population - Bahamas (%)
Place of birth for the foreign-born population - Barbados (%)
Place of birth for the foreign-born population - Cuba (%)
Place of birth for the foreign-born population - Dominica (%)
Place of birth for the foreign-born population - Dominican Republic (%)
Place of birth for the foreign-born population - Grenada (%)
Place of birth for the foreign-born population - Haiti (%)
Place of birth for the foreign-born population - Jamaica (%)
Place of birth for the foreign-born population - St. Vincent and the Grenadines (%)
Place of birth for the foreign-born population - Trinidad and Tobago (%)
Place of birth for the foreign-born population - West Indies (%)
Place of birth for the foreign-born population - Other Caribbean (%)
Place of birth for the foreign-born population - Belize (%)
Place of birth for the foreign-born population - Costa Rica (%)
Place of birth for the foreign-born population - El Salvador (%)
Place of birth for the foreign-born population - Guatemala (%)
Place of birth for the foreign-born population - Honduras (%)
Place of birth for the foreign-born population - Mexico (%)
Place of birth for the foreign-born population - Nicaragua (%)
Place of birth for the foreign-born population - Panama (%)
Place of birth for the foreign-born population - Other Central America (%)
Place of birth for the foreign-born population - Argentina (%)
Place of birth for the foreign-born population - Bolivia (%)
Place of birth for the foreign-born population - Brazil (%)
Place of birth for the foreign-born population - Chile (%)
Place of birth for the foreign-born population - Colombia (%)
Place of birth for the foreign-born population - Ecuador (%)
Place of birth for the foreign-born population - Guyana (%)
Place of birth for the foreign-born population - Peru (%)
Place of birth for the foreign-born population - Uruguay (%)
Place of birth for the foreign-born population - Venezuela (%)
Place of birth for the foreign-born population - Other South America (%)
Place of birth for the foreign-born population - Canada (%)
Place of birth for the foreign-born population - Other Northern America (%)
Place of birth for the foreign-born population - Other (%)
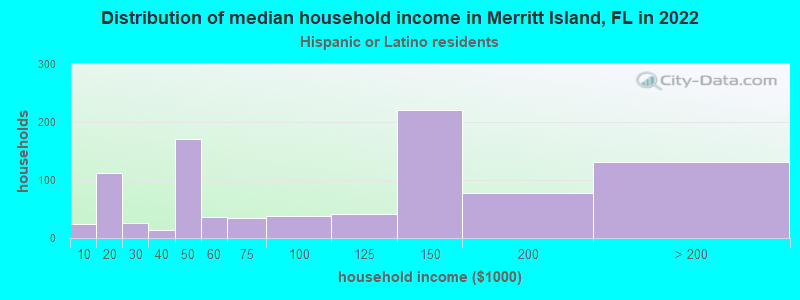
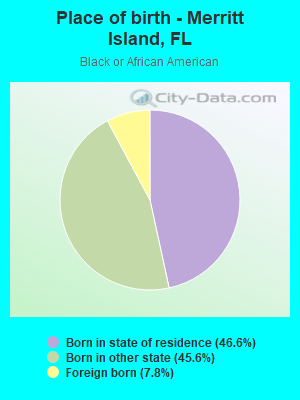
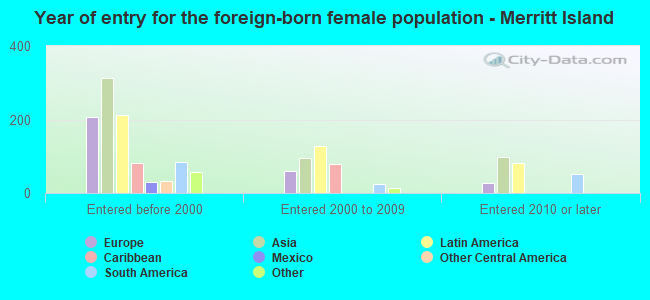
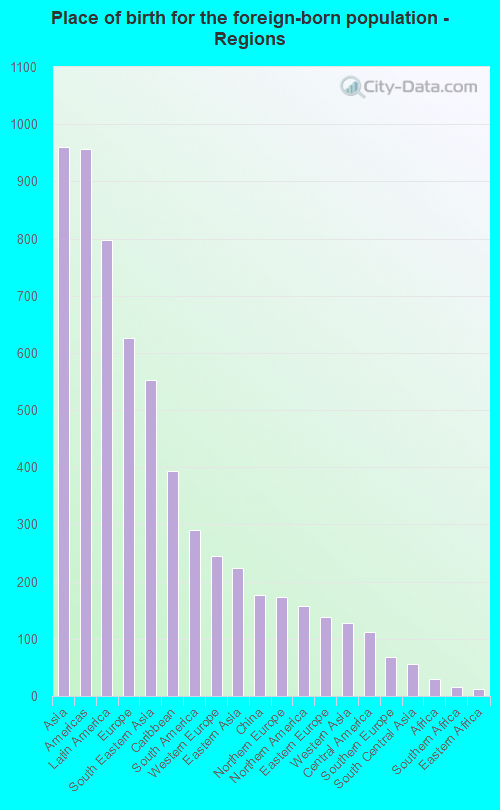
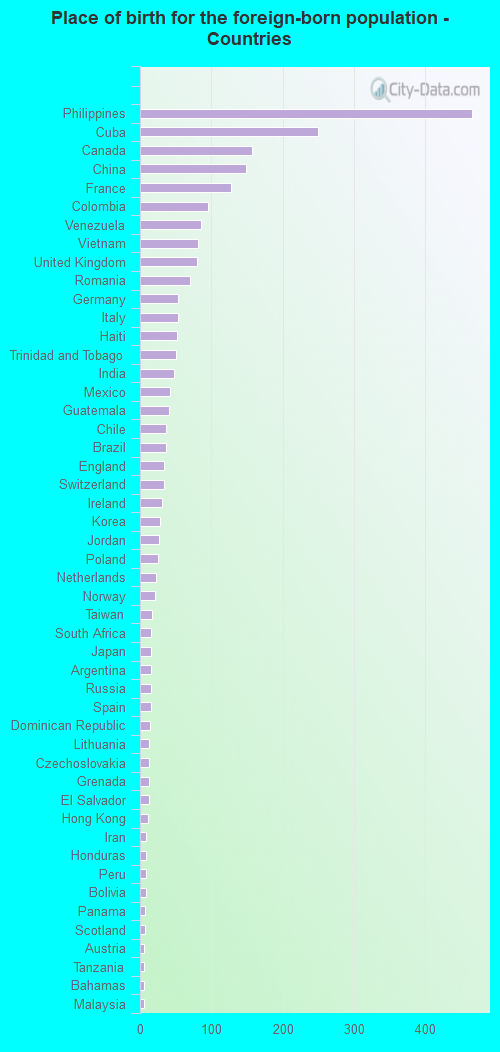
According to 2022 data, the most numerous races in Merritt Island, FL are White alone (28,775 residents), Hispanic (2,653 residents), and Black alone (855 residents). 89.8% of Merritt Island residents speak English at home. 7.3% of Merritt Island, FL residents are foreign-born (2.7% born in Asia, 2.2% born in Latin America, 1.7% born in Europe), which is 189.2% less than the foreign-born rate of 21.0% across the entire state of Florida.
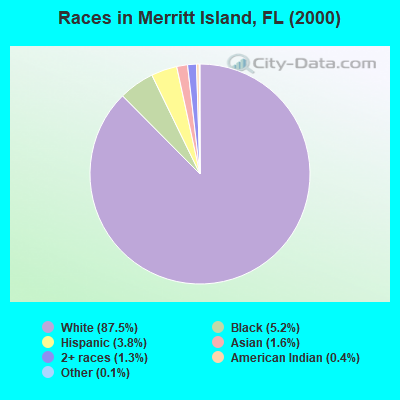
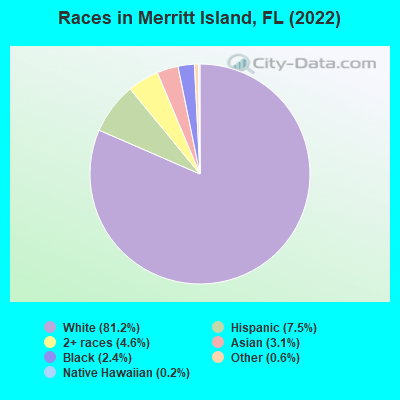
Race distribution in Merritt Island
2000 2022
10,458,509 65.4% White alone 2,682,715 16.8% Hispanic 2,264,268 14.2% Black alone 261,693 1.6% Asian alone 236,954 1.5% Two or more races 42,358 0.3% American Indian alone 28,994 0.2% Other race alone 6,887 0.04% Native Hawaiian and Other
11,309,403 50.8% White alone 6,025,039 27.1% Hispanic 3,241,015 14.6% Black alone 861,630 3.9% Two or more races 623,692 2.8% Asian alone 152,054 0.7% Other race alone 22,504 0.1% American Indian alone 9,486 0.04% Native Hawaiian and Other
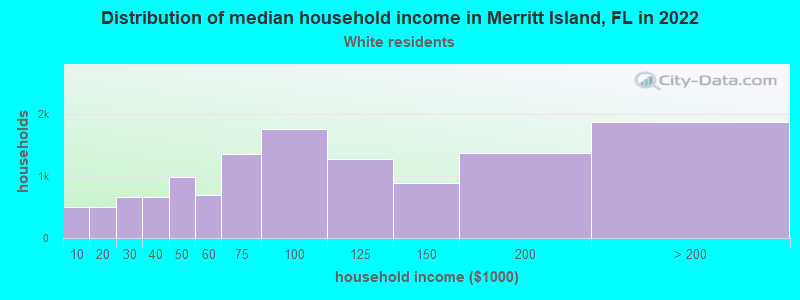
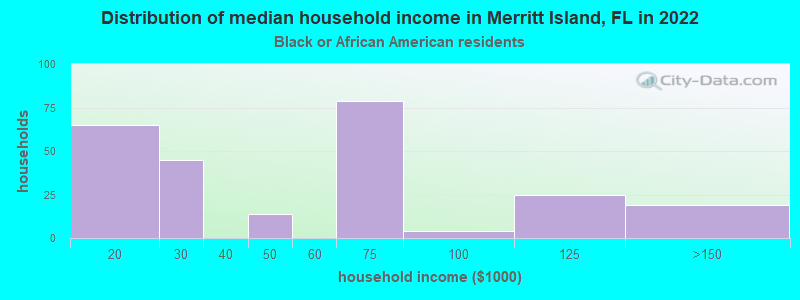
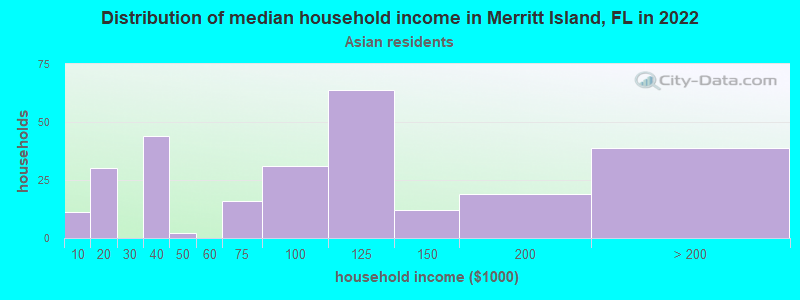
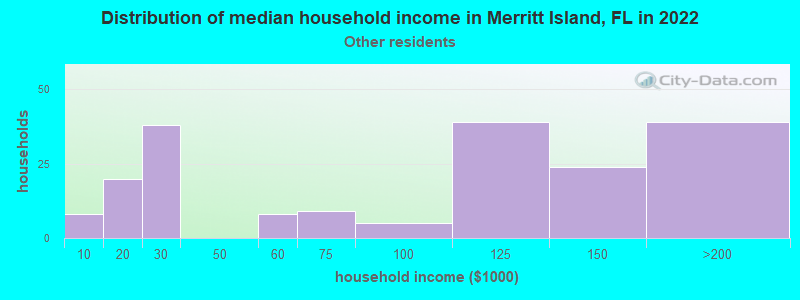
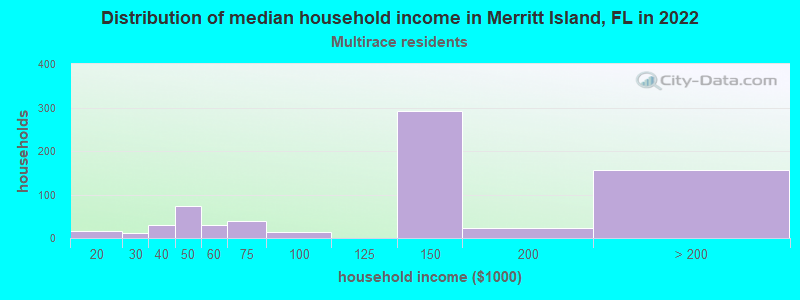
Income and house value in Merritt Island Median household income in 2022 $86,887 White non-Hispanic householders$49,126 Black householders$120,658 Asian householders$88,437 Some other race householders$172,806 Two or more races householders$76,468 Hispanic or Latino race householdersMedian 2022 house value $450,196 White Non-Hispanic householders$246,348 Black or African American householders$308,405 American Indian or Alaska Native householders $502,099 Asian householders$572,054 Some other race householders$444,179 Two or more races householders$517,143 Hispanic or Latino householders
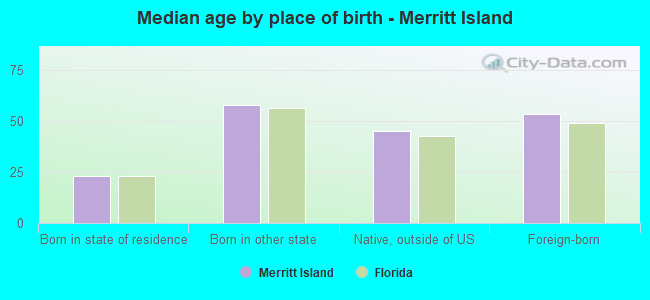
Median age by race in Merritt Island
51.8 Median age for White residents50.0 53.8 43.7 Median age for Black or African American residents43.6 40.2 39.6 Median age for American Indian / Alaska Native residents14.2 -594,925,633.7 50.9 Median age for Asian residents49.8 51.6 -679,849,340.2 Median age for Native Hawaiian / Pacific Islander residents-858,307,848.3 -443,298,968.6 30.0 Median age for Other race residents34.2 28.1 47.4 Median age for Two or more races residents34.3 52.2 52.2 Median age for White alone residents49.9 53.7 42.2 Median age for Hispanic or Latino residents41.1 44.7
Owner/renter occupied households by race in Merritt Island
House owners and renters - White residents 10,383 83.0% Owner occupied2,133 17.0% Renter occupiedHouse owners and renters - Black or African American residents 119 33.7% Owner occupied233 66.3% Renter occupiedHouse owners and renters - American Indian / Alaska Native residents 13 100.0% Renter occupiedHouse owners and renters - Asian residents 275 97.8% Owner occupied6 2.2% Renter occupiedHouse owners and renters - Native Hawaiian / Pacific Islander residents 15 100.0% Owner occupiedHouse owners and renters - Other race residents 113 56.2% Owner occupied88 43.8% Renter occupiedHouse owners and renters - Two or more races residents 547 81.2% Owner occupied126 18.8% Renter occupiedHouse owners and renters - White alone residents 10,248 83.5% Owner occupied2,025 16.5% Renter occupiedHouse owners and renters - Hispanic or Latino residents 551 70.1% Owner occupied235 29.9% Renter occupied
Language usage in Merritt Island
English speakers - Total 89.8% of residents of Merritt Island speak English at home.
5.8% of residents speak Spanish at home 1,330 68.0% Speak English very well625 32.0% Speak English less than very well4.3% of residents speak other language at home 1,112 76.3% Speak English very well345 23.7% Speak English less than very well
English speakers - Born in the United States 96.5% of residents of Merritt Island speak English at home.
3.1% of residents speak Spanish at home 602 91.9% Speak English very well53 8.1% Speak English less than very well0.5% of residents speak other language at home 53 55.8% Speak English very well42 44.2% Speak English less than very well
English speakers - Native, born elsewhere 65.7% of residents of Merritt Island speak English at home.
28.6% of residents speak Spanish at home 141 52.6% Speak English very well127 47.4% Speak English less than very well8.0% of residents speak other language at home 75 100.0% Speak English very well
English speakers - Foreign-born 27.8% of residents of Merritt Island speak English at home.
28.0% of residents speak Spanish at home 351 45.7% Speak English very well417 54.3% Speak English less than very well44.5% of residents speak other language at home 925 75.9% Speak English very well294 24.1% Speak English less than very well
White (Caucasian) - Speak only English Native:
98.2% (26,589)Foreign-born:
34.8% (414)
White (Caucasian) - Speak another language Native:
2.1% (570)Foreign-born:
62.0% (738)
Black or African American - Speak only English Native:
99.8% (754)Foreign-born:
92.1% (62)
American Indian / Alaska Native - Speak another language Native:
100.0% (25)Foreign-born:
100.0% (15)
Asian - Speak only English Native:
41.6% (94)Foreign-born:
30.9% (281)
Asian - Speak another language Native:
74.8% (169)Foreign-born:
70.0% (636)
Other race - Speak another language Native:
36.7% (157)Foreign-born:
100.0% (235)
Two or more races - Speak only English Native:
77.3% (1,754)Foreign-born:
38.6% (39)
Two or more races - Speak another language Native:
22.8% (517)Foreign-born:
63.5% (65)
White alone - Speak only English Native:
98.7% (26,250)Foreign-born:
46.2% (411)
White alone - Speak another language Native:
1.3% (335)Foreign-born:
53.4% (475)
Hispanic or Latino - Speak only English Native:
45.8% (776)Foreign-born:
5.5% (50)
Hispanic or Latino - Speak another language Native:
53.5% (907)Foreign-born:
94.9% (858)
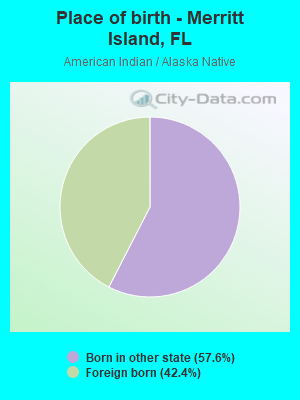
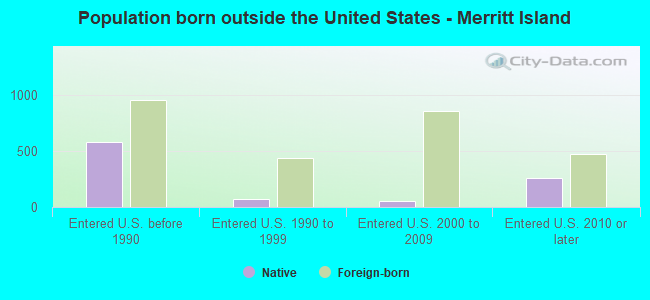
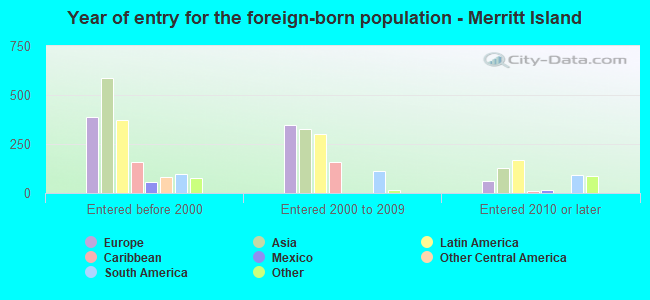
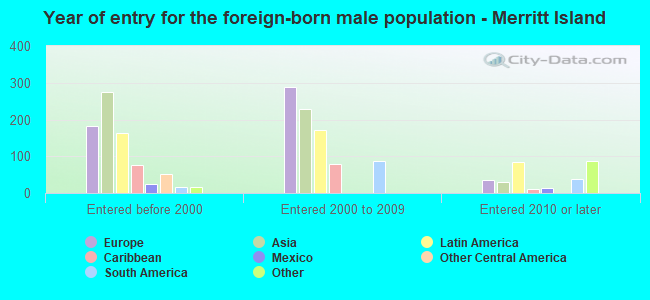
Foreign-born residents in Merritt Island 2,572 residents are foreign born (2.7% Asia , 2.2% Latin America , 1.7% Europe ).
This city:
7.3%Florida:
21.1%
Marital status for residents in Merritt Island Marital status - White (Caucasian) population 15 years and over
Males 27.8% Never married55.8% Now married0.8% Separated4.4% Widowed11.1% DivorcedFemales 17.6% Never married54.4% Now married1.4% Separated10.7% Widowed15.8% DivorcedWomen who gave birth in the past 12 months Now married:
80.4% (329)Unmarried:
19.6% (80)
Women who did not give birth in the past 12 months Now married:
48.9% (2,157)Unmarried:
51.1% (2,255)
Marital status - Black or African American population 15 years and over
Males 33.9% Never married29.1% Now married0.0% Separated12.5% Widowed24.5% DivorcedFemales 22.3% Never married44.3% Now married0.0% Separated0.0% Widowed33.3% DivorcedWomen who did not give birth in the past 12 months Now married:
65.4% (85)Unmarried:
34.6% (45)
Marital status - American Indian / Alaska Native population 15 years and over
Males 41.7% Never married58.3% Now married0.0% Separated0.0% Widowed0.0% DivorcedFemales 0.0% Never married100.0% Now married0.0% Separated0.0% Widowed0.0% DivorcedWomen who did not give birth in the past 12 months Now married:
100.0% (11)Unmarried:
0.0% (0)
Marital status - Asian population 15 years and over
Males 40.8% Never married36.4% Now married0.0% Separated22.7% Widowed0.0% DivorcedFemales 25.2% Never married51.6% Now married0.0% Separated17.7% Widowed5.5% DivorcedWomen who gave birth in the past 12 months Now married:
100.0% (9)Unmarried:
0.0% (0)
Women who did not give birth in the past 12 months Now married:
40.7% (107)Unmarried:
59.3% (156)
Marital status - Native Hawaiian / Pacific Islander population 15 years and over
Males 0.0% Never married100.0% Now married0.0% Separated0.0% Widowed0.0% DivorcedFemales 0.0% Never married100.0% Now married0.0% Separated0.0% Widowed0.0% DivorcedMarital status - Other race population 15 years and over
Males 53.4% Never married42.1% Now married0.0% Separated0.0% Widowed4.5% DivorcedFemales 65.8% Never married17.4% Now married0.0% Separated14.2% Widowed2.7% DivorcedWomen who did not give birth in the past 12 months Now married:
20.9% (49)Unmarried:
79.1% (187)
Marital status - Two or more races population 15 years and over
Males 34.4% Never married64.3% Now married0.6% Separated0.0% Widowed0.6% DivorcedFemales 26.7% Never married63.6% Now married0.0% Separated4.2% Widowed5.5% DivorcedWomen who did not give birth in the past 12 months Now married:
29.5% (120)Unmarried:
70.5% (288)
Marital status - White alone, not Hispanic / Latino population 15 years and over
Males 27.5% Never married56.6% Now married0.8% Separated4.0% Widowed11.0% DivorcedFemales 16.8% Never married54.6% Now married1.5% Separated11.2% Widowed15.9% DivorcedWomen who gave birth in the past 12 months Now married:
78.3% (299)Unmarried:
21.7% (83)
Women who did not give birth in the past 12 months Now married:
49.9% (2,149)Unmarried:
50.1% (2,157)
Marital status - Hispanic or Latino population 15 years and over
Males 33.0% Never married50.0% Now married0.5% Separated7.7% Widowed8.8% DivorcedFemales 33.6% Never married52.8% Now married0.0% Separated3.2% Widowed10.4% DivorcedWomen who gave birth in the past 12 months Now married:
100.0% (45)Unmarried:
0.0% (0)
Women who did not give birth in the past 12 months Now married:
32.2% (163)Unmarried:
67.8% (344)
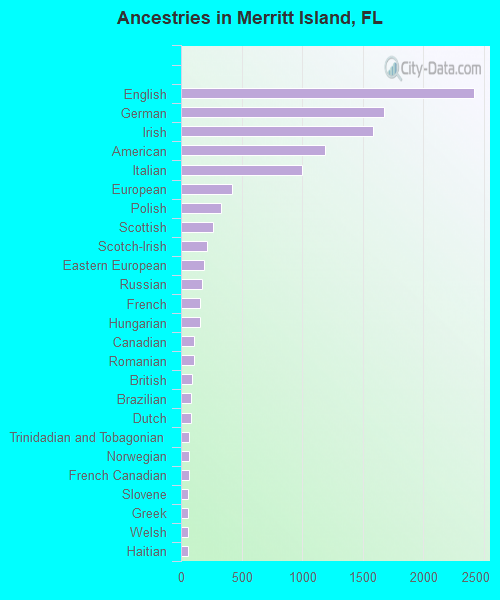
Ancestries in Merritt Island
2,422 17.7% English1,675 12.2% German1,583 11.5% Irish1,191 8.7% American1,003 7.3% Italian418 3.0% European327 2.4% Polish262 1.9% Scottish214 1.6% Scotch-Irish188 1.4% Eastern European171 1.2% Russian154 1.1% French154 1.1% Hungarian110 0.8% Canadian109 0.8% Romanian93 0.7% British84 0.6% Brazilian81 0.6% Dutch67 0.5% Trinidadian and Tobagonian65 0.5% Norwegian62 0.5% French Canadian60 0.4% Slovene60 0.4% Greek57 0.4% Welsh55 0.4% Haitian44 0.3% Austrian44 0.3% Swedish44 0.3% Lithuanian36 0.3% Swiss36 0.3% Ukrainian29 0.2% Portuguese29 0.2% South African27 0.2% Ugandan26 0.2% Scandinavian22 0.2% Pennsylvania German21 0.2% Czechoslovakian18 0.1% Slovak17 0.1% Serbian16 0.1% Australian14 0.1% Finnish12 0.09% Jamaican11 0.08% Icelander11 0.08% British West Indian10 0.07% Northern European10 0.07% Iranian10 0.07% Bahamian9 0.07% Armenian9 0.07% Estonian9 0.07% Danish8 0.06% Luxembourger6 0.04% Celtic5 0.04% Czech5 0.04% West Indian1 0.01% Israeli
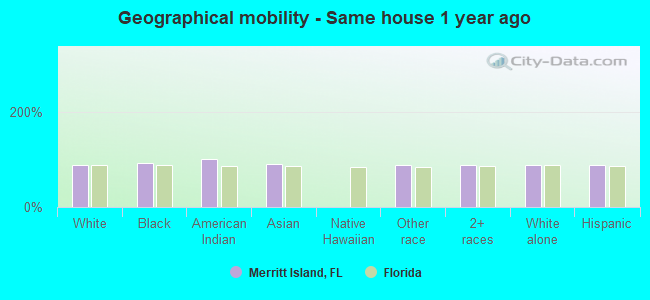
Geographical mobility in Merritt Island Same house 1 year ago 25,772 88.3% White (Caucasian)777 92.9% Black or African American41 100.0% American Indian / Alaska Native1,028 91.5% Asian582 87.6% Other race2,300 89.1% Two or more races25,059 88.3% White alone, not Hispanic / Latino2,285 86.8% Hispanic or LatinoMoved within same county 1,591 5.4% White / Caucasian66 7.9% Black or African American72 6.4% Asian221 8.6% Two or more races1,584 5.6% White alone, not Hispanic / Latino109 4.1% Hispanic or LatinoMoved within same state 373 1.3% White / Caucasian21 2.6% Black or African American29 1.1% Two or more races331 1.2% White alone, not Hispanic / Latino36 1.4% Hispanic or LatinoMoved from different state 1,415 4.8% White / Caucasian6 0.5% Asian77 100.0% Native Hawaiian / Pacific Islander100 15.0% Other race22 0.9% Two or more races1,303 4.6% White alone, not Hispanic / Latino131 5.0% Hispanic or LatinoMoved from abroad 51 0.2% White7 0.6% Asian47 7.1% Other race41 0.1% White alone, not Hispanic / Latino47 1.8% Hispanic or Latino
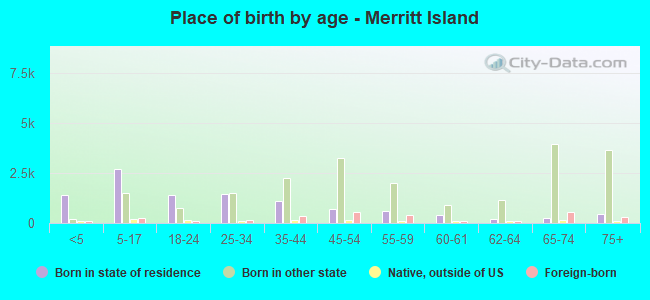
Children Nativity (place of birth) in Merritt Island
Children under 6 years - Living with two parents Both parents native 1,399 100.0% NativeBoth parents foreign-born 7 100.0% NativeOne native, one foreign-born parent 61 100.0% NativeChildren under 6 years - Living with one parent Native parent 510 100.0% NativeForeign-born parent 7 40.3% Native10 59.7% Foreign-bornChildren 6 to 17 years - Living with two parents Both parents native 2,163 94.9% Native116 5.1% Foreign-bornBoth parents foreign-born 103 55.2% Native83 44.8% Foreign-bornOne native, one foreign-born parent 382 96.2% Native15 3.8% Foreign-bornChildren 6 to 17 years - Living with one parent Native parent 815 100.0% NativeForeign-born parent 66 57.1% Native49 42.9% Foreign-born
Grandparents responsible for own grandchildren in Merritt Island
Grandparents (30 to 59 years) White / Caucasian 60 24.8% Responsible for grandchildren182 75.2% Not responsible for grandchildrenBlack or African American 25 100.0% Responsible for grandchildrenWhite alone, not Hispanic / Latino 40 19.9% Responsible for grandchildren159 80.1% Not responsible for grandchildrenHispanic or Latino 15 100.0% Responsible for grandchildrenGrandparents (60 years and over) White / Caucasian 284 69.3% Responsible for grandchildren126 30.7% Not responsible for grandchildrenBlack or African American 28 100.0% Responsible for grandchildrenWhite alone, not Hispanic / Latino 253 71.7% Responsible for grandchildren100 28.3% Not responsible for grandchildrenHispanic or Latino 126 100.0% Not responsible for grandchildren