Races in Middle Siuslaw-Triangle Lake, Oregon (OR) Detailed Stats
Ancestries, Foreign-born residents, place of birth
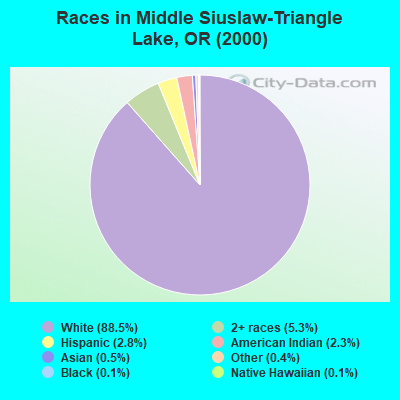
Race distribution in Middle Siuslaw-Triangle Lake

- 2,08488.5%White alone
- 1245.3%Two or more races
- 672.8%Hispanic
- 542.3%American Indian alone
- 110.5%Asian alone
- 90.4%Other race alone
- 30.1%Black alone
- 30.1%Native Hawaiian and Other
Pacific Islander alone
2000
2022
-
- 2,857,61683.5%White alone
- 275,3148.0%Hispanic
- 100,3332.9%Asian alone
- 82,7332.4%Two or more races
- 53,3251.6%Black alone
- 40,1301.2%American Indian alone
- 7,3980.2%Native Hawaiian and Other
Pacific Islander alone - 4,5500.1%Other race alone

-
- 3,037,57171.6%White alone
- 609,53814.4%Hispanic
- 252,7446.0%Two or more races
- 191,2834.5%Asian alone
- 78,2281.8%Black alone
- 29,3990.7%American Indian alone
- 25,7310.6%Other race alone
- 15,6430.4%Native Hawaiian and Other
Pacific Islander alone

Income and house value in Middle Siuslaw-Triangle Lake
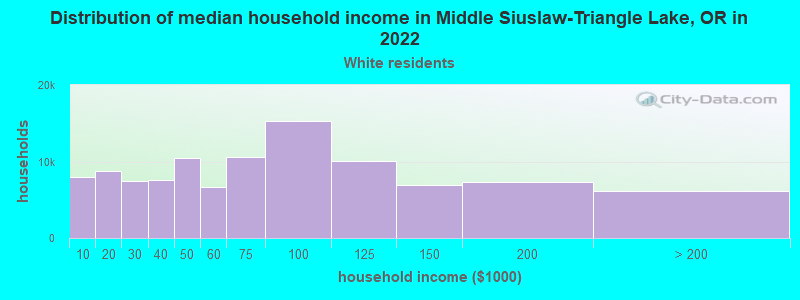
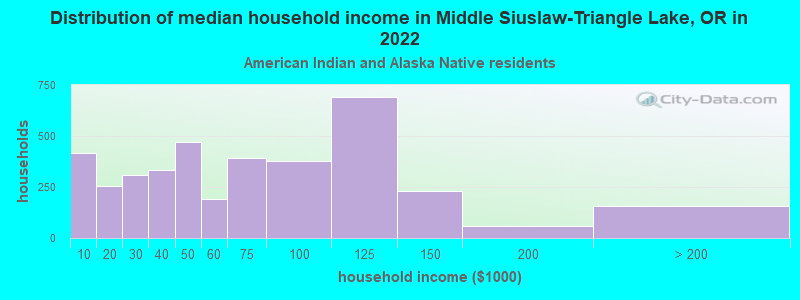
- Median household income in 2022
- $51,319White non-Hispanic householders
- $16,877American Indian and Alaska Native householders
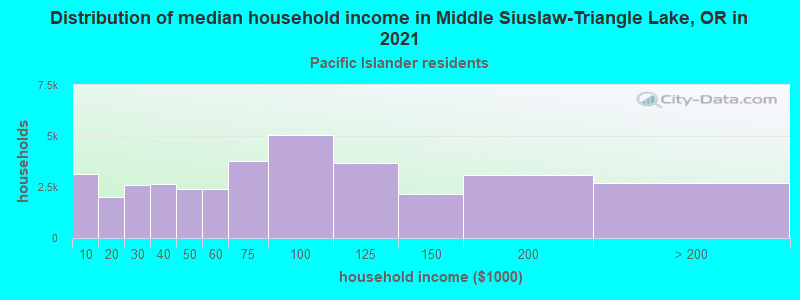
- $14,667Native Hawaiian and other Pacific Islander householders
- $59,573Some other race householders
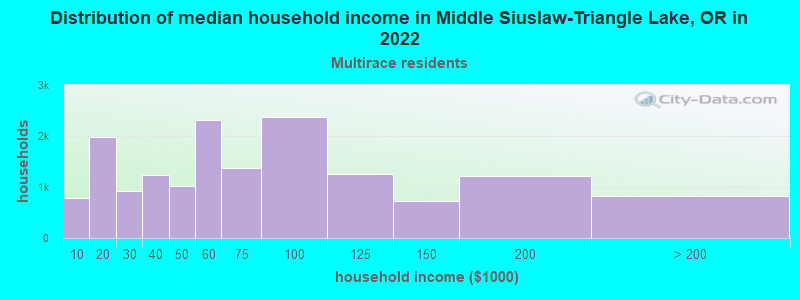
- $77,849Two or more races householders
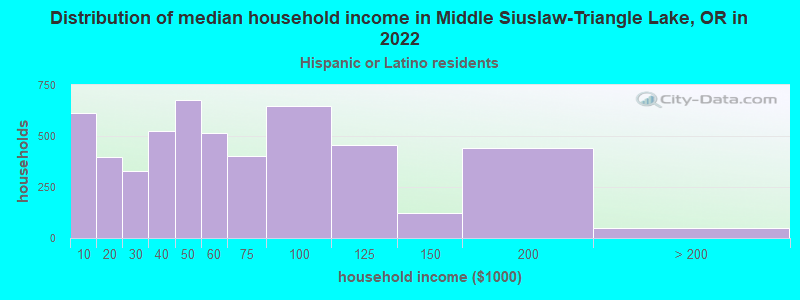
- $21,703Hispanic or Latino race householders
- Median 2022 house value
- $344,089White Non-Hispanic householders
- $314,432Two or more races householders
- $518,207Hispanic or Latino householders
Household income for White non-Hispanic householders
Household income for American Indian and Alaska Native householders
Household income for Native Hawaiian and other Pacific Islander householders
Household income for Two or more races householders
Household income for Hispanic or Latino race householders
Zip code: 97430