Races in Milbridge, Maine (ME) Detailed Stats
Ancestries, Foreign-born residents, place of birth

Recent posts about races in Milbridge, Maine on our local forum with over 2,400,000 registered users:
 | Hispanic/Latino Community (20 replies) |
| moving to milbridge maine, or not? (21 replies) |
| Vacation in Milbridge area (17 replies) |
| Impact of pandemic on moving plans (22 replies) |
| Old house / Brownsville?? (75 replies) |
| WANTED: A Nice Port Town (I'd like to see the sea from my house) (52 replies) |
6.8% of Milbridge, ME residents are foreign-born (5.5% born in Latin America, 0.9% born in Europe), which is 55.9% greater than the foreign-born rate of 3.0% across the entire state of Maine.
Race distribution in Milbridge

- 1,17992.2%White alone
- 846.6%Hispanic
- 100.8%Two or more races
- 40.3%American Indian alone
- 20.2%Asian alone
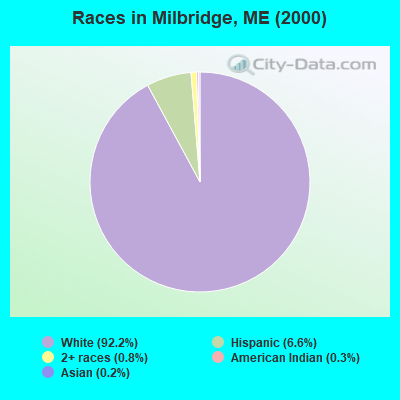
2000
2022
-
- 1,230,29796.5%White alone
- 11,7310.9%Two or more races
- 9,3600.7%Hispanic
- 9,0140.7%Asian alone
- 6,4400.5%Black alone
- 6,9110.5%American Indian alone
- 8360.07%Other race alone
- 3340.03%Native Hawaiian and Other
Pacific Islander alone

-
- 1,249,23390.2%White alone
- 58,3574.2%Two or more races
- 28,7172.1%Hispanic
- 21,5831.6%Black alone
- 16,1511.2%Asian alone
- 5,8730.4%Other race alone
- 5,2050.4%American Indian alone
- 2210.02%Native Hawaiian and Other
Pacific Islander alone

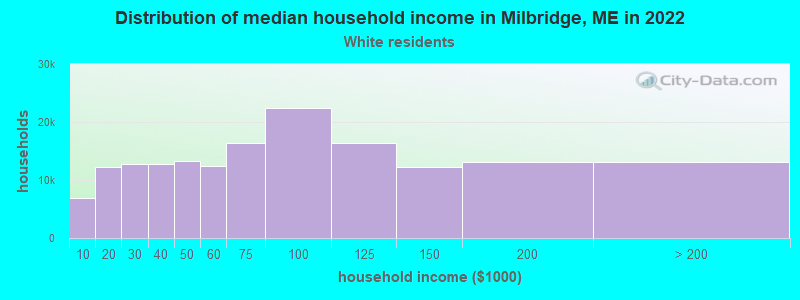
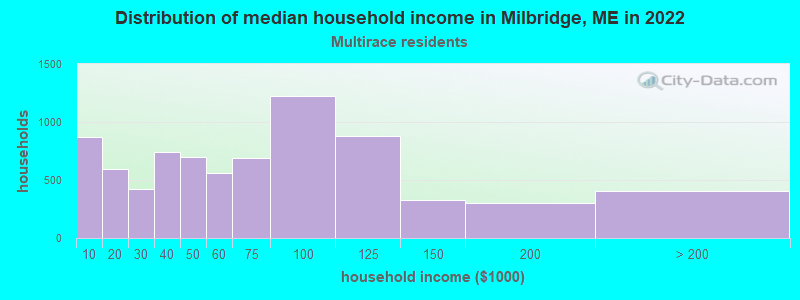
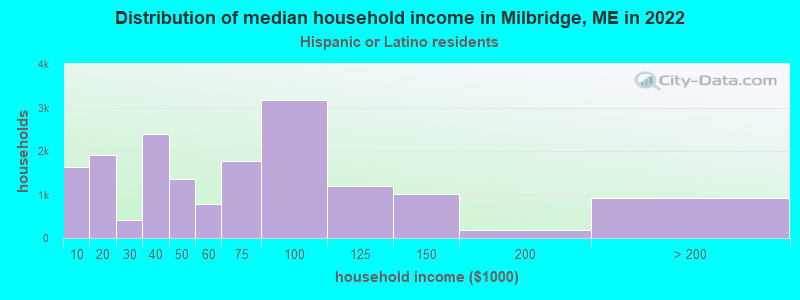
Income and house value in Milbridge
- Median household income in 2022
- $41,061White non-Hispanic householders
- $147,246Some other race householders
- $34,319Two or more races householders
- $77,809Hispanic or Latino race householders
- Median 2022 house value
- $180,884White Non-Hispanic householders
Household income for White non-Hispanic householders
Household income for Two or more races householders
Household income for Hispanic or Latino race householders
Foreign-born residents in Milbridge
87 residents are foreign born (5.5% Latin America, 0.9% Europe).
| This city: | 6.8% |
| Maine: | 2.9% |
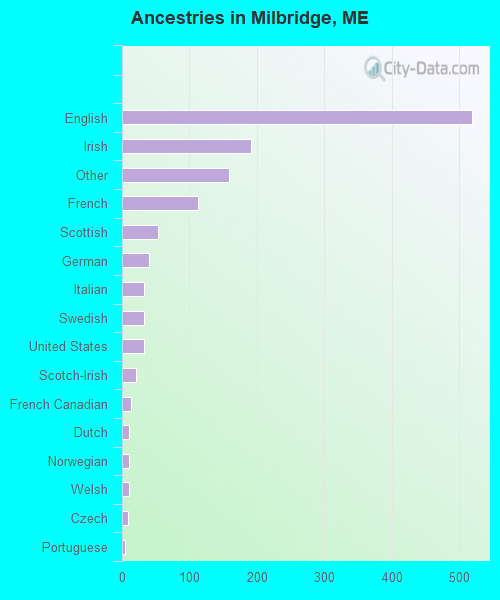
Ancestries in Milbridge

- 51841.1%English
- 19115.1%Irish
- 15912.6%Other
- 1139.0%French
- 534.2%Scottish
- 403.2%German
- 332.6%Italian
- 332.6%Swedish
- 332.6%United States
- 211.7%Scotch-Irish
- 131.0%French Canadian
- 100.8%Dutch
- 100.8%Norwegian
- 100.8%Welsh
- 90.7%Czech
- 50.4%Portuguese
- 20.2%Arab
- 20.2%Danish
- 20.2%Greek
- 20.2%Hungarian
- 20.2%Polish
Zip codes: 04658.