Races in Milliken, Colorado (CO) Detailed Stats
Data:
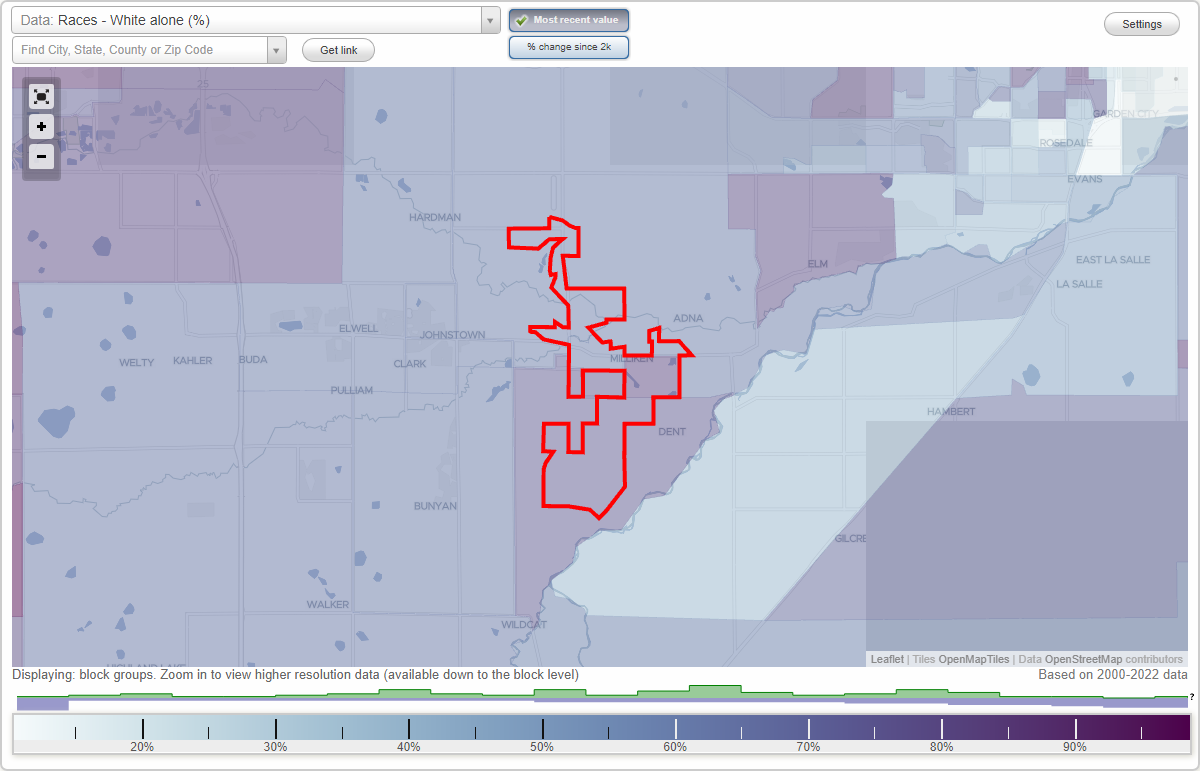
Races - White alone (%)
Races - White alone (% change since 2000)
Races - Black alone (%)
Races - Black alone (% change since 2000)
Races - American Indian alone (%)
Races - American Indian alone (% change since 2000)
Races - Asian alone (%)
Races - Asian alone (% change since 2000)
Races - Hispanic (%)
Races - Hispanic (% change since 2000)
Races - Native Hawaiian and Other Pacific Islander alone (%)
Races - Native Hawaiian and Other Pacific Islander alone (% change since 2000)
Races - Two or more races(%)
Races - Two or more races(% change since 2000)
Races - Other race alone (%)
Races - Other race alone (% change since 2000)
Racial diversity
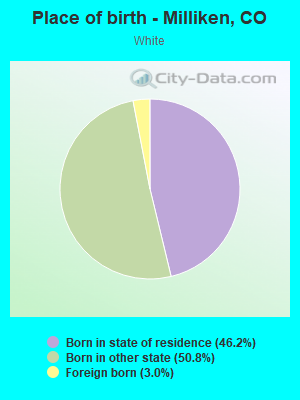
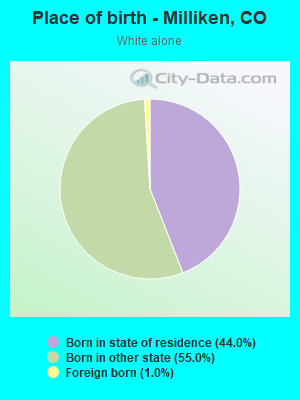
Place of birth - Born in state of residence (%)
Place of birth - Born in state of residence (%) - White
Place of birth - Born in state of residence (%) - Black or African American
Place of birth - Born in state of residence (%) - Asian
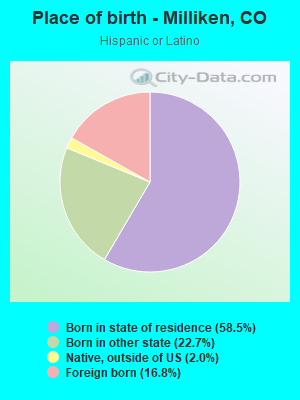
Place of birth - Born in state of residence (%) - Hispanic or Latino
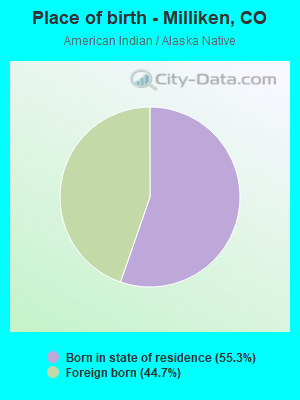
Place of birth - Born in state of residence (%) - American Indian and Alaska Native
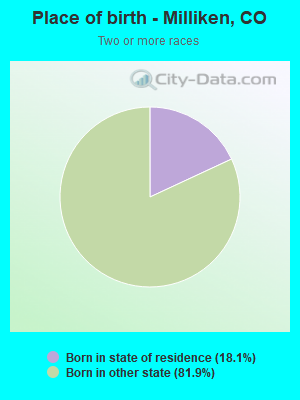
Place of birth - Born in state of residence (%) - Multirace
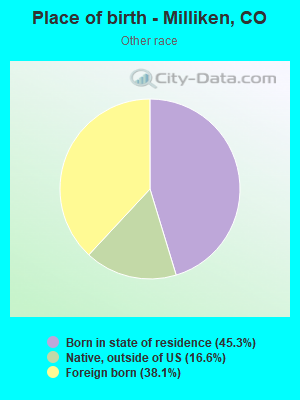
Place of birth - Born in state of residence (%) - Other Race
Place of birth - Born in other state (%)
Place of birth - Born in other state (%) - White
Place of birth - Born in other state (%) - Black or African American
Place of birth - Born in other state (%) - Asian
Place of birth - Born in other state (%) - Hispanic or Latino
Place of birth - Born in other state (%) - American Indian and Alaska Native
Place of birth - Born in other state (%) - Multirace
Place of birth - Born in other state (%) - Other Race
Place of birth - Native, outside of US (%)
Place of birth - Native, outside of US (%) - White
Place of birth - Native, outside of US (%) - Black or African American
Place of birth - Native, outside of US (%) - Asian
Place of birth - Native, outside of US (%) - Hispanic or Latino
Place of birth - Native, outside of US (%) - American Indian and Alaska Native
Place of birth - Native, outside of US (%) - Multirace
Place of birth - Native, outside of US (%) - Other Race
Place of birth - Foreign born (%)
Place of birth - Foreign born (%) - White
Place of birth - Foreign born (%) - Black or African American
Place of birth - Foreign born (%) - Asian
Place of birth - Foreign born (%) - Hispanic or Latino
Place of birth - Foreign born (%) - American Indian and Alaska Native
Place of birth - Foreign born (%) - Multirace
Place of birth - Foreign born (%) - Other Race
Residents speaking English at home (%)
Residents speaking English at home - Born in the United States (%)
Residents speaking English at home - Native, born elsewhere (%)
Residents speaking English at home - Foreign born (%)
Residents speaking Spanish at home (%)
Residents speaking Spanish at home - Born in the United States (%)
Residents speaking Spanish at home - Native, born elsewhere (%)
Residents speaking Spanish at home - Foreign born (%)
Residents speaking other language at home (%)
Residents speaking other language at home - Born in the United States (%)
Residents speaking other language at home - Native, born elsewhere (%)
Residents speaking other language at home - Foreign born (%)
Marital status - Never married (%)
Marital status - Now married (%)
Marital status - Separated (%)
Marital status - Widowed (%)
Marital status - Divorced (%)
Ancestries Reported - Arab (%)
Ancestries Reported - Czech (%)
Ancestries Reported - Danish (%)
Ancestries Reported - Dutch (%)
Ancestries Reported - English (%)
Ancestries Reported - French (%)
Ancestries Reported - French Canadian (%)
Ancestries Reported - German (%)
Ancestries Reported - Greek (%)
Ancestries Reported - Hungarian (%)
Ancestries Reported - Irish (%)
Ancestries Reported - Italian (%)
Ancestries Reported - Lithuanian (%)
Ancestries Reported - Norwegian (%)
Ancestries Reported - Polish (%)
Ancestries Reported - Portuguese (%)
Ancestries Reported - Russian (%)
Ancestries Reported - Scotch-Irish (%)
Ancestries Reported - Scottish (%)
Ancestries Reported - Slovak (%)
Ancestries Reported - Subsaharan African (%)
Ancestries Reported - Swedish (%)
Ancestries Reported - Swiss (%)
Ancestries Reported - Ukrainian (%)
Ancestries Reported - United States (%)
Ancestries Reported - Welsh (%)
Ancestries Reported - West Indian (%)
Ancestries Reported - Other (%)
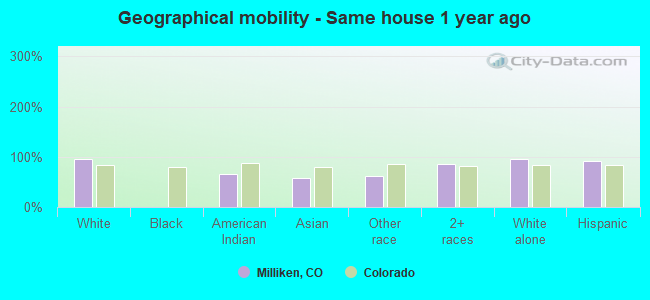
Geographical mobility - Same house 1 year ago (%)
Geographical mobility - Same house 1 year ago (%) - White
Geographical mobility - Same house 1 year ago (%) - Black or African American
Geographical mobility - Same house 1 year ago (%) - Asian
Geographical mobility - Same house 1 year ago (%) - Hispanic or Latino
Geographical mobility - Same house 1 year ago (%) - American Indian and Alaska Native
Geographical mobility - Same house 1 year ago (%) - Multirace
Geographical mobility - Same house 1 year ago (%) - Other Race
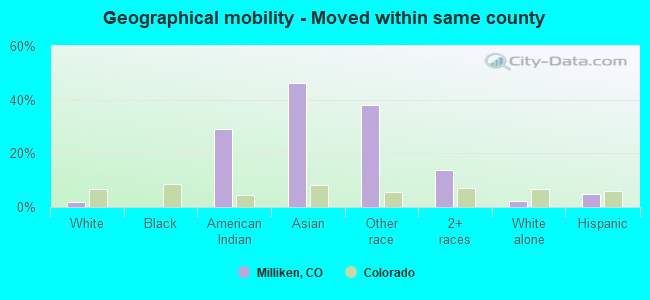
Geographical mobility - Moved within same county (%)
Geographical mobility - Moved within same county (%) - White
Geographical mobility - Moved within same county (%) - Black or African American
Geographical mobility - Moved within same county (%) - Asian
Geographical mobility - Moved within same county (%) - Hispanic or Latino
Geographical mobility - Moved within same county (%) - American Indian and Alaska Native
Geographical mobility - Moved within same county (%) - Multirace
Geographical mobility - Moved within same county (%) - Other Race
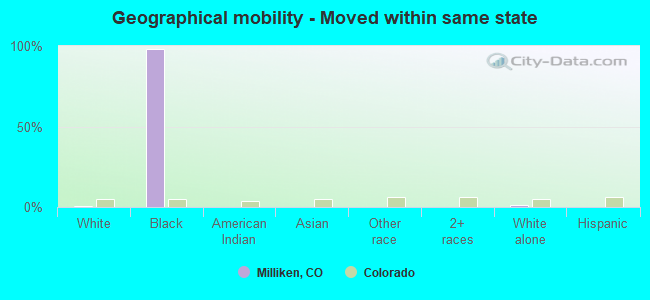
Geographical mobility - Moved from different county within same state (%)
Geographical mobility - Moved from different county within same state (%) - White
Geographical mobility - Moved from different county within same state (%) - Black or African American
Geographical mobility - Moved from different county within same state (%) - Asian
Geographical mobility - Moved from different county within same state (%) - Hispanic or Latino
Geographical mobility - Moved from different county within same state (%) - American Indian and Alaska Native
Geographical mobility - Moved from different county within same state (%) - Multirace
Geographical mobility - Moved from different county within same state (%) - Other Race
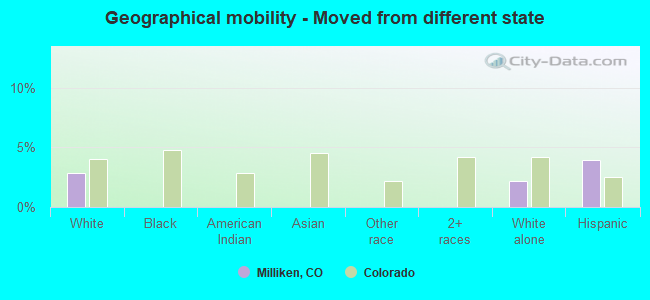
Geographical mobility - Moved from different state (%)
Geographical mobility - Moved from different state (%) - White
Geographical mobility - Moved from different state (%) - Black or African American
Geographical mobility - Moved from different state (%) - Asian
Geographical mobility - Moved from different state (%) - Hispanic or Latino
Geographical mobility - Moved from different state (%) - American Indian and Alaska Native
Geographical mobility - Moved from different state (%) - Multirace
Geographical mobility - Moved from different state (%) - Other Race
Geographical mobility - Moved from abroad (%)
Geographical mobility - Moved from abroad (%) - White
Geographical mobility - Moved from abroad (%) - Black or African American
Geographical mobility - Moved from abroad (%) - Asian
Geographical mobility - Moved from abroad (%) - Hispanic or Latino
Geographical mobility - Moved from abroad (%) - American Indian and Alaska Native
Geographical mobility - Moved from abroad (%) - Multirace
Geographical mobility - Moved from abroad (%) - Other Race
Place of birth for the foreign-born population - Ireland (%)
Place of birth for the foreign-born population - Denmark (%)
Place of birth for the foreign-born population - Norway (%)
Place of birth for the foreign-born population - Sweden (%)
Place of birth for the foreign-born population - United Kingdom (%)
Place of birth for the foreign-born population - England (%)
Place of birth for the foreign-born population - Scotland (%)
Place of birth for the foreign-born population - Other Northern Europe (%)
Place of birth for the foreign-born population - Austria (%)
Place of birth for the foreign-born population - Belgium (%)
Place of birth for the foreign-born population - France (%)
Place of birth for the foreign-born population - Germany (%)
Place of birth for the foreign-born population - Netherlands (%)
Place of birth for the foreign-born population - Switzerland (%)
Place of birth for the foreign-born population - Other Western Europe (%)
Place of birth for the foreign-born population - Greece (%)
Place of birth for the foreign-born population - Italy (%)
Place of birth for the foreign-born population - Portugal (%)
Place of birth for the foreign-born population - Spain (%)
Place of birth for the foreign-born population - Other Southern Europe (%)
Place of birth for the foreign-born population - Albania (%)
Place of birth for the foreign-born population - Belarus (%)
Place of birth for the foreign-born population - Bosnia and Herzegovina (%)
Place of birth for the foreign-born population - Bulgaria (%)
Place of birth for the foreign-born population - Croatia (%)
Place of birth for the foreign-born population - Czechoslovakia (%)
Place of birth for the foreign-born population - Hungary (%)
Place of birth for the foreign-born population - Latvia (%)
Place of birth for the foreign-born population - Lithuania (%)
Place of birth for the foreign-born population - North Macedonia (Macedonia) (%)
Place of birth for the foreign-born population - Moldova (%)
Place of birth for the foreign-born population - Poland (%)
Place of birth for the foreign-born population - Romania (%)
Place of birth for the foreign-born population - Russia (%)
Place of birth for the foreign-born population - Serbia (%)
Place of birth for the foreign-born population - Ukraine (%)
Place of birth for the foreign-born population - Other Eastern Europe (%)
Place of birth for the foreign-born population - China (%)
Place of birth for the foreign-born population - Hong Kong (%)
Place of birth for the foreign-born population - Taiwan (%)
Place of birth for the foreign-born population - Japan (%)
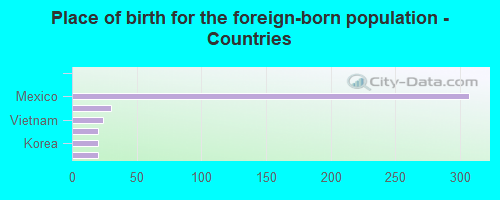
Place of birth for the foreign-born population - Korea (%)
Place of birth for the foreign-born population - Other Eastern Asia (%)
Place of birth for the foreign-born population - Afghanistan (%)
Place of birth for the foreign-born population - Bangladesh (%)
Place of birth for the foreign-born population - India (%)
Place of birth for the foreign-born population - Iran (%)
Place of birth for the foreign-born population - Kazakhstan (%)
Place of birth for the foreign-born population - Nepal (%)
Place of birth for the foreign-born population - Pakistan (%)
Place of birth for the foreign-born population - Sri Lanka (%)
Place of birth for the foreign-born population - Uzbekistan (%)
Place of birth for the foreign-born population - Other South Central Asia (%)
Place of birth for the foreign-born population - Burma (%)
Place of birth for the foreign-born population - Cambodia (%)
Place of birth for the foreign-born population - Indonesia (%)
Place of birth for the foreign-born population - Laos (%)
Place of birth for the foreign-born population - Malaysia (%)
Place of birth for the foreign-born population - Philippines (%)
Place of birth for the foreign-born population - Singapore (%)
Place of birth for the foreign-born population - Thailand (%)
Place of birth for the foreign-born population - Vietnam (%)
Place of birth for the foreign-born population - Other South Eastern Asia (%)
Place of birth for the foreign-born population - Armenia (%)
Place of birth for the foreign-born population - Iraq (%)
Place of birth for the foreign-born population - Israel (%)
Place of birth for the foreign-born population - Jordan (%)
Place of birth for the foreign-born population - Kuwait (%)
Place of birth for the foreign-born population - Lebanon (%)
Place of birth for the foreign-born population - Saudi Arabia (%)
Place of birth for the foreign-born population - Syria (%)
Place of birth for the foreign-born population - Turkey (%)
Place of birth for the foreign-born population - Yemen (%)
Place of birth for the foreign-born population - Other Western Asia (%)
Place of birth for the foreign-born population - Eritrea (%)
Place of birth for the foreign-born population - Ethiopia (%)
Place of birth for the foreign-born population - Kenya (%)
Place of birth for the foreign-born population - Somalia (%)
Place of birth for the foreign-born population - Uganda (%)
Place of birth for the foreign-born population - Zimbabwe (%)
Place of birth for the foreign-born population - Other Eastern Africa (%)
Place of birth for the foreign-born population - Cameroon (%)
Place of birth for the foreign-born population - Congo (%)
Place of birth for the foreign-born population - Democratic Republic of Congo (Zaire) (%)
Place of birth for the foreign-born population - Other Middle Africa (%)
Place of birth for the foreign-born population - Egypt (%)
Place of birth for the foreign-born population - Morocco (%)
Place of birth for the foreign-born population - Sudan (%)
Place of birth for the foreign-born population - Other Northern Africa (%)
Place of birth for the foreign-born population - South Africa (%)
Place of birth for the foreign-born population - Other Southern Africa (%)
Place of birth for the foreign-born population - Cabo Verde (%)
Place of birth for the foreign-born population - Ghana (%)
Place of birth for the foreign-born population - Liberia (%)
Place of birth for the foreign-born population - Nigeria (%)
Place of birth for the foreign-born population - Senegal (%)
Place of birth for the foreign-born population - Sierra Leone (%)
Place of birth for the foreign-born population - Other Western Africa (%)
Place of birth for the foreign-born population - Australia (%)
Place of birth for the foreign-born population - New Zealand (%)
Place of birth for the foreign-born population - Fiji (%)
Place of birth for the foreign-born population - Micronesia (%)
Place of birth for the foreign-born population - Bahamas (%)
Place of birth for the foreign-born population - Barbados (%)
Place of birth for the foreign-born population - Cuba (%)
Place of birth for the foreign-born population - Dominica (%)
Place of birth for the foreign-born population - Dominican Republic (%)
Place of birth for the foreign-born population - Grenada (%)
Place of birth for the foreign-born population - Haiti (%)
Place of birth for the foreign-born population - Jamaica (%)
Place of birth for the foreign-born population - St. Vincent and the Grenadines (%)
Place of birth for the foreign-born population - Trinidad and Tobago (%)
Place of birth for the foreign-born population - West Indies (%)
Place of birth for the foreign-born population - Other Caribbean (%)
Place of birth for the foreign-born population - Belize (%)
Place of birth for the foreign-born population - Costa Rica (%)
Place of birth for the foreign-born population - El Salvador (%)
Place of birth for the foreign-born population - Guatemala (%)
Place of birth for the foreign-born population - Honduras (%)
Place of birth for the foreign-born population - Mexico (%)
Place of birth for the foreign-born population - Nicaragua (%)
Place of birth for the foreign-born population - Panama (%)
Place of birth for the foreign-born population - Other Central America (%)
Place of birth for the foreign-born population - Argentina (%)
Place of birth for the foreign-born population - Bolivia (%)
Place of birth for the foreign-born population - Brazil (%)
Place of birth for the foreign-born population - Chile (%)
Place of birth for the foreign-born population - Colombia (%)
Place of birth for the foreign-born population - Ecuador (%)
Place of birth for the foreign-born population - Guyana (%)
Place of birth for the foreign-born population - Peru (%)
Place of birth for the foreign-born population - Uruguay (%)
Place of birth for the foreign-born population - Venezuela (%)
Place of birth for the foreign-born population - Other South America (%)
Place of birth for the foreign-born population - Canada (%)
Place of birth for the foreign-born population - Other Northern America (%)
Place of birth for the foreign-born population - Other (%)
Latest news about races in Milliken, CO collected exclusively by city-data.com from local newspapers, TV, and radio stations
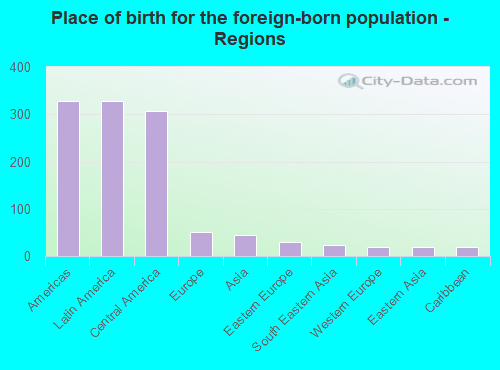
According to 2022 data, the most numerous races in Milliken, CO are White alone (5,232 residents), Hispanic (1,969 residents), and Two or more races (348 residents). 89.5% of Milliken residents speak English at home. 5.4% of Milliken, CO residents are foreign-born (4.4% born in Latin America, 0.7% born in Europe, 0.6% born in Asia), which is 67.5% less than the foreign-born rate of 9.0% across the entire state of Colorado.
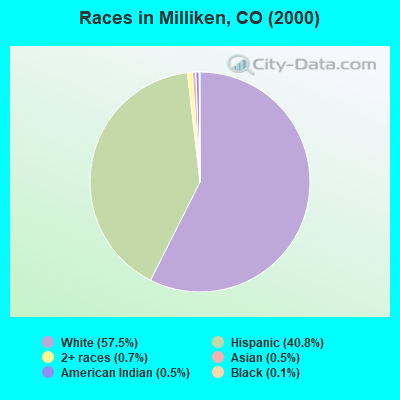
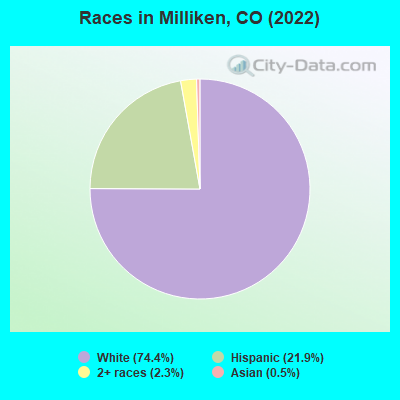
Race distribution in Milliken
2000 2022
3,202,880 74.5% White alone 735,601 17.1% Hispanic 158,443 3.7% Black alone 93,277 2.2% Asian alone 72,721 1.7% Two or more races 28,982 0.7% American Indian alone 5,512 0.1% Other race alone 3,845 0.09% Native Hawaiian and Other
3,793,270 65.0% White alone 1,314,962 22.5% Hispanic 268,754 4.6% Two or more races 220,756 3.8% Black alone 182,658 3.1% Asian alone 29,798 0.5% Other race alone 23,389 0.4% American Indian alone 6,339 0.1% Native Hawaiian and Other
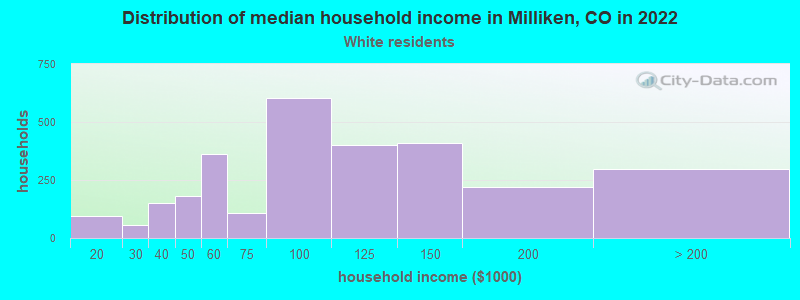
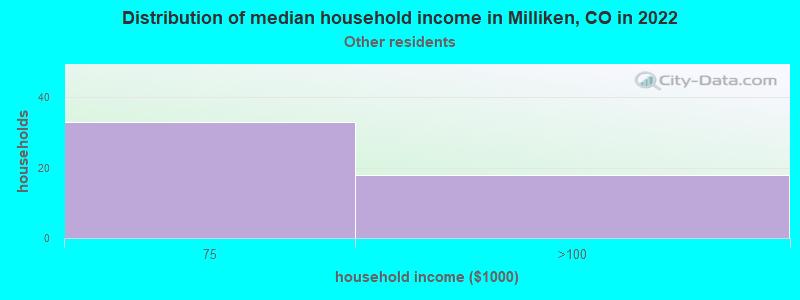
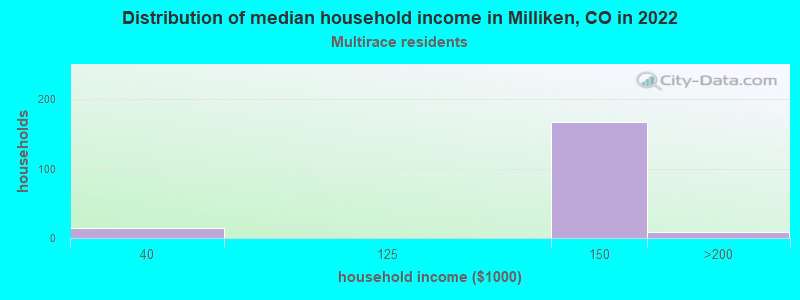
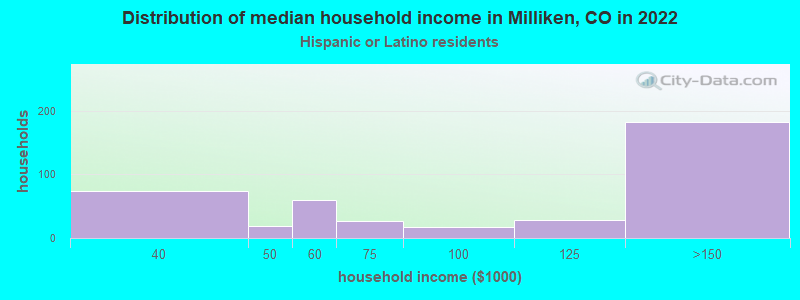
Income and house value in Milliken Median household income in 2022 $107,266 White non-Hispanic householders$63,532 Black householders$33,326 American Indian and Alaska Native householders$48,207 Asian householders$155,890 Some other race householders$124,009 Two or more races householders$72,920 Hispanic or Latino race householdersMedian 2022 house value $448,830 White Non-Hispanic householders$559,960 Black or African American householders$511,527 American Indian or Alaska Native householders $483,662 Asian householders$385,802 Some other race householders$435,561 Two or more races householders$380,826 Hispanic or Latino householders
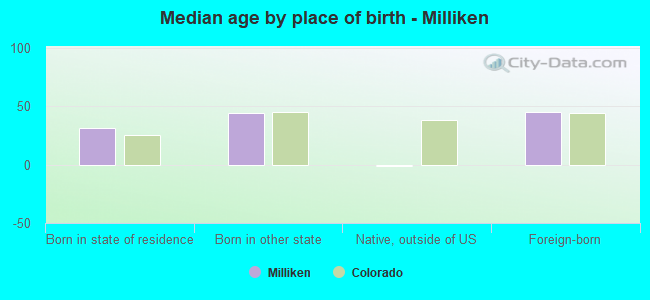
Median age by race in Milliken
38.6 Median age for White residents38.5 38.5 24.9 Median age for American Indian / Alaska Native residents57.4 Median age for Other race residents62.3 57.8 36.4 Median age for Two or more races residents35.3 36.8 40.5 Median age for White alone residents38.7 41.9 32.2 Median age for Hispanic or Latino residents36.5 17.5
Owner/renter occupied households by race in Milliken
House owners and renters - White residents 2,124 87.0% Owner occupied319 13.0% Renter occupiedHouse owners and renters - American Indian / Alaska Native residents 11 100.0% Renter occupiedHouse owners and renters - Other race residents 79 100.0% Owner occupiedHouse owners and renters - Two or more races residents 119 47.8% Owner occupied129 52.2% Renter occupiedHouse owners and renters - White alone residents 1,990 91.0% Owner occupied198 9.0% Renter occupiedHouse owners and renters - Hispanic or Latino residents 340 63.9% Owner occupied192 36.1% Renter occupied
Language usage in Milliken
English speakers - Total 89.5% of residents of Milliken speak English at home.
8.8% of residents speak Spanish at home 345 56.5% Speak English very well266 43.5% Speak English less than very well1.8% of residents speak other language at home 17 13.9% Speak English very well105 86.1% Speak English less than very well
English speakers - Born in the United States 97.3% of residents of Milliken speak English at home.
2.1% of residents speak Spanish at home 50 71.4% Speak English very well20 28.6% Speak English less than very well0.6% of residents speak other language at home 21 100.0% Speak English less than very well
English speakers - Native, born elsewhere 0.0% of residents of Milliken speak English at home.
75.0% of residents speak other language at home 24 100.0% Speak English less than very well
English speakers - Foreign-born 16.0% of residents of Milliken speak English at home.
68.3% of residents speak Spanish at home 97 33.8% Speak English very well190 66.2% Speak English less than very well12.9% of residents speak other language at home 54 100.0% Speak English less than very well
White (Caucasian) - Speak only English Native:
98.2% (5,720)Foreign-born:
8.0% (15)
White (Caucasian) - Speak another language Native:
3.4% (201)Foreign-born:
85.8% (164)
Other race - Speak only English Native:
32.2% (84)Foreign-born:
39.9% (70)
Other race - Speak another language Native:
68.7% (179)Foreign-born:
70.0% (123)
White alone - Speak only English Native:
99.1% (5,094)Foreign-born:
45.0% (19)
White alone - Speak another language Native:
1.1% (57)Foreign-born:
46.1% (19)
Hispanic or Latino - Speak only English Native:
77.1% (1,084)Foreign-born:
8.0% (31)
Hispanic or Latino - Speak another language Native:
24.2% (340)Foreign-born:
91.9% (351)
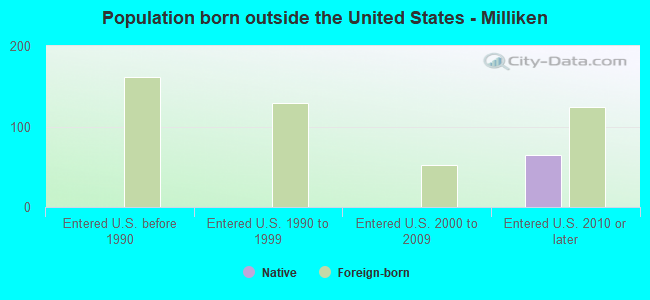
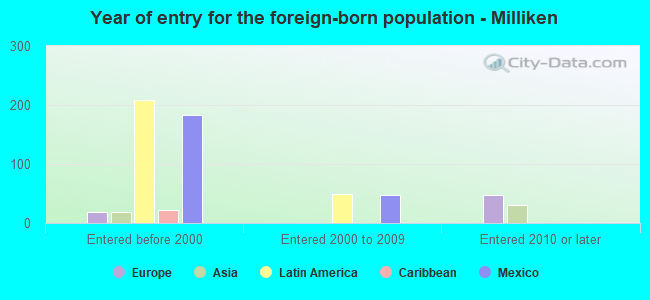
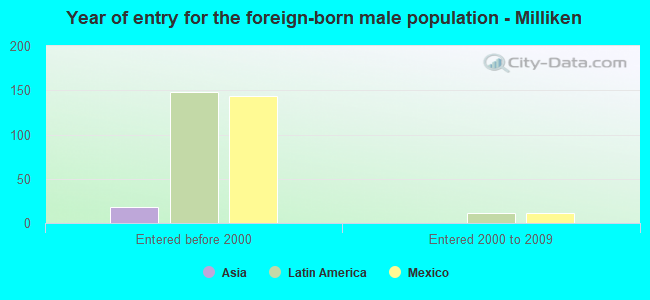
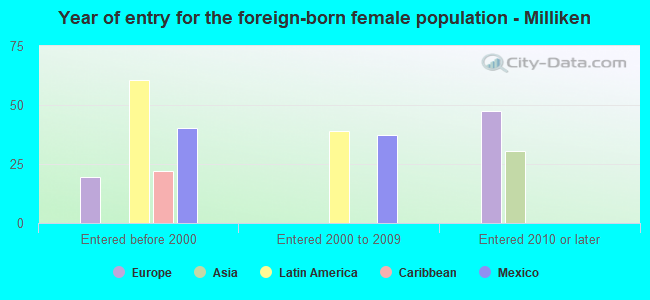
Foreign-born residents in Milliken 422 residents are foreign born (4.4% Latin America , 0.7% Europe , 0.6% Asia ).
This city:
5.4%Colorado:
100.0%
Marital status for residents in Milliken Marital status - White (Caucasian) population 15 years and over
Males 23.9% Never married58.0% Now married0.0% Separated2.0% Widowed16.1% DivorcedFemales 18.0% Never married58.9% Now married0.8% Separated7.5% Widowed14.9% DivorcedWomen who gave birth in the past 12 months Now married:
100.0% (159)Unmarried:
0.0% (0)
Women who did not give birth in the past 12 months Now married:
60.8% (883)Unmarried:
39.2% (569)
Marital status - American Indian / Alaska Native population 15 years and over
Males 0.0% Never married100.0% Now married0.0% Separated0.0% Widowed0.0% DivorcedFemales 0.0% Never married100.0% Now married0.0% Separated0.0% Widowed0.0% DivorcedWomen who did not give birth in the past 12 months Now married:
100.0% (21)Unmarried:
0.0% (0)
Marital status - Asian population 15 years and over
Males 0.0% Never married100.0% Now married0.0% Separated0.0% Widowed0.0% DivorcedFemales 0.0% Never married100.0% Now married0.0% Separated0.0% Widowed0.0% DivorcedWomen who did not give birth in the past 12 months Now married:
100.0% (27)Unmarried:
0.0% (0)
Marital status - Other race population 15 years and over
Males 28.0% Never married72.0% Now married0.0% Separated0.0% Widowed0.0% DivorcedFemales 0.0% Never married61.5% Now married0.0% Separated0.0% Widowed38.5% DivorcedMarital status - Two or more races population 15 years and over
Males 77.4% Never married9.7% Now married0.0% Separated0.0% Widowed12.9% DivorcedFemales 0.0% Never married72.1% Now married0.0% Separated0.0% Widowed27.9% DivorcedWomen who gave birth in the past 12 months Now married:
100.0% (46)Unmarried:
0.0% (0)
Women who did not give birth in the past 12 months Now married:
100.0% (72)Unmarried:
0.0% (0)
Marital status - White alone, not Hispanic / Latino population 15 years and over
Males 25.6% Never married54.2% Now married0.0% Separated0.9% Widowed19.3% DivorcedFemales 15.5% Never married59.7% Now married1.0% Separated6.1% Widowed17.8% DivorcedWomen who gave birth in the past 12 months Now married:
100.0% (174)Unmarried:
0.0% (0)
Women who did not give birth in the past 12 months Now married:
62.0% (744)Unmarried:
38.0% (456)
Marital status - Hispanic or Latino population 15 years and over
Males 16.7% Never married77.5% Now married0.0% Separated5.8% Widowed0.0% DivorcedFemales 23.4% Never married58.0% Now married0.0% Separated10.8% Widowed7.8% DivorcedWomen who did not give birth in the past 12 months Now married:
59.7% (273)Unmarried:
40.3% (185)
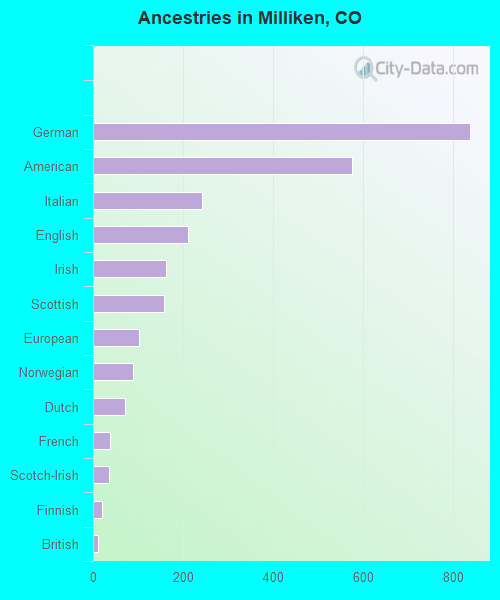
Ancestries in Milliken
696 21.7% American454 14.2% German169 5.3% Scottish159 5.0% Italian128 4.0% English122 3.8% Irish105 3.3% European23 0.7% Polish18 0.6% Norwegian18 0.6% Swedish15 0.5% British11 0.3% French11 0.3% Greek
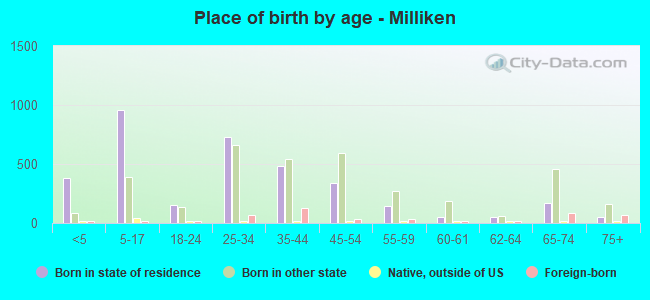
Children Nativity (place of birth) in Milliken
Children under 6 years - Living with two parents Both parents native 389 100.0% NativeBoth parents foreign-born 23 100.0% NativeOne native, one foreign-born parent 18 100.0% NativeChildren under 6 years - Living with one parent Native parent 132 100.0% NativeChildren 6 to 17 years - Living with two parents Both parents native 901 100.0% Native0 0.0% Foreign-bornBoth parents foreign-born 24 68.0% Native11 32.0% Foreign-bornOne native, one foreign-born parent 122 100.0% NativeChildren 6 to 17 years - Living with one parent Native parent 199 100.0% Native
Grandparents responsible for own grandchildren in Milliken
Grandparents (30 to 59 years) White / Caucasian 14 29.2% Responsible for grandchildren34 70.8% Not responsible for grandchildrenWhite alone, not Hispanic / Latino 14 23.3% Responsible for grandchildren46 76.7% Not responsible for grandchildren
Grandparents (60 years and over) White / Caucasian 35 100.0% Responsible for grandchildrenWhite alone, not Hispanic / Latino 45 100.0% Responsible for grandchildren