Races in Molitor, Wisconsin (WI) Detailed Stats
Ancestries, Foreign-born residents, place of birth
Race distribution in Molitor

- 25998.5%White alone
- 20.8%Hispanic
- 10.4%Two or more races
- 10.4%American Indian alone
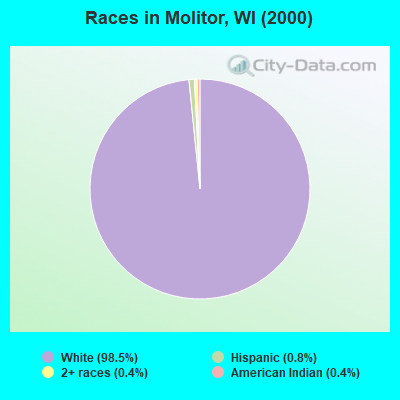
2000
2022
-
- 4,681,63087.3%White alone
- 300,2455.6%Black alone
- 192,9213.6%Hispanic
- 87,9951.6%Asian alone
- 51,9211.0%Two or more races
- 43,9800.8%American Indian alone
- 3,6370.07%Other race alone
- 1,3460.03%Native Hawaiian and Other
Pacific Islander alone

-
- 4,654,03179.0%White alone
- 447,0227.6%Hispanic
- 345,6785.9%Black alone
- 217,5323.7%Two or more races
- 172,2422.9%Asian alone
- 33,7620.6%American Indian alone
- 19,6800.3%Other race alone
- 2,5920.04%Native Hawaiian and Other
Pacific Islander alone

Income and house value in Molitor
- Median household income in 2022
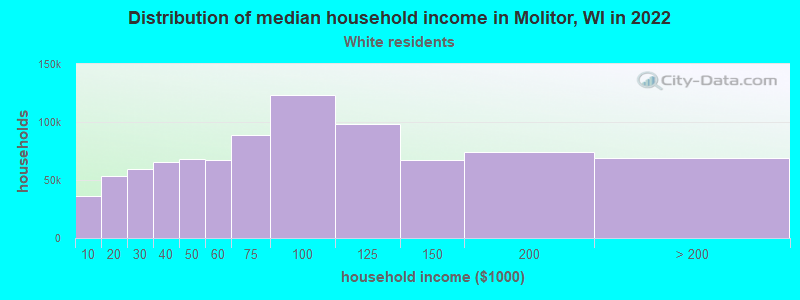
- $63,460White non-Hispanic householders
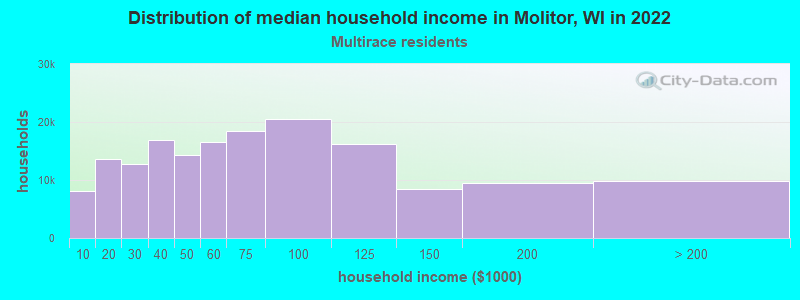
- $153,728Two or more races householders
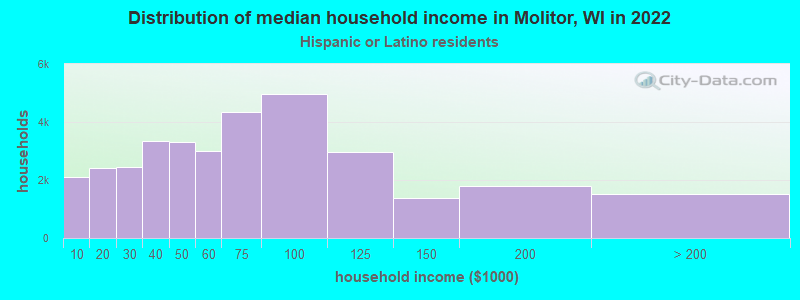
- $30,983Hispanic or Latino race householders
- Median 2022 house value
- $225,364White Non-Hispanic householders
- $105,310Hispanic or Latino householders
Household income for White non-Hispanic householders
Household income for Two or more races householders
Household income for Hispanic or Latino race householders
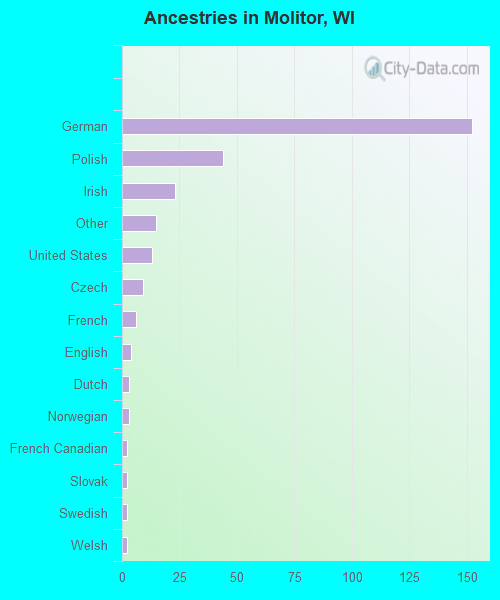
Ancestries in Molitor

- 15254.3%German
- 4415.7%Polish
- 238.2%Irish
- 155.4%Other
- 134.6%United States
- 93.2%Czech
- 62.1%French
- 41.4%English
- 31.1%Dutch
- 31.1%Norwegian
- 20.7%French Canadian
- 20.7%Slovak
- 20.7%Swedish
- 20.7%Welsh
Zip codes: 54451.