Races in Montville, Connecticut (CT) Detailed Stats
Ancestries, Foreign-born residents, place of birth
4.7% of Montville, CT residents are foreign-born (1.8% born in Europe, 1.7% born in Asia, 0.9% born in Latin America), which is 216.1% less than the foreign-born rate of 15.0% across the entire state of Connecticut.
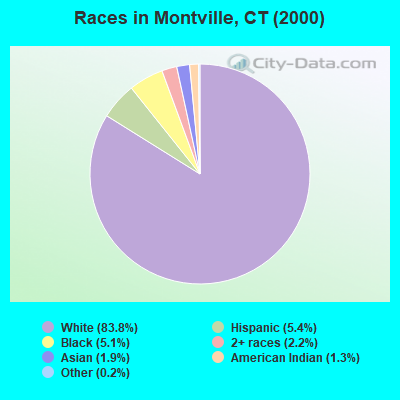
Race distribution in Montville

- 15,54483.8%White alone
- 1,0105.4%Hispanic
- 9495.1%Black alone
- 4112.2%Two or more races
- 3491.9%Asian alone
- 2501.3%American Indian alone
- 280.2%Other race alone
- 50.03%Native Hawaiian and Other
Pacific Islander alone
2000
2022
-
- 2,638,84577.5%White alone
- 320,3239.4%Hispanic
- 295,5718.7%Black alone
- 81,5642.4%Asian alone
- 52,8961.6%Two or more races
- 8,1410.2%Other race alone
- 7,2670.2%American Indian alone
- 9580.03%Native Hawaiian and Other
Pacific Islander alone

-
- 2,246,91362.0%White alone
- 658,97818.2%Hispanic
- 353,9739.8%Black alone
- 172,9294.8%Asian alone
- 159,6314.4%Two or more races
- 29,7610.8%Other race alone
- 3,4280.09%American Indian alone
- 5920.02%Native Hawaiian and Other
Pacific Islander alone

Income and house value in Montville
- Median household income in 2022
- $90,689White non-Hispanic householders
- $109,489Black householders
- $81,570American Indian and Alaska Native householders
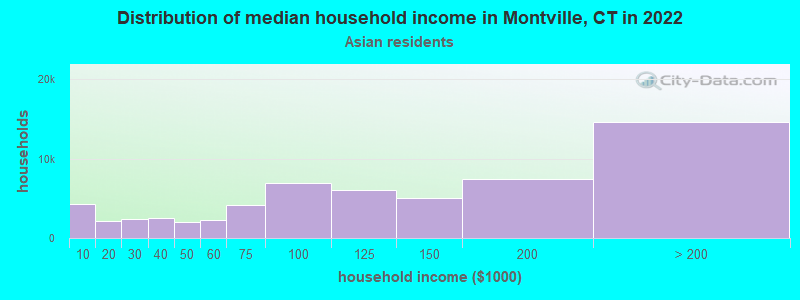
- $118,588Asian householders
- $138,045Some other race householders
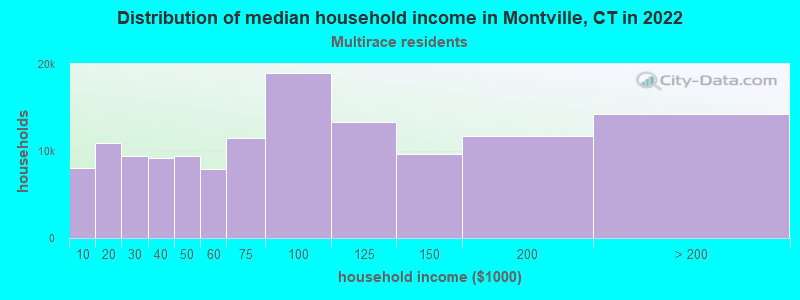
- $83,245Two or more races householders
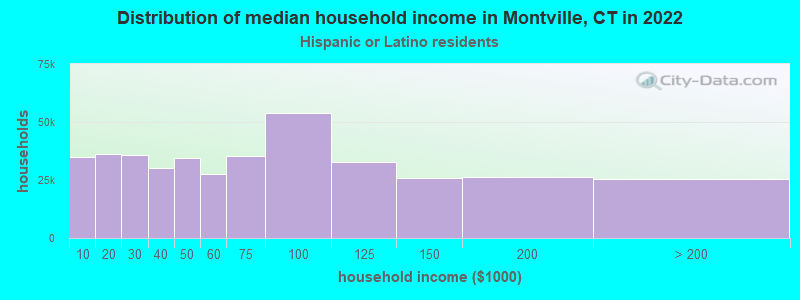
- $105,440Hispanic or Latino race householders
- Median 2022 house value
- $270,668White Non-Hispanic householders
- $258,562Black or African American householders
- $348,280American Indian or Alaska Native householders
- $303,313Asian householders
- $305,475Some other race householders
- $262,886Two or more races householders
- $286,450Hispanic or Latino householders
Household income for White non-Hispanic householders
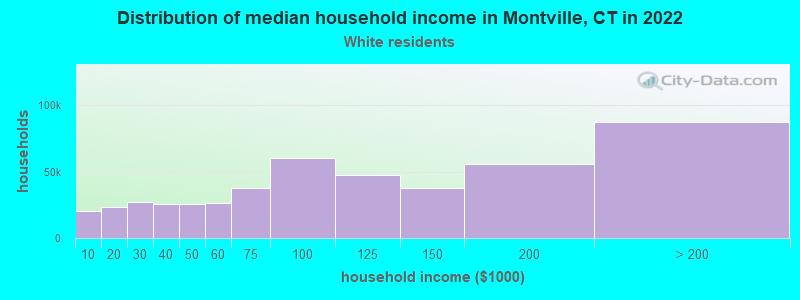
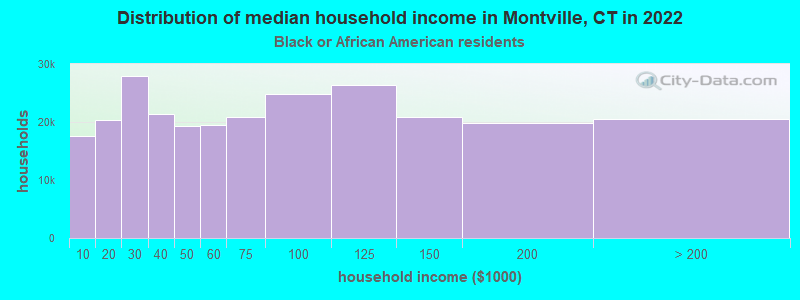
Household income for Black householders
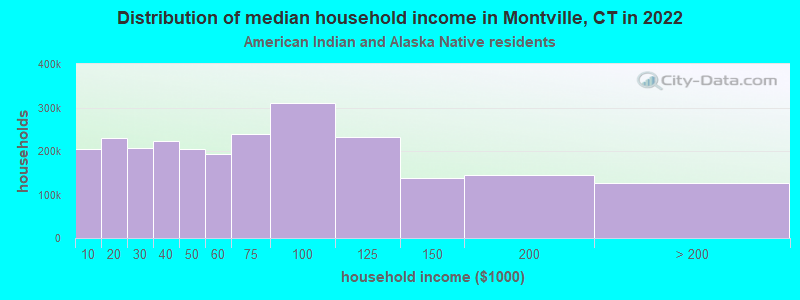
Household income for American Indian and Alaska Native householders
Household income for Asian householders
Household income for Two or more races householders
Household income for Hispanic or Latino race householders
Foreign-born residents in Montville
880 residents are foreign born (1.8% Europe, 1.7% Asia, 0.9% Latin America).
| This city: | 4.7% |
| Connecticut: | 10.9% |
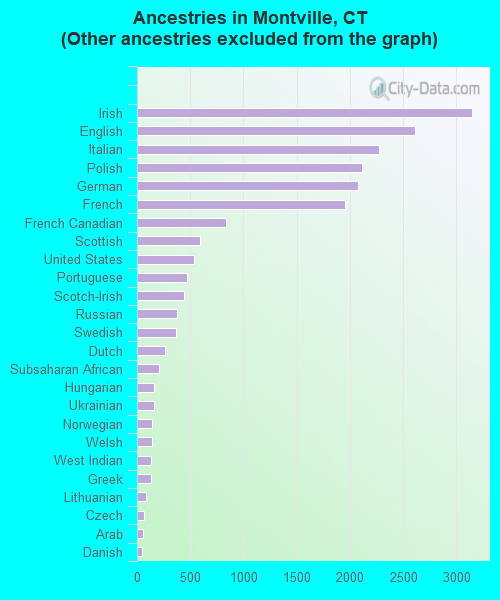
Ancestries in Montville

- 3,19614.1%Other
- 3,14813.9%Irish
- 2,61211.5%English
- 2,27610.1%Italian
- 2,1179.4%Polish
- 2,0739.2%German
- 1,9538.6%French
- 8343.7%French Canadian
- 5922.6%Scottish
- 5322.4%United States
- 4672.1%Portuguese
- 4432.0%Scotch-Irish
- 3801.7%Russian
- 3671.6%Swedish
- 2651.2%Dutch
- 2070.9%Subsaharan African
- 1620.7%Hungarian
- 1590.7%Ukrainian
- 1450.6%Norwegian
- 1440.6%Welsh
- 1320.6%West Indian
- 1270.6%Greek
- 820.4%Lithuanian
- 660.3%Czech
- 550.2%Arab
- 450.2%Danish
- 420.2%Slovak
- 120.05%Swiss
Zip codes: 06370.