Races in Moreau, New York (NY) Detailed Stats
Ancestries, Foreign-born residents, place of birth
2.0% of Moreau, NY residents are foreign-born , which is 1018.3% less than the foreign-born rate of 22.0% across the entire state of New York.
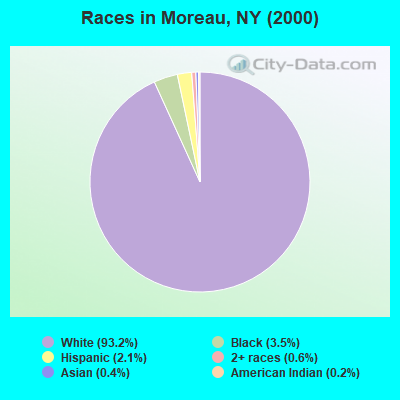
Race distribution in Moreau

- 12,89093.2%White alone
- 4793.5%Black alone
- 2892.1%Hispanic
- 840.6%Two or more races
- 520.4%Asian alone
- 270.2%American Indian alone
- 30.02%Other race alone
- 20.01%Native Hawaiian and Other
Pacific Islander alone
2000
2022
-
- 11,760,98162.0%White alone
- 2,867,58315.1%Hispanic
- 2,812,62314.8%Black alone
- 1,035,9265.5%Asian alone
- 366,1161.9%Two or more races
- 75,4990.4%Other race alone
- 52,4990.3%American Indian alone
- 5,2300.03%Native Hawaiian and Other
Pacific Islander alone

-
- 10,408,93352.9%White alone
- 3,867,29919.7%Hispanic
- 2,633,84013.4%Black alone
- 1,776,2869.0%Asian alone
- 732,6703.7%Two or more races
- 216,1101.1%Other race alone
- 35,0820.2%American Indian alone
- 6,9310.04%Native Hawaiian and Other
Pacific Islander alone

Income and house value in Moreau
- Median household income in 2022
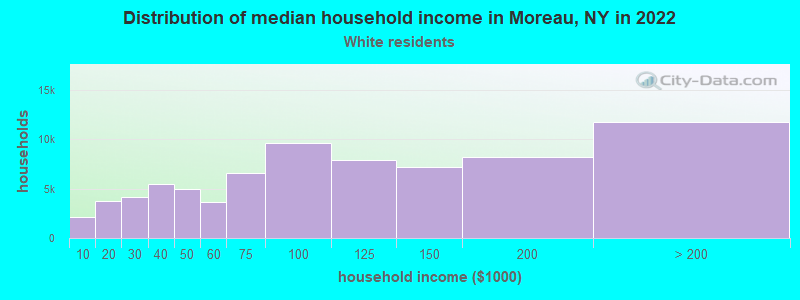
- $75,741White non-Hispanic householders
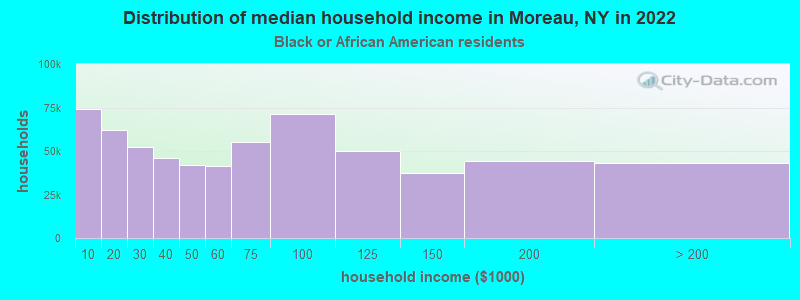
- $75,206Black householders
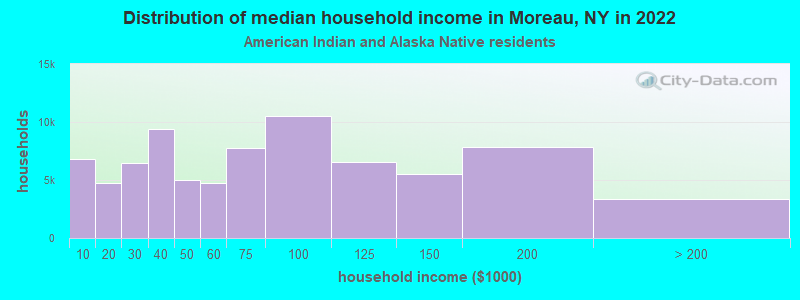
- over $200,000American Indian and Alaska Native householders
- $57,083Two or more races householders
- $47,688Hispanic or Latino race householders
- Median 2022 house value
- $282,165White Non-Hispanic householders
- $287,615Black or African American householders
- $257,340American Indian or Alaska Native householders
- $220,404Two or more races householders
- $214,046Hispanic or Latino householders
Household income for White non-Hispanic householders
Household income for Black householders
Household income for American Indian and Alaska Native householders
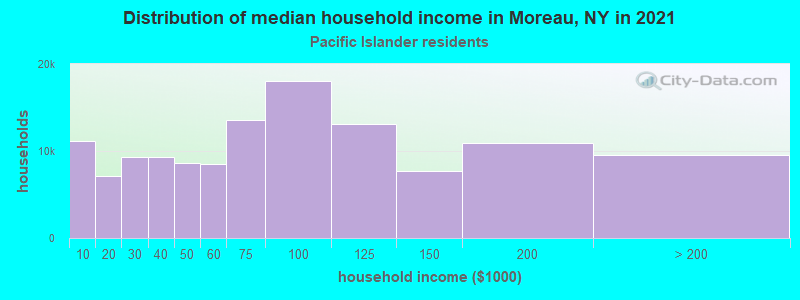
Household income for Native Hawaiian and other Pacific Islander householders
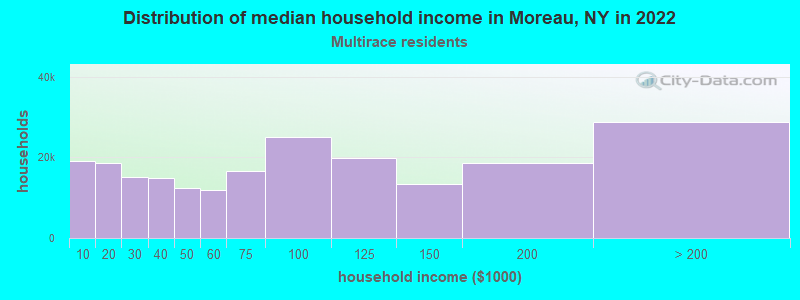
Household income for Two or more races householders
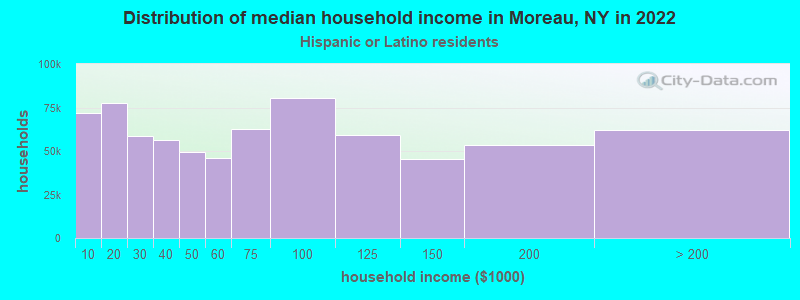
Household income for Hispanic or Latino race householders
Foreign-born residents in Moreau
272 residents are foreign born
| This city: | 2.0% |
| New York: | 20.4% |
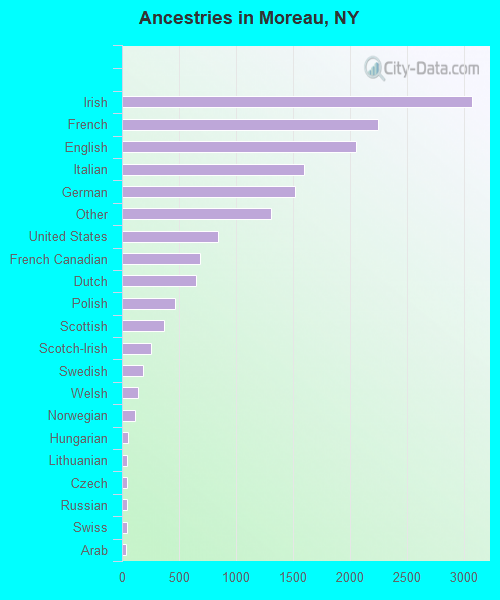
Ancestries in Moreau

- 3,06719.4%Irish
- 2,24814.2%French
- 2,05413.0%English
- 1,59810.1%Italian
- 1,5179.6%German
- 1,3098.3%Other
- 8395.3%United States
- 6844.3%French Canadian
- 6504.1%Dutch
- 4612.9%Polish
- 3702.3%Scottish
- 2551.6%Scotch-Irish
- 1881.2%Swedish
- 1390.9%Welsh
- 1110.7%Norwegian
- 490.3%Hungarian
- 430.3%Lithuanian
- 420.3%Czech
- 400.3%Russian
- 400.3%Swiss
- 350.2%Arab
- 150.10%Slovak
- 150.10%Ukrainian
- 60.04%Greek
- 60.04%Portuguese
- 60.04%Subsaharan African
Zip codes: 12803.