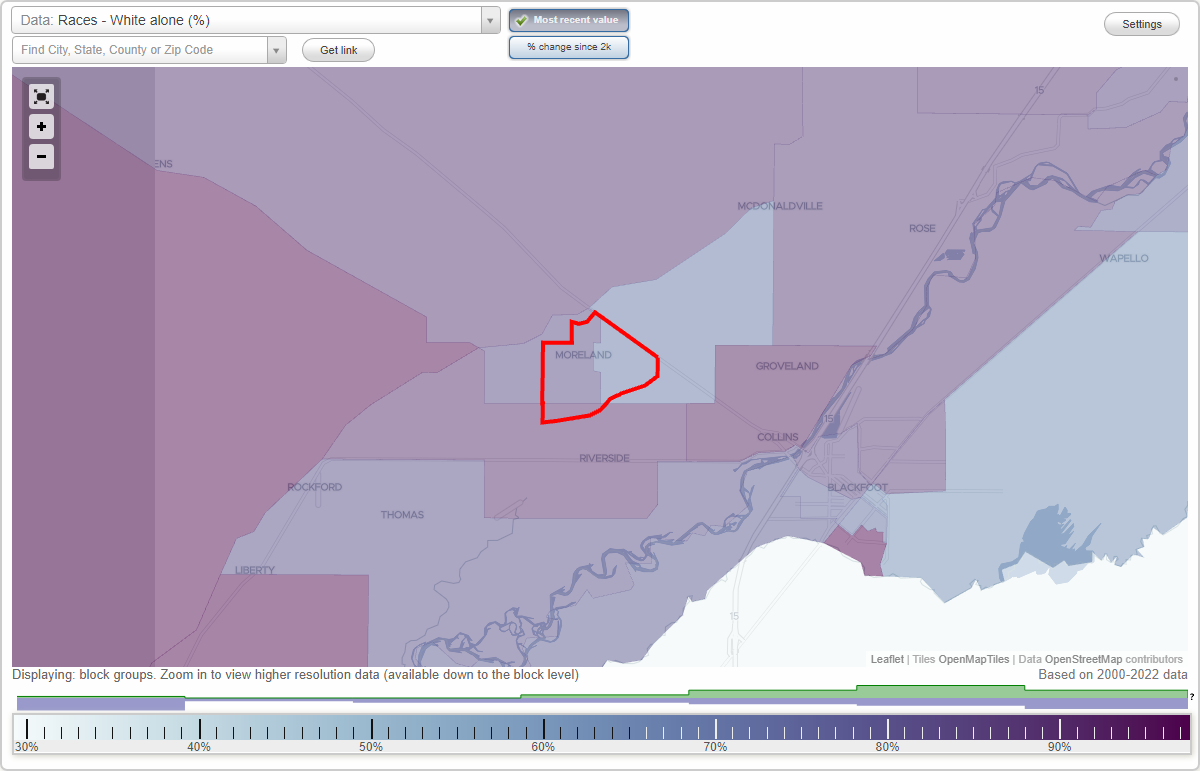
Races in Moreland, Idaho (ID) Detailed Stats
Ancestries, Foreign-born residents, place of birth
Data:
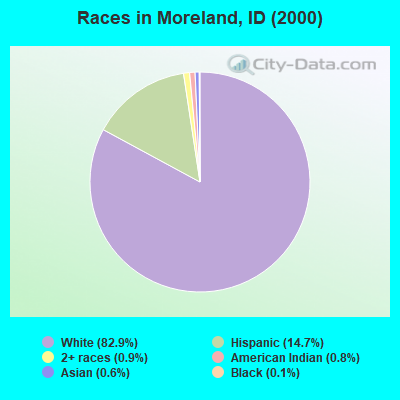
Race distribution in Moreland

- 7,62582.9%White alone
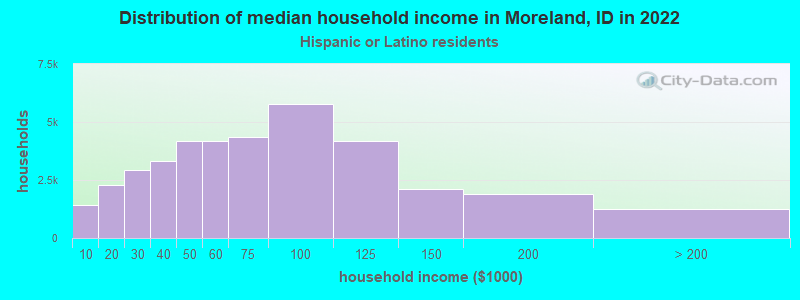
- 1,34914.7%Hispanic
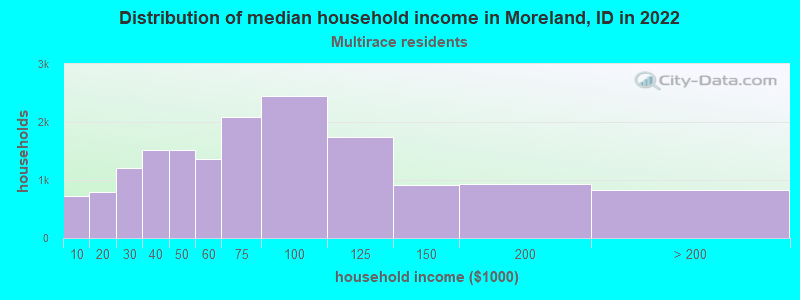
- 800.9%Two or more races
- 710.8%American Indian alone
- 530.6%Asian alone
- 130.1%Black alone
- 40.04%Other race alone
- 20.02%Native Hawaiian and Other
Pacific Islander alone
2000
2022
-
- 1,139,29188.0%White alone
- 101,6907.9%Hispanic
- 18,2611.4%Two or more races
- 15,7891.2%American Indian alone
- 11,6410.9%Asian alone
- 4,8890.4%Black alone
- 1,1920.09%Other race alone
- 1,2000.09%Native Hawaiian and Other
Pacific Islander alone
-
- 1,531,21979.0%White alone
- 261,92113.5%Hispanic
- 81,1124.2%Two or more races
- 25,1741.3%Asian alone
- 15,8250.8%American Indian alone
- 11,8680.6%Black alone
- 8,7520.5%Other race alone
- 3,1620.2%Native Hawaiian and Other
Pacific Islander alone
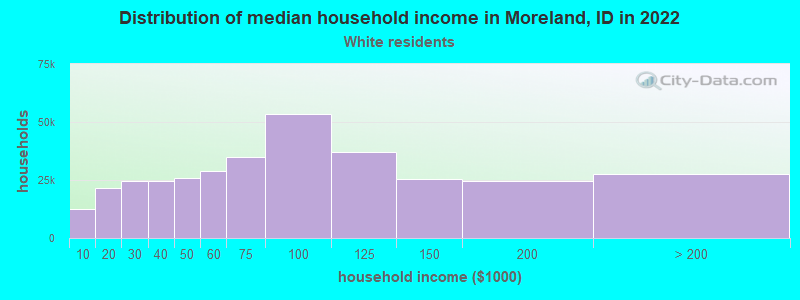
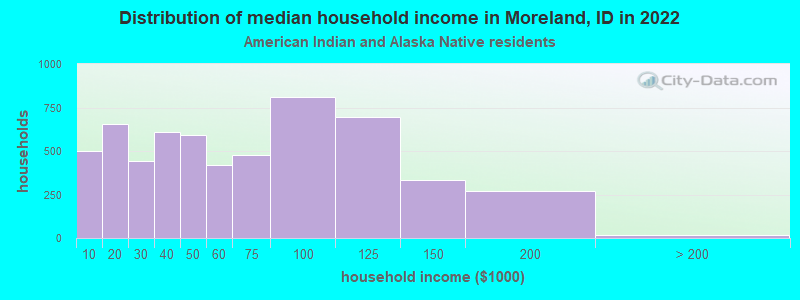
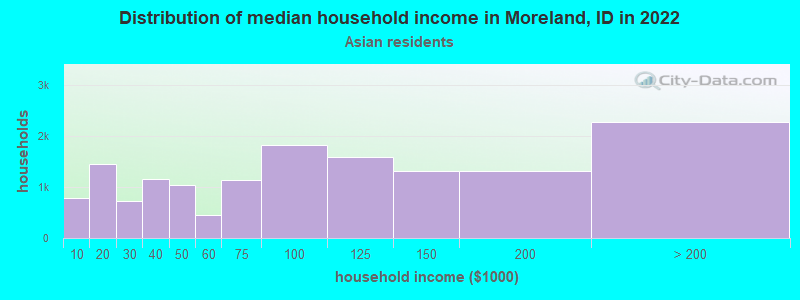
Income and house value in Moreland
- Median household income in 2022
- $82,580White non-Hispanic householders
- $78,578American Indian and Alaska Native householders
- $165,382Asian householders
- $66,454Some other race householders
- $41,380Two or more races householders
- $69,257Hispanic or Latino race householders
- Median 2022 house value
- $362,089White Non-Hispanic householders
- $505,968Asian householders
- $269,359Some other race householders
- $266,783Hispanic or Latino householders