Races in Morristown, Vermont (VT) Detailed Stats
Ancestries, Foreign-born residents, place of birth

Recent posts about races in Morristown, Vermont on our local forum with over 2,400,000 registered users:
 | Communities or not? (43 replies) |
| Haunted Houses In Vt (93 replies) |
| Is Vermont a good choice, or is New Hampshire better? (18 replies) |
| Here we go again Vermont.... (16 replies) |
| Thoughts on Morrisville VT? (6 replies) |
| Official Vermont Picture Thread (966 replies) |
2.3% of Morristown, VT residents are foreign-born (1.1% born in North America, 1.0% born in Europe), which is 72.7% less than the foreign-born rate of 4.0% across the entire state of Vermont.
Race distribution in Morristown

- 4,97996.9%White alone
- 601.2%Two or more races
- 400.8%Hispanic
- 240.5%Asian alone
- 180.4%Black alone
- 180.4%American Indian alone
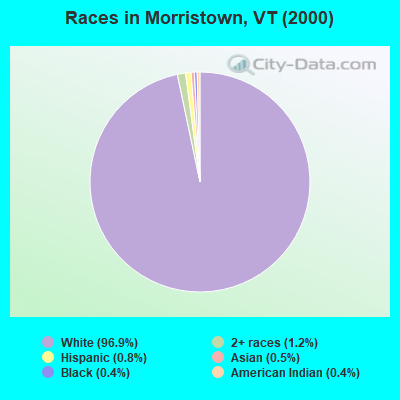
2000
2022
-
- 585,43196.2%White alone
- 6,8091.1%Two or more races
- 5,5040.9%Hispanic
- 5,1600.8%Asian alone
- 2,9210.5%Black alone
- 2,3250.4%American Indian alone
- 5570.09%Other race alone
- 1200.02%Native Hawaiian and Other
Pacific Islander alone

-
- 583,54690.2%White alone
- 27,3404.2%Two or more races
- 14,7702.3%Hispanic
- 11,5121.8%Asian alone
- 6,2641.0%Black alone
- 2,5210.4%Other race alone
- 1,0520.2%American Indian alone
- 590.01%Native Hawaiian and Other
Pacific Islander alone

Income and house value in Morristown
- Median household income in 2022
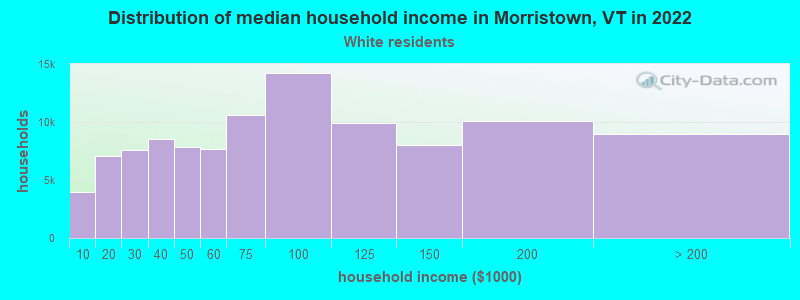
- $59,775White non-Hispanic householders
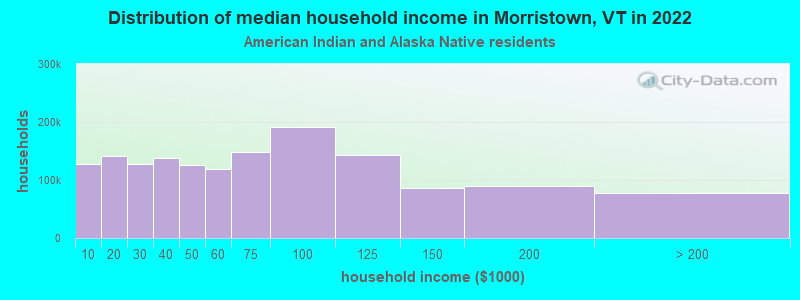
- $132,800American Indian and Alaska Native householders
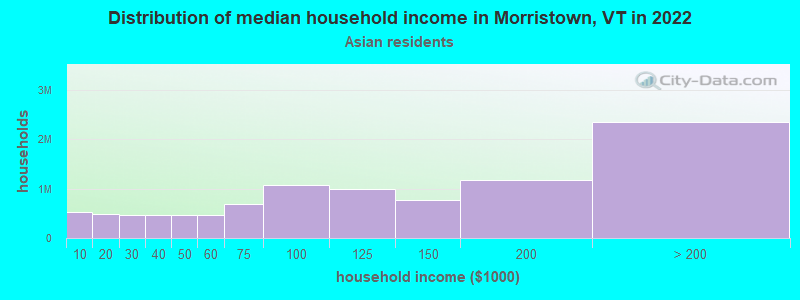
- $134,876Asian householders
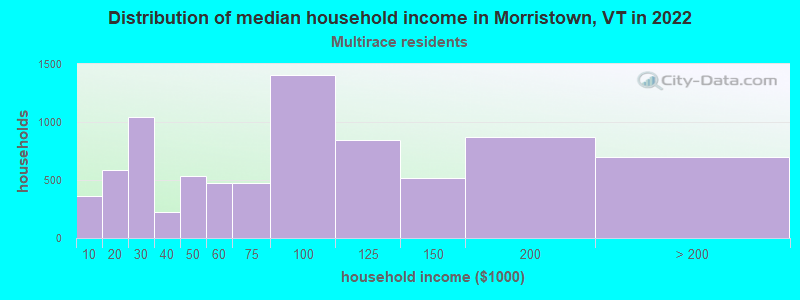
- $38,670Two or more races householders
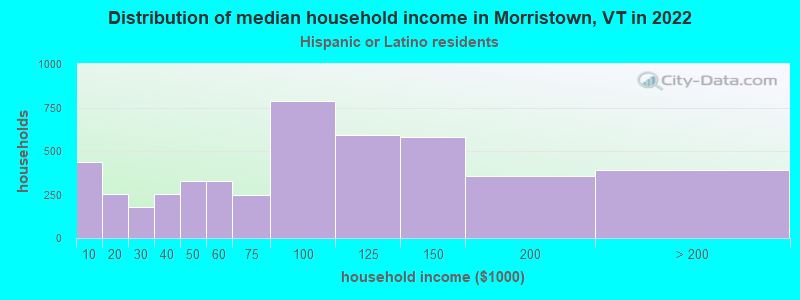
- $72,033Hispanic or Latino race householders
- Median 2022 house value
- $278,182White Non-Hispanic householders
- $156,692American Indian or Alaska Native householders
- $363,940Asian householders
Household income for White non-Hispanic householders
Household income for American Indian and Alaska Native householders
Household income for Asian householders
Household income for Two or more races householders
Household income for Hispanic or Latino race householders
Foreign-born residents in Morristown
119 residents are foreign born (1.1% North America, 1.0% Europe).
| This city: | 2.3% |
| Vermont: | 3.8% |
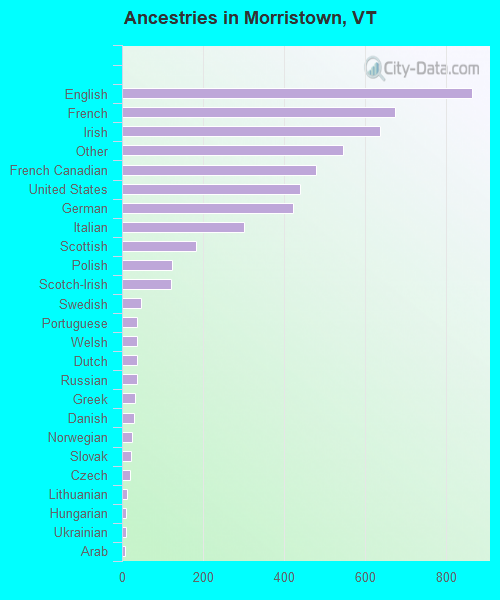
Ancestries in Morristown

- 86316.7%English
- 67413.1%French
- 63812.4%Irish
- 54510.6%Other
- 4789.3%French Canadian
- 4408.5%United States
- 4228.2%German
- 3015.8%Italian
- 1823.5%Scottish
- 1232.4%Polish
- 1212.3%Scotch-Irish
- 470.9%Swedish
- 380.7%Portuguese
- 370.7%Welsh
- 360.7%Dutch
- 360.7%Russian
- 320.6%Greek
- 290.6%Danish
- 250.5%Norwegian
- 220.4%Slovak
- 200.4%Czech
- 130.3%Lithuanian
- 110.2%Hungarian
- 110.2%Ukrainian
- 80.2%Arab
- 80.2%Swiss
- 20.04%West Indian
Zip codes: 05661.