Races in Moultonborough, New Hampshire (NH) Detailed Stats
Ancestries, Foreign-born residents, place of birth

Recent posts about races in Moultonborough, New Hampshire on our local forum with over 2,400,000 registered users:
 | NH towns to house shop tomorrow (14 replies) |
| Restaurant suggestions near the Lake Region? (15 replies) |
| Moving from Va to NH looking for some advice :) (32 replies) |
| Move to NH from FL, advice/opinions/suggestions wanted! (75 replies) |
| Meredith NH - Other Towns? (30 replies) |
| NH for retirement - Insight Please... (65 replies) |
Latest news about races in Moultonborough, NH collected exclusively by city-data.com from local newspapers, TV, and radio stations
3.5% of Moultonborough, NH residents are foreign-born (2.4% born in Europe, 0.8% born in North America), which is 41.9% less than the foreign-born rate of 5.0% across the entire state of New Hampshire.
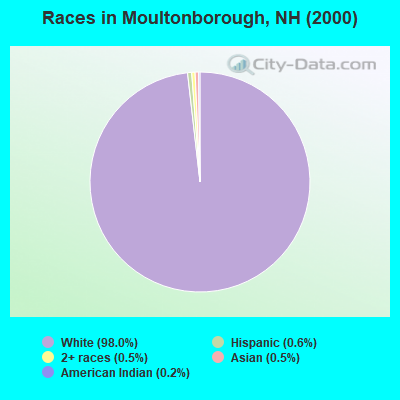
Race distribution in Moultonborough

- 4,39698.0%White alone
- 280.6%Hispanic
- 240.5%Two or more races
- 230.5%Asian alone
- 90.2%American Indian alone
- 40.09%Black alone
2000
2022
-
- 1,175,25295.1%White alone
- 20,4891.7%Hispanic
- 15,8031.3%Asian alone
- 11,6060.9%Two or more races
- 8,3540.7%Black alone
- 2,6980.2%American Indian alone
- 1,2540.1%Other race alone
- 3300.03%Native Hawaiian and Other
Pacific Islander alone

-
- 1,208,10186.6%White alone
- 63,4794.5%Hispanic
- 60,7244.4%Two or more races
- 36,5192.6%Asian alone
- 17,9311.3%Black alone
- 6,6150.5%Other race alone
- 1,0140.07%American Indian alone
- 8480.06%Native Hawaiian and Other
Pacific Islander alone

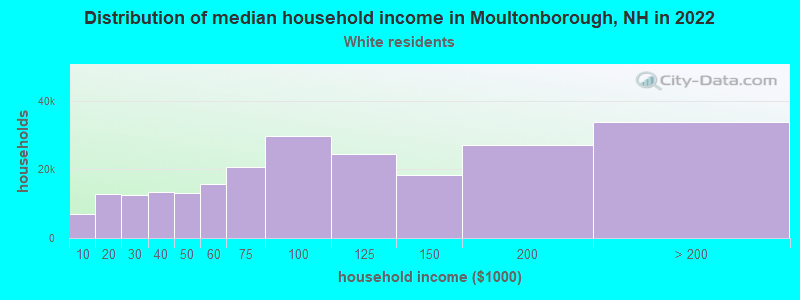
Income and house value in Moultonborough
- Median household income in 2022
- $87,314White non-Hispanic householders
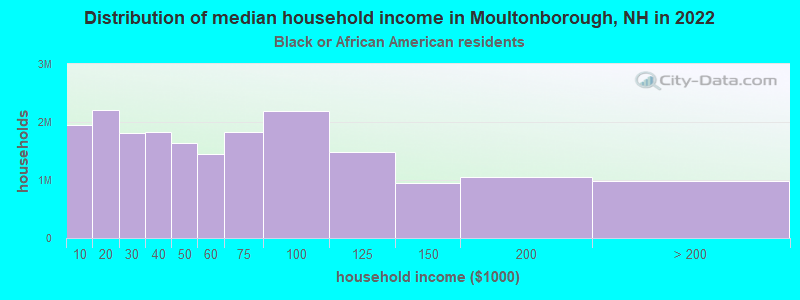
- $51,776Black householders
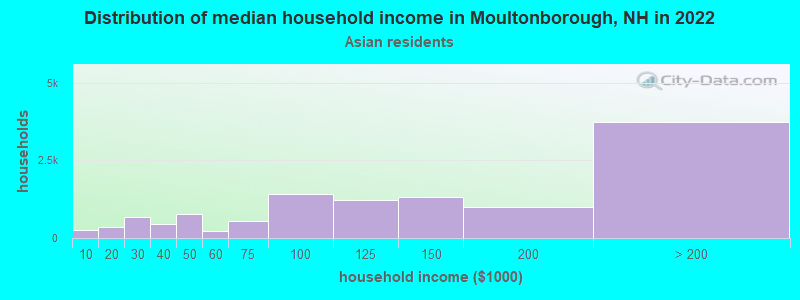
- $114,823Asian householders
- $79,866Two or more races householders
- $28,429Hispanic or Latino race householders
- Median 2022 house value
- $482,154White Non-Hispanic householders
- $198,858Black or African American householders
- $841,323Asian householders
- $841,323Two or more races householders
Household income for White non-Hispanic householders
Household income for Black householders
Household income for Asian householders
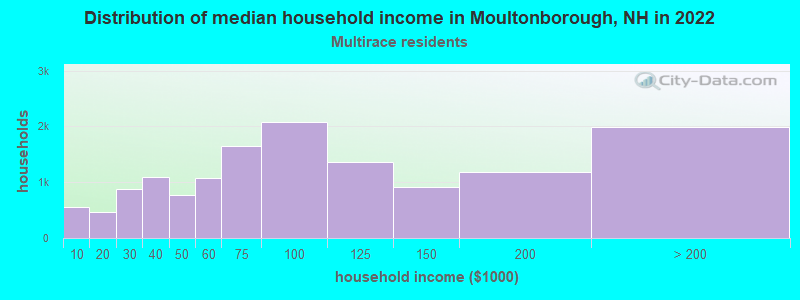
Household income for Two or more races householders
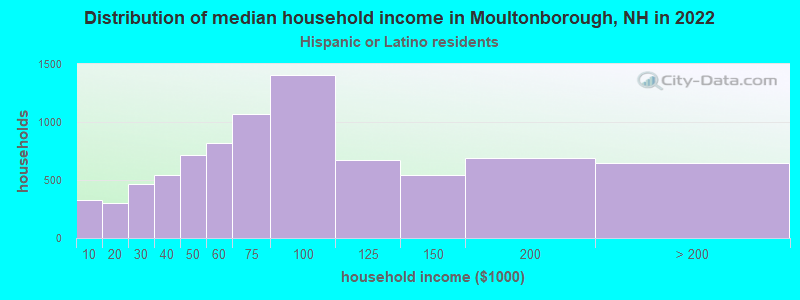
Household income for Hispanic or Latino race householders
Foreign-born residents in Moultonborough
158 residents are foreign born (2.4% Europe, 0.8% North America).
| This city: | 3.5% |
| New Hampshire: | 4.4% |
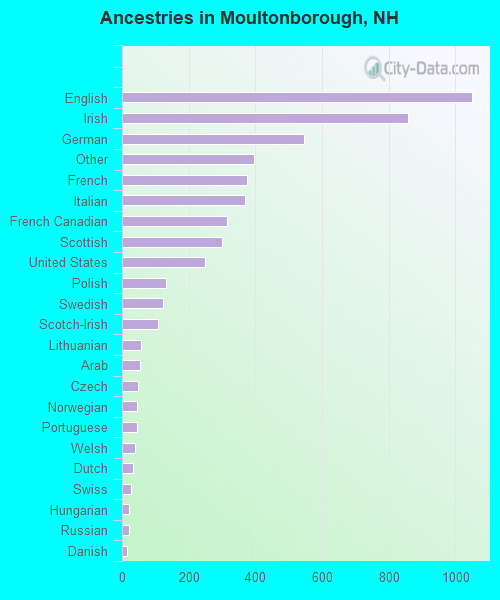
Ancestries in Moultonborough

- 1,04920.0%English
- 85716.4%Irish
- 54510.4%German
- 3957.5%Other
- 3767.2%French
- 3687.0%Italian
- 3166.0%French Canadian
- 3015.7%Scottish
- 2494.8%United States
- 1322.5%Polish
- 1242.4%Swedish
- 1082.1%Scotch-Irish
- 581.1%Lithuanian
- 541.0%Arab
- 470.9%Czech
- 450.9%Norwegian
- 440.8%Portuguese
- 380.7%Welsh
- 340.6%Dutch
- 280.5%Swiss
- 200.4%Hungarian
- 200.4%Russian
- 150.3%Danish
- 90.2%Ukrainian
- 70.1%Greek
Zip codes: 03254.