Races in Munson-McLellen, Florida (FL) Detailed Stats
Ancestries, Foreign-born residents, place of birth
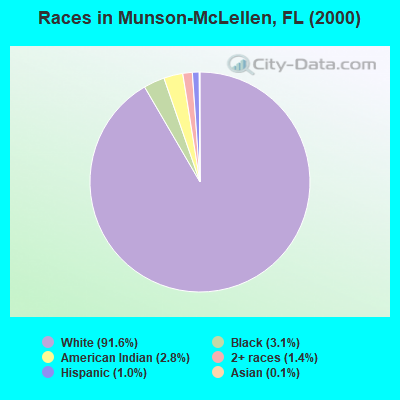
Race distribution in Munson-McLellen

- 3,31091.6%White alone
- 1113.1%Black alone
- 1002.8%American Indian alone
- 501.4%Two or more races
- 351.0%Hispanic
- 40.1%Asian alone
- 10.03%Other race alone
- 10.03%Native Hawaiian and Other
Pacific Islander alone
2000
2022
-
- 10,458,50965.4%White alone
- 2,682,71516.8%Hispanic
- 2,264,26814.2%Black alone
- 261,6931.6%Asian alone
- 236,9541.5%Two or more races
- 42,3580.3%American Indian alone
- 28,9940.2%Other race alone
- 6,8870.04%Native Hawaiian and Other
Pacific Islander alone

-
- 11,309,40350.8%White alone
- 6,025,03927.1%Hispanic
- 3,241,01514.6%Black alone
- 861,6303.9%Two or more races
- 623,6922.8%Asian alone
- 152,0540.7%Other race alone
- 22,5040.1%American Indian alone
- 9,4860.04%Native Hawaiian and Other
Pacific Islander alone

Income and house value in Munson-McLellen
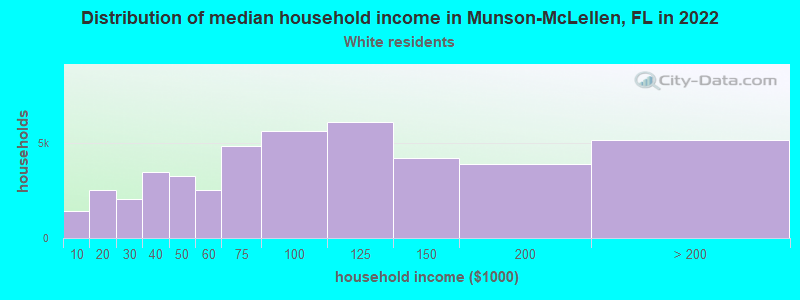
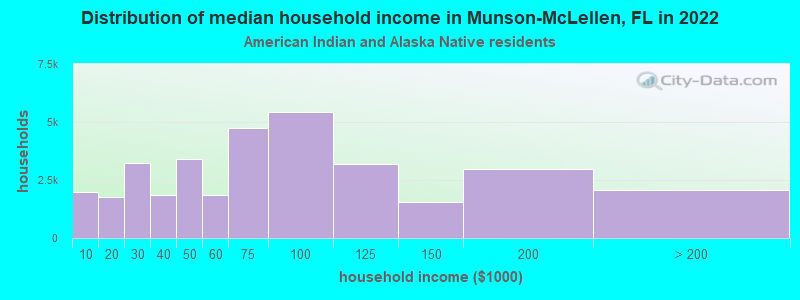
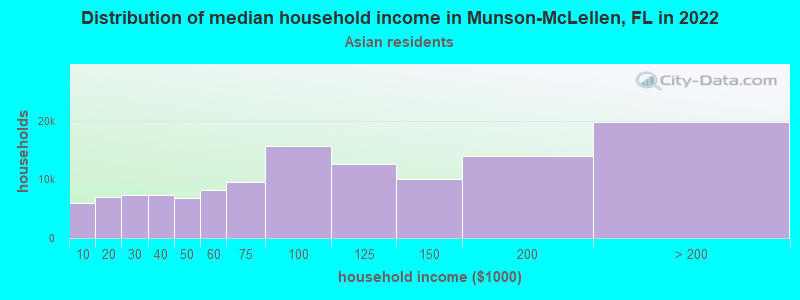
- Median household income in 2022
- $62,646White non-Hispanic householders
- $127,411American Indian and Alaska Native householders
- $114,551Asian householders
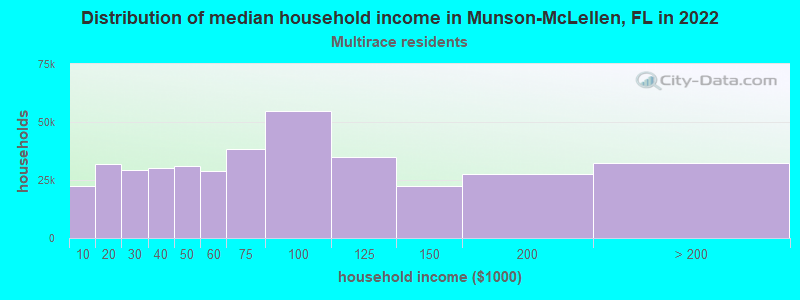
- $41,483Two or more races householders
- Median 2022 house value
- $238,276White Non-Hispanic householders
- $326,778American Indian or Alaska Native householders
- $382,943Asian householders
- $553,141Two or more races householders
Household income for White non-Hispanic householders
Household income for American Indian and Alaska Native householders
Household income for Asian householders
Household income for Two or more races householders
Zip code: 32570