Races in New Bern, North Carolina (NC) Detailed Stats
Data:
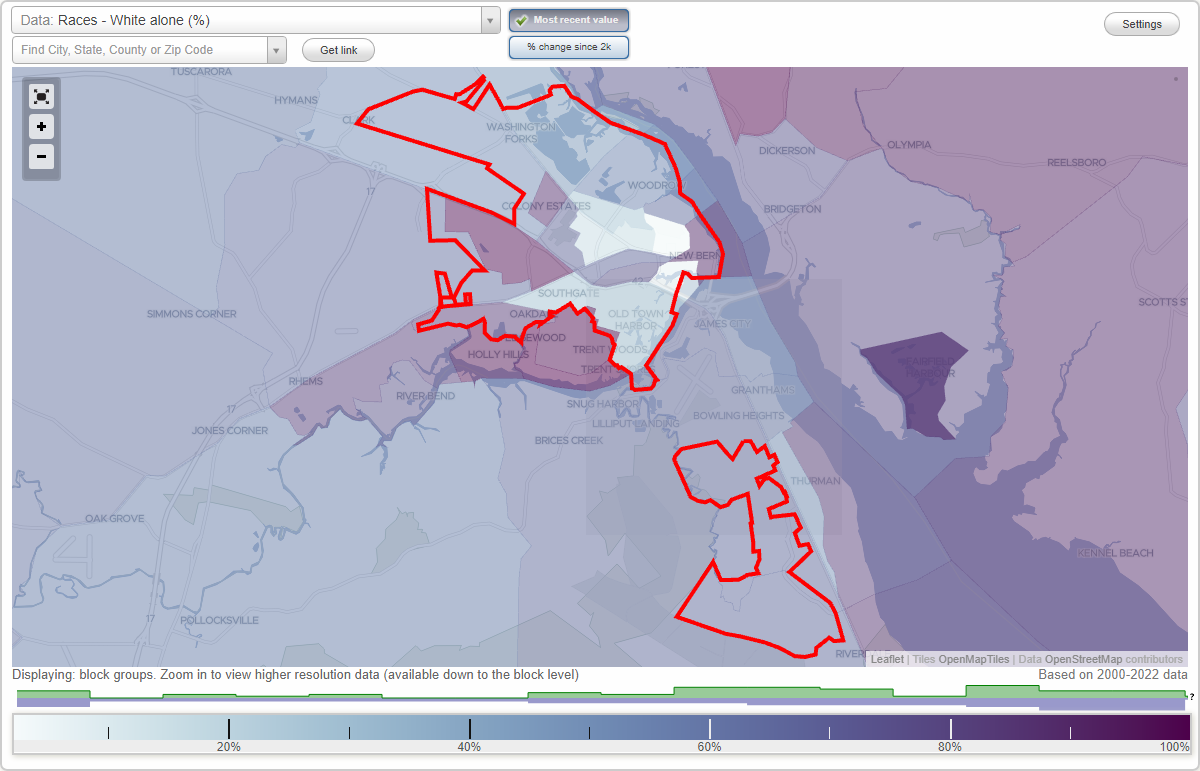
Races - White alone (%)
Races - White alone (% change since 2000)
Races - Black alone (%)
Races - Black alone (% change since 2000)
Races - American Indian alone (%)
Races - American Indian alone (% change since 2000)
Races - Asian alone (%)
Races - Asian alone (% change since 2000)
Races - Hispanic (%)
Races - Hispanic (% change since 2000)
Races - Native Hawaiian and Other Pacific Islander alone (%)
Races - Native Hawaiian and Other Pacific Islander alone (% change since 2000)
Races - Two or more races(%)
Races - Two or more races(% change since 2000)
Races - Other race alone (%)
Races - Other race alone (% change since 2000)
Racial diversity
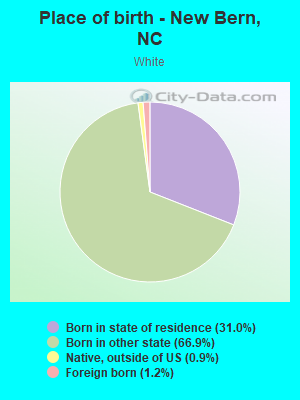
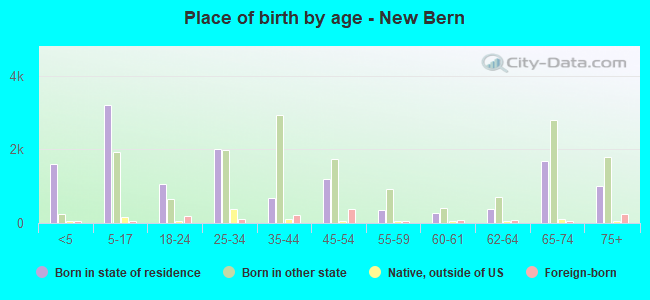
Place of birth - Born in state of residence (%)
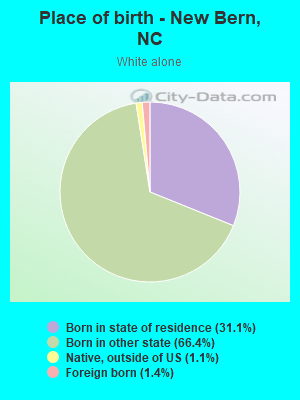
Place of birth - Born in state of residence (%) - White
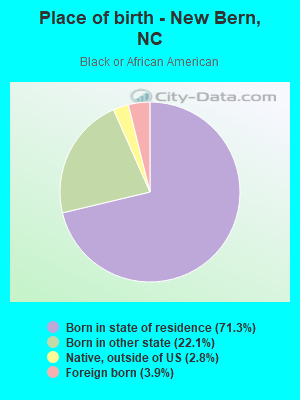
Place of birth - Born in state of residence (%) - Black or African American
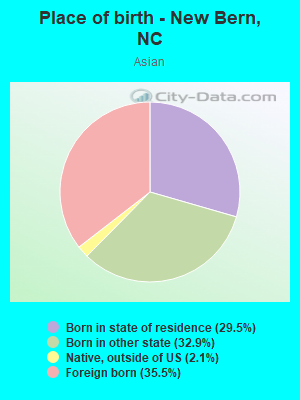
Place of birth - Born in state of residence (%) - Asian
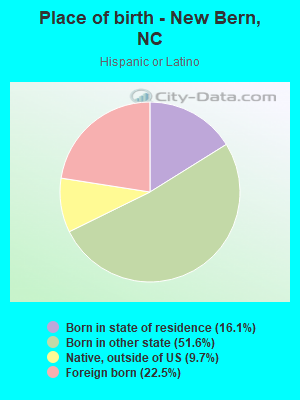
Place of birth - Born in state of residence (%) - Hispanic or Latino
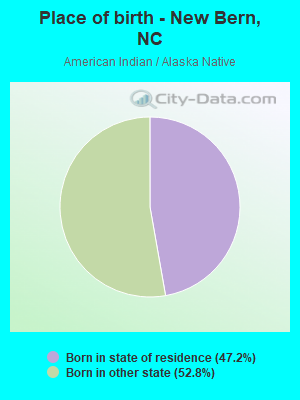
Place of birth - Born in state of residence (%) - American Indian and Alaska Native
Place of birth - Born in state of residence (%) - Multirace
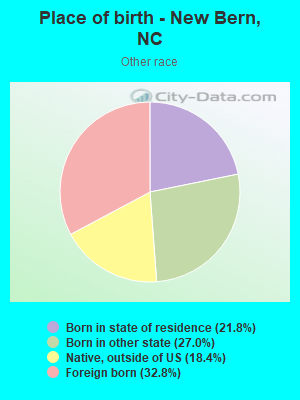
Place of birth - Born in state of residence (%) - Other Race
Place of birth - Born in other state (%)
Place of birth - Born in other state (%) - White
Place of birth - Born in other state (%) - Black or African American
Place of birth - Born in other state (%) - Asian
Place of birth - Born in other state (%) - Hispanic or Latino
Place of birth - Born in other state (%) - American Indian and Alaska Native
Place of birth - Born in other state (%) - Multirace
Place of birth - Born in other state (%) - Other Race
Place of birth - Native, outside of US (%)
Place of birth - Native, outside of US (%) - White
Place of birth - Native, outside of US (%) - Black or African American
Place of birth - Native, outside of US (%) - Asian
Place of birth - Native, outside of US (%) - Hispanic or Latino
Place of birth - Native, outside of US (%) - American Indian and Alaska Native
Place of birth - Native, outside of US (%) - Multirace
Place of birth - Native, outside of US (%) - Other Race
Place of birth - Foreign born (%)
Place of birth - Foreign born (%) - White
Place of birth - Foreign born (%) - Black or African American
Place of birth - Foreign born (%) - Asian
Place of birth - Foreign born (%) - Hispanic or Latino
Place of birth - Foreign born (%) - American Indian and Alaska Native
Place of birth - Foreign born (%) - Multirace
Place of birth - Foreign born (%) - Other Race
Residents speaking English at home (%)
Residents speaking English at home - Born in the United States (%)
Residents speaking English at home - Native, born elsewhere (%)
Residents speaking English at home - Foreign born (%)
Residents speaking Spanish at home (%)
Residents speaking Spanish at home - Born in the United States (%)
Residents speaking Spanish at home - Native, born elsewhere (%)
Residents speaking Spanish at home - Foreign born (%)
Residents speaking other language at home (%)
Residents speaking other language at home - Born in the United States (%)
Residents speaking other language at home - Native, born elsewhere (%)
Residents speaking other language at home - Foreign born (%)
Marital status - Never married (%)
Marital status - Now married (%)
Marital status - Separated (%)
Marital status - Widowed (%)
Marital status - Divorced (%)
Ancestries Reported - Arab (%)
Ancestries Reported - Czech (%)
Ancestries Reported - Danish (%)
Ancestries Reported - Dutch (%)
Ancestries Reported - English (%)
Ancestries Reported - French (%)
Ancestries Reported - French Canadian (%)
Ancestries Reported - German (%)
Ancestries Reported - Greek (%)
Ancestries Reported - Hungarian (%)
Ancestries Reported - Irish (%)
Ancestries Reported - Italian (%)
Ancestries Reported - Lithuanian (%)
Ancestries Reported - Norwegian (%)
Ancestries Reported - Polish (%)
Ancestries Reported - Portuguese (%)
Ancestries Reported - Russian (%)
Ancestries Reported - Scotch-Irish (%)
Ancestries Reported - Scottish (%)
Ancestries Reported - Slovak (%)
Ancestries Reported - Subsaharan African (%)
Ancestries Reported - Swedish (%)
Ancestries Reported - Swiss (%)
Ancestries Reported - Ukrainian (%)
Ancestries Reported - United States (%)
Ancestries Reported - Welsh (%)
Ancestries Reported - West Indian (%)
Ancestries Reported - Other (%)
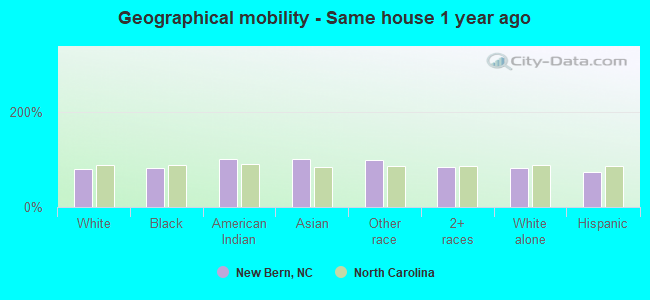
Geographical mobility - Same house 1 year ago (%)
Geographical mobility - Same house 1 year ago (%) - White
Geographical mobility - Same house 1 year ago (%) - Black or African American
Geographical mobility - Same house 1 year ago (%) - Asian
Geographical mobility - Same house 1 year ago (%) - Hispanic or Latino
Geographical mobility - Same house 1 year ago (%) - American Indian and Alaska Native
Geographical mobility - Same house 1 year ago (%) - Multirace
Geographical mobility - Same house 1 year ago (%) - Other Race
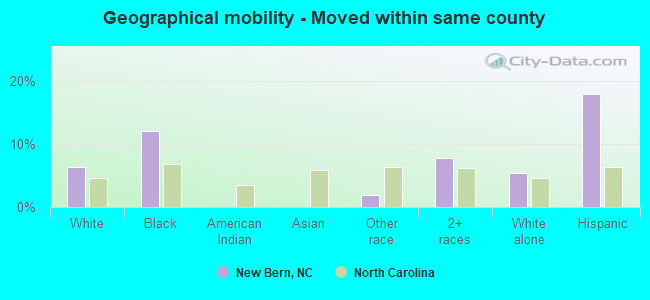
Geographical mobility - Moved within same county (%)
Geographical mobility - Moved within same county (%) - White
Geographical mobility - Moved within same county (%) - Black or African American
Geographical mobility - Moved within same county (%) - Asian
Geographical mobility - Moved within same county (%) - Hispanic or Latino
Geographical mobility - Moved within same county (%) - American Indian and Alaska Native
Geographical mobility - Moved within same county (%) - Multirace
Geographical mobility - Moved within same county (%) - Other Race
Geographical mobility - Moved from different county within same state (%)
Geographical mobility - Moved from different county within same state (%) - White
Geographical mobility - Moved from different county within same state (%) - Black or African American
Geographical mobility - Moved from different county within same state (%) - Asian
Geographical mobility - Moved from different county within same state (%) - Hispanic or Latino
Geographical mobility - Moved from different county within same state (%) - American Indian and Alaska Native
Geographical mobility - Moved from different county within same state (%) - Multirace
Geographical mobility - Moved from different county within same state (%) - Other Race
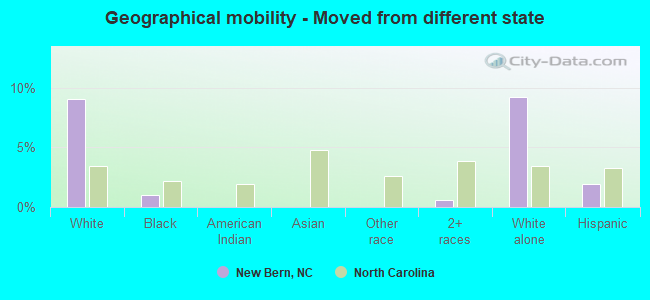
Geographical mobility - Moved from different state (%)
Geographical mobility - Moved from different state (%) - White
Geographical mobility - Moved from different state (%) - Black or African American
Geographical mobility - Moved from different state (%) - Asian
Geographical mobility - Moved from different state (%) - Hispanic or Latino
Geographical mobility - Moved from different state (%) - American Indian and Alaska Native
Geographical mobility - Moved from different state (%) - Multirace
Geographical mobility - Moved from different state (%) - Other Race
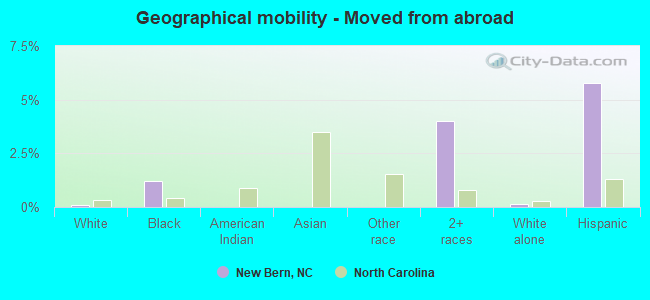
Geographical mobility - Moved from abroad (%)
Geographical mobility - Moved from abroad (%) - White
Geographical mobility - Moved from abroad (%) - Black or African American
Geographical mobility - Moved from abroad (%) - Asian
Geographical mobility - Moved from abroad (%) - Hispanic or Latino
Geographical mobility - Moved from abroad (%) - American Indian and Alaska Native
Geographical mobility - Moved from abroad (%) - Multirace
Geographical mobility - Moved from abroad (%) - Other Race
Place of birth for the foreign-born population - Ireland (%)
Place of birth for the foreign-born population - Denmark (%)
Place of birth for the foreign-born population - Norway (%)
Place of birth for the foreign-born population - Sweden (%)
Place of birth for the foreign-born population - United Kingdom (%)
Place of birth for the foreign-born population - England (%)
Place of birth for the foreign-born population - Scotland (%)
Place of birth for the foreign-born population - Other Northern Europe (%)
Place of birth for the foreign-born population - Austria (%)
Place of birth for the foreign-born population - Belgium (%)
Place of birth for the foreign-born population - France (%)
Place of birth for the foreign-born population - Germany (%)
Place of birth for the foreign-born population - Netherlands (%)
Place of birth for the foreign-born population - Switzerland (%)
Place of birth for the foreign-born population - Other Western Europe (%)
Place of birth for the foreign-born population - Greece (%)
Place of birth for the foreign-born population - Italy (%)
Place of birth for the foreign-born population - Portugal (%)
Place of birth for the foreign-born population - Spain (%)
Place of birth for the foreign-born population - Other Southern Europe (%)
Place of birth for the foreign-born population - Albania (%)
Place of birth for the foreign-born population - Belarus (%)
Place of birth for the foreign-born population - Bosnia and Herzegovina (%)
Place of birth for the foreign-born population - Bulgaria (%)
Place of birth for the foreign-born population - Croatia (%)
Place of birth for the foreign-born population - Czechoslovakia (%)
Place of birth for the foreign-born population - Hungary (%)
Place of birth for the foreign-born population - Latvia (%)
Place of birth for the foreign-born population - Lithuania (%)
Place of birth for the foreign-born population - North Macedonia (Macedonia) (%)
Place of birth for the foreign-born population - Moldova (%)
Place of birth for the foreign-born population - Poland (%)
Place of birth for the foreign-born population - Romania (%)
Place of birth for the foreign-born population - Russia (%)
Place of birth for the foreign-born population - Serbia (%)
Place of birth for the foreign-born population - Ukraine (%)
Place of birth for the foreign-born population - Other Eastern Europe (%)
Place of birth for the foreign-born population - China (%)
Place of birth for the foreign-born population - Hong Kong (%)
Place of birth for the foreign-born population - Taiwan (%)
Place of birth for the foreign-born population - Japan (%)
Place of birth for the foreign-born population - Korea (%)
Place of birth for the foreign-born population - Other Eastern Asia (%)
Place of birth for the foreign-born population - Afghanistan (%)
Place of birth for the foreign-born population - Bangladesh (%)
Place of birth for the foreign-born population - India (%)
Place of birth for the foreign-born population - Iran (%)
Place of birth for the foreign-born population - Kazakhstan (%)
Place of birth for the foreign-born population - Nepal (%)
Place of birth for the foreign-born population - Pakistan (%)
Place of birth for the foreign-born population - Sri Lanka (%)
Place of birth for the foreign-born population - Uzbekistan (%)
Place of birth for the foreign-born population - Other South Central Asia (%)
Place of birth for the foreign-born population - Burma (%)
Place of birth for the foreign-born population - Cambodia (%)
Place of birth for the foreign-born population - Indonesia (%)
Place of birth for the foreign-born population - Laos (%)
Place of birth for the foreign-born population - Malaysia (%)
Place of birth for the foreign-born population - Philippines (%)
Place of birth for the foreign-born population - Singapore (%)
Place of birth for the foreign-born population - Thailand (%)
Place of birth for the foreign-born population - Vietnam (%)
Place of birth for the foreign-born population - Other South Eastern Asia (%)
Place of birth for the foreign-born population - Armenia (%)
Place of birth for the foreign-born population - Iraq (%)
Place of birth for the foreign-born population - Israel (%)
Place of birth for the foreign-born population - Jordan (%)
Place of birth for the foreign-born population - Kuwait (%)
Place of birth for the foreign-born population - Lebanon (%)
Place of birth for the foreign-born population - Saudi Arabia (%)
Place of birth for the foreign-born population - Syria (%)
Place of birth for the foreign-born population - Turkey (%)
Place of birth for the foreign-born population - Yemen (%)
Place of birth for the foreign-born population - Other Western Asia (%)
Place of birth for the foreign-born population - Eritrea (%)
Place of birth for the foreign-born population - Ethiopia (%)
Place of birth for the foreign-born population - Kenya (%)
Place of birth for the foreign-born population - Somalia (%)
Place of birth for the foreign-born population - Uganda (%)
Place of birth for the foreign-born population - Zimbabwe (%)
Place of birth for the foreign-born population - Other Eastern Africa (%)
Place of birth for the foreign-born population - Cameroon (%)
Place of birth for the foreign-born population - Congo (%)
Place of birth for the foreign-born population - Democratic Republic of Congo (Zaire) (%)
Place of birth for the foreign-born population - Other Middle Africa (%)
Place of birth for the foreign-born population - Egypt (%)
Place of birth for the foreign-born population - Morocco (%)
Place of birth for the foreign-born population - Sudan (%)
Place of birth for the foreign-born population - Other Northern Africa (%)
Place of birth for the foreign-born population - South Africa (%)
Place of birth for the foreign-born population - Other Southern Africa (%)
Place of birth for the foreign-born population - Cabo Verde (%)
Place of birth for the foreign-born population - Ghana (%)
Place of birth for the foreign-born population - Liberia (%)
Place of birth for the foreign-born population - Nigeria (%)
Place of birth for the foreign-born population - Senegal (%)
Place of birth for the foreign-born population - Sierra Leone (%)
Place of birth for the foreign-born population - Other Western Africa (%)
Place of birth for the foreign-born population - Australia (%)
Place of birth for the foreign-born population - New Zealand (%)
Place of birth for the foreign-born population - Fiji (%)
Place of birth for the foreign-born population - Micronesia (%)
Place of birth for the foreign-born population - Bahamas (%)
Place of birth for the foreign-born population - Barbados (%)
Place of birth for the foreign-born population - Cuba (%)
Place of birth for the foreign-born population - Dominica (%)
Place of birth for the foreign-born population - Dominican Republic (%)
Place of birth for the foreign-born population - Grenada (%)
Place of birth for the foreign-born population - Haiti (%)
Place of birth for the foreign-born population - Jamaica (%)
Place of birth for the foreign-born population - St. Vincent and the Grenadines (%)
Place of birth for the foreign-born population - Trinidad and Tobago (%)
Place of birth for the foreign-born population - West Indies (%)
Place of birth for the foreign-born population - Other Caribbean (%)
Place of birth for the foreign-born population - Belize (%)
Place of birth for the foreign-born population - Costa Rica (%)
Place of birth for the foreign-born population - El Salvador (%)
Place of birth for the foreign-born population - Guatemala (%)
Place of birth for the foreign-born population - Honduras (%)
Place of birth for the foreign-born population - Mexico (%)
Place of birth for the foreign-born population - Nicaragua (%)
Place of birth for the foreign-born population - Panama (%)
Place of birth for the foreign-born population - Other Central America (%)
Place of birth for the foreign-born population - Argentina (%)
Place of birth for the foreign-born population - Bolivia (%)
Place of birth for the foreign-born population - Brazil (%)
Place of birth for the foreign-born population - Chile (%)
Place of birth for the foreign-born population - Colombia (%)
Place of birth for the foreign-born population - Ecuador (%)
Place of birth for the foreign-born population - Guyana (%)
Place of birth for the foreign-born population - Peru (%)
Place of birth for the foreign-born population - Uruguay (%)
Place of birth for the foreign-born population - Venezuela (%)
Place of birth for the foreign-born population - Other South America (%)
Place of birth for the foreign-born population - Canada (%)
Place of birth for the foreign-born population - Other Northern America (%)
Place of birth for the foreign-born population - Other (%)
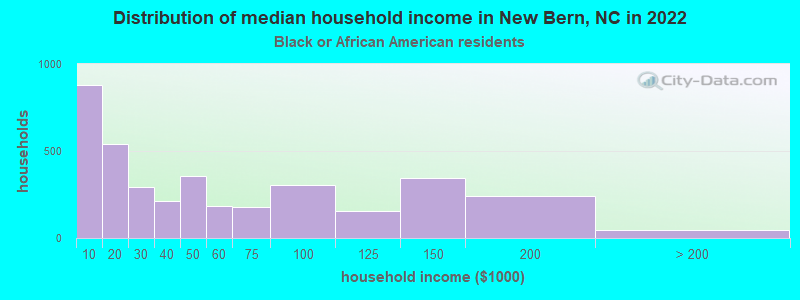
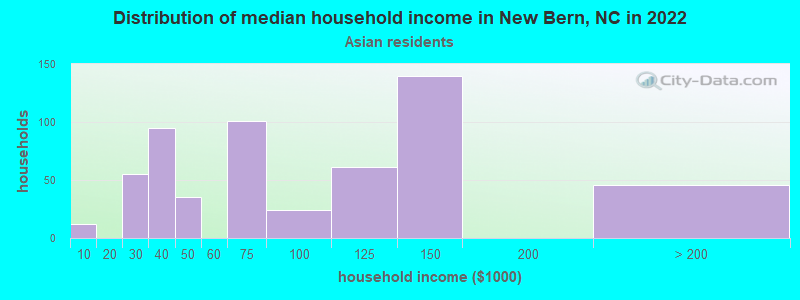
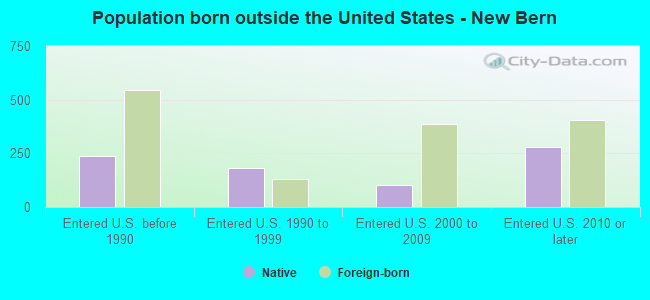
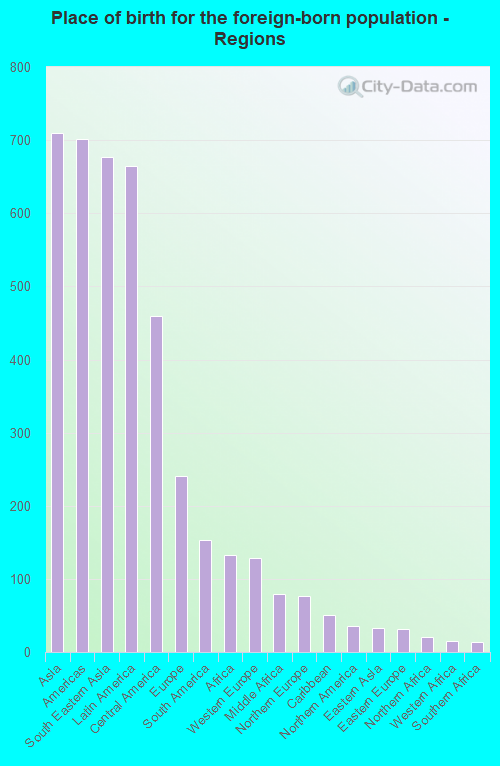
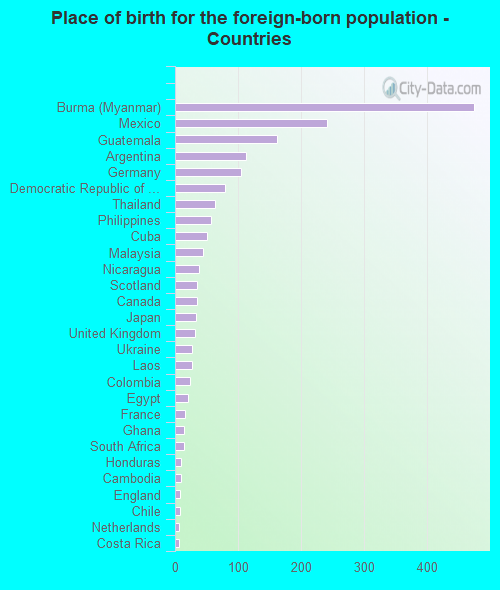
According to 2022 data, the most numerous races in New Bern, NC are White alone (16,986 residents), Black alone (7,909 residents), and Hispanic (2,062 residents). 89.5% of New Bern residents speak English at home. 5.7% of New Bern, NC residents are foreign-born (2.1% born in Asia, 2.0% born in Latin America, 0.7% born in Europe), which is 40.2% less than the foreign-born rate of 8.0% across the entire state of North Carolina.
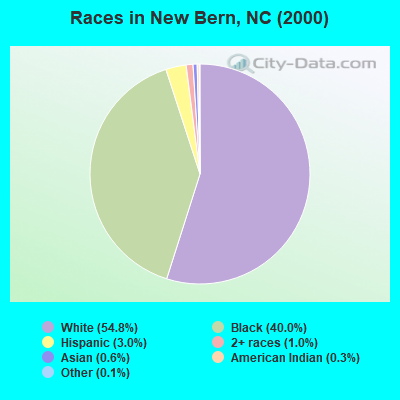
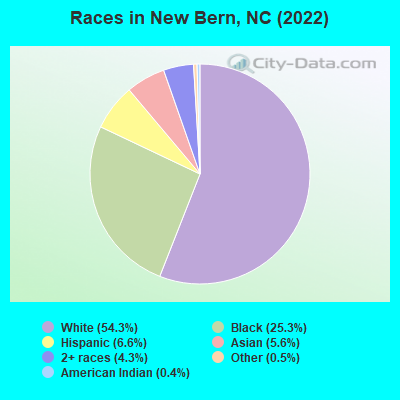
Race distribution in New Bern
2000 2022
5,647,155 70.2% White alone 1,723,301 21.4% Black alone 378,963 4.7% Hispanic 112,416 1.4% Asian alone 95,333 1.2% American Indian alone 79,965 1.0% Two or more races 9,015 0.1% Other race alone 3,165 0.04% Native Hawaiian and Other
6,497,519 60.7% White alone 2,155,650 20.1% Black alone 1,114,799 10.4% Hispanic 438,061 4.1% Two or more races 341,052 3.2% Asian alone 91,758 0.9% American Indian alone 50,180 0.5% Other race alone 9,954 0.09% Native Hawaiian and Other
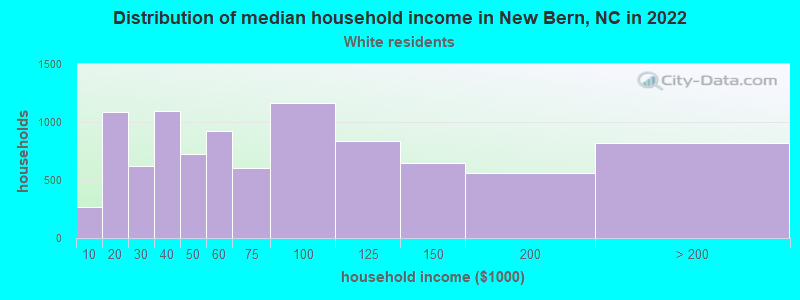
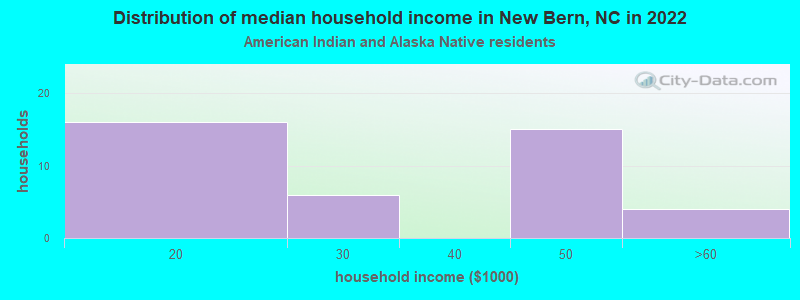
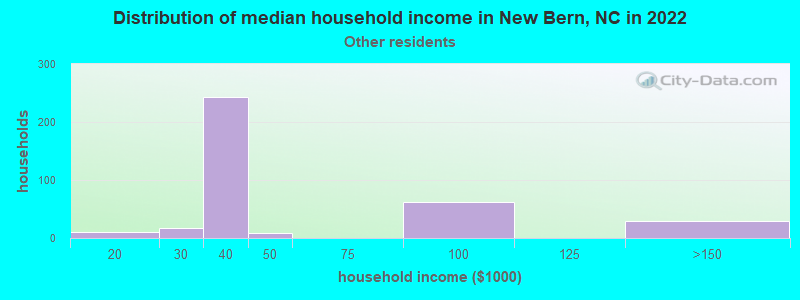
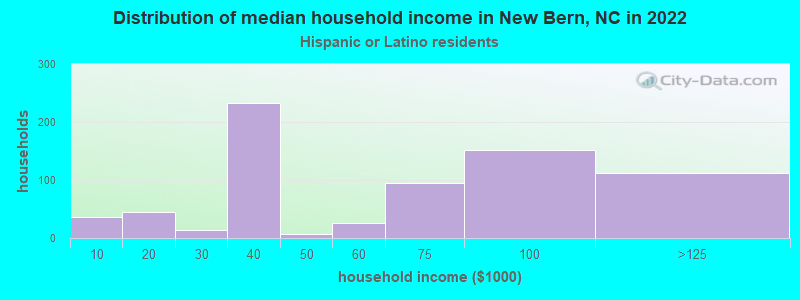
Income and house value in New Bern Median household income in 2022 $66,203 White non-Hispanic householders$43,359 Black householders$39,962 Some other race householders$102,950 Two or more races householders$70,231 Hispanic or Latino race householdersMedian 2022 house value $262,164 White Non-Hispanic householders$182,205 Black or African American householders$146,823 American Indian or Alaska Native householders $205,608 Asian householders$236,811 Native Hawaiian and other Pacific Islander householders$304,790 Some other race householders$269,408 Two or more races householders$304,790 Hispanic or Latino householders
Median age by race in New Bern
54.2 Median age for White residents54.4 52.8 36.5 Median age for Black or African American residents38.4 36.6 50.3 Median age for American Indian / Alaska Native residents10.6 41.3 29.9 Median age for Asian residents30.4 26.0 -609,884,331.7 Median age for Native Hawaiian / Pacific Islander residents-611,708,482.1 -612,403,100.2 40.5 Median age for Other race residents28.1 50.1 21.1 Median age for Two or more races residents16.7 29.3 51.8 Median age for White alone residents53.7 51.6 32.1 Median age for Hispanic or Latino residents26.4 45.6
Owner/renter occupied households by race in New Bern
House owners and renters - White residents 6,150 69.8% Owner occupied2,655 30.2% Renter occupiedHouse owners and renters - Black or African American residents 2,019 56.6% Owner occupied1,549 43.4% Renter occupiedHouse owners and renters - American Indian / Alaska Native residents 20 45.1% Owner occupied24 54.9% Renter occupiedHouse owners and renters - Asian residents 347 57.9% Owner occupied253 42.1% Renter occupiedHouse owners and renters - Other race residents 108 28.2% Owner occupied275 71.8% Renter occupiedHouse owners and renters - Two or more races residents 475 47.1% Owner occupied533 52.9% Renter occupiedHouse owners and renters - White alone residents 6,090 71.0% Owner occupied2,483 29.0% Renter occupiedHouse owners and renters - Hispanic or Latino residents 302 46.2% Owner occupied351 53.8% Renter occupied
Language usage in New Bern
English speakers - Total 89.5% of residents of New Bern speak English at home.
4.2% of residents speak Spanish at home 946 76.4% Speak English very well293 23.6% Speak English less than very well6.5% of residents speak other language at home 1,155 60.4% Speak English very well757 39.6% Speak English less than very well
English speakers - Born in the United States 93.7% of residents of New Bern speak English at home.
3.8% of residents speak Spanish at home 583 99.1% Speak English very well5 0.9% Speak English less than very well3.0% of residents speak other language at home 84 17.9% Speak English very well384 82.1% Speak English less than very well
English speakers - Native, born elsewhere 34.3% of residents of New Bern speak English at home.
37.4% of residents speak Spanish at home 169 56.9% Speak English very well128 43.1% Speak English less than very well48.2% of residents speak other language at home 383 100.0% Speak English very well
English speakers - Foreign-born 17.7% of residents of New Bern speak English at home.
26.5% of residents speak Spanish at home 110 29.2% Speak English very well267 70.8% Speak English less than very well54.7% of residents speak other language at home 429 55.0% Speak English very well351 45.0% Speak English less than very well
White (Caucasian) - Speak only English Native:
99.6% (15,977)Foreign-born:
61.5% (127)
White (Caucasian) - Speak another language Native:
1.7% (278)Foreign-born:
91.4% (189)
Black or African American - Speak only English Native:
96.5% (6,728)Foreign-born:
10.6% (32)
Black or African American - Speak another language Native:
3.4% (237)Foreign-born:
60.4% (184)
Asian - Speak only English Native:
20.5% (227)Foreign-born:
7.4% (45)
Asian - Speak another language Native:
85.4% (945)Foreign-born:
100.0% (610)
Other race - Speak only English Native:
64.4% (477)Foreign-born:
2.2% (8)
Other race - Speak another language Native:
36.3% (269)Foreign-born:
98.2% (354)
Two or more races - Speak only English Native:
77.3% (1,341)Foreign-born:
9.9% (11)
Two or more races - Speak another language Native:
22.6% (392)Foreign-born:
90.1% (99)
White alone - Speak only English Native:
98.9% (15,906)Foreign-born:
54.2% (127)
White alone - Speak another language Native:
1.1% (175)Foreign-born:
44.1% (103)
Hispanic or Latino - Speak another language Native:
55.2% (750)Foreign-born:
87.0% (380)
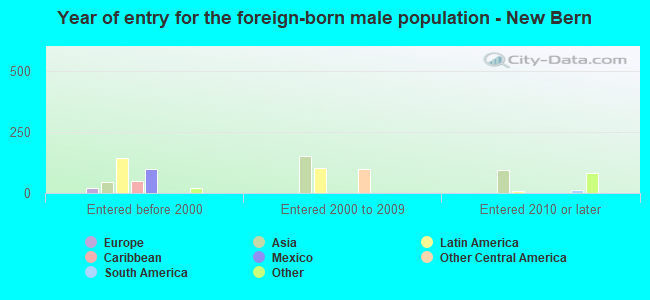
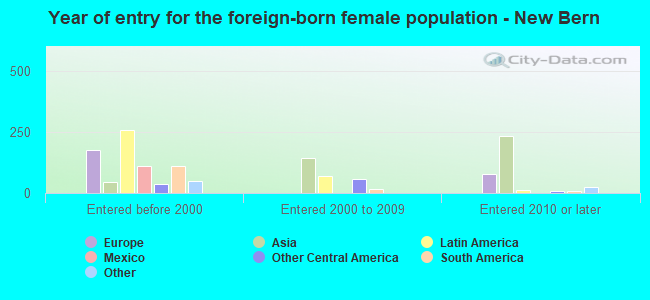
Foreign-born residents in New Bern 1,786 residents are foreign born (2.1% Asia , 2.0% Latin America , 0.7% Europe ).
This city:
5.7%North Carolina:
8.3%
Marital status for residents in New Bern Marital status - White (Caucasian) population 15 years and over
Males 21.0% Never married60.7% Now married2.6% Separated2.9% Widowed12.8% DivorcedFemales 16.4% Never married49.3% Now married2.8% Separated13.6% Widowed17.8% DivorcedWomen who gave birth in the past 12 months Now married:
81.3% (121)Unmarried:
18.8% (28)
Women who did not give birth in the past 12 months Now married:
51.2% (1,596)Unmarried:
48.8% (1,521)
Marital status - Black or African American population 15 years and over
Males 34.7% Never married46.3% Now married2.3% Separated4.1% Widowed12.6% DivorcedFemales 41.0% Never married32.0% Now married5.7% Separated8.8% Widowed12.6% DivorcedWomen who gave birth in the past 12 months Now married:
87.5% (49)Unmarried:
12.5% (7)
Women who did not give birth in the past 12 months Now married:
33.2% (761)Unmarried:
66.8% (1,530)
Marital status - American Indian / Alaska Native population 15 years and over
Males 31.4% Never married0.0% Now married0.0% Separated0.0% Widowed68.6% DivorcedFemales 22.5% Never married3.9% Now married13.7% Separated0.0% Widowed59.8% DivorcedWomen who gave birth in the past 12 months Now married:
100.0% (15)Unmarried:
0.0% (0)
Women who did not give birth in the past 12 months Now married:
4.5% (4)Unmarried:
95.5% (89)
Marital status - Asian population 15 years and over
Males 30.2% Never married54.5% Now married0.0% Separated0.0% Widowed15.3% DivorcedFemales 61.2% Never married31.7% Now married0.0% Separated7.1% Widowed0.0% DivorcedWomen who gave birth in the past 12 months Now married:
13.4% (16)Unmarried:
86.6% (102)
Women who did not give birth in the past 12 months Now married:
19.7% (64)Unmarried:
80.3% (261)
Marital status - Other race population 15 years and over
Males 49.1% Never married50.9% Now married0.0% Separated0.0% Widowed0.0% DivorcedFemales 15.2% Never married18.8% Now married0.0% Separated24.1% Widowed41.9% DivorcedWomen who did not give birth in the past 12 months Now married:
21.1% (96)Unmarried:
78.9% (359)
Marital status - Two or more races population 15 years and over
Males 50.4% Never married29.8% Now married0.0% Separated6.5% Widowed13.3% DivorcedFemales 41.4% Never married39.5% Now married5.4% Separated9.4% Widowed4.4% DivorcedWomen who gave birth in the past 12 months Now married:
0.0% (0)Unmarried:
100.0% (29)
Women who did not give birth in the past 12 months Now married:
49.7% (233)Unmarried:
50.3% (235)
Marital status - White alone, not Hispanic / Latino population 15 years and over
Males 20.4% Never married61.1% Now married2.7% Separated2.9% Widowed12.9% DivorcedFemales 15.7% Never married49.8% Now married2.0% Separated14.2% Widowed18.3% DivorcedWomen who gave birth in the past 12 months Now married:
80.4% (120)Unmarried:
19.6% (29)
Women who did not give birth in the past 12 months Now married:
50.2% (1,492)Unmarried:
49.8% (1,480)
Marital status - Hispanic or Latino population 15 years and over
Males 29.7% Never married66.5% Now married0.0% Separated0.0% Widowed3.7% DivorcedFemales 27.3% Never married37.2% Now married6.8% Separated14.0% Widowed14.7% DivorcedWomen who gave birth in the past 12 months Now married:
100.0% (8)Unmarried:
0.0% (0)
Women who did not give birth in the past 12 months Now married:
48.3% (405)Unmarried:
51.7% (434)
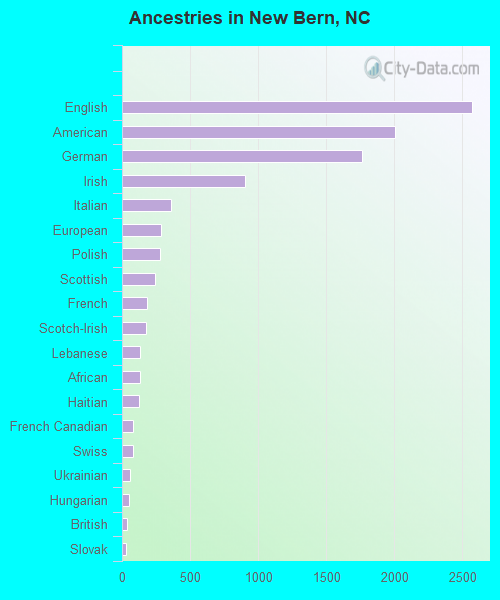
Ancestries in New Bern
2,569 12.3% English2,007 9.6% American1,765 8.4% German901 4.3% Irish360 1.7% Italian289 1.4% European281 1.3% Polish244 1.2% Scottish185 0.9% French176 0.8% Scotch-Irish132 0.6% Lebanese129 0.6% African127 0.6% Haitian82 0.4% French Canadian79 0.4% Swiss59 0.3% Ukrainian55 0.3% Hungarian35 0.2% British32 0.2% Slovak23 0.1% Danish21 0.1% Armenian21 0.1% Dutch18 0.09% Czech18 0.09% Norwegian15 0.07% Egyptian15 0.07% Eastern European14 0.07% Belgian12 0.06% Finnish12 0.06% Swedish9 0.04% Jamaican7 0.03% Serbian7 0.03% Welsh6 0.03% Czechoslovakian5 0.02% South African4 0.02% Croatian4 0.02% Lithuanian3 0.01% Russian2 0.01% Portuguese
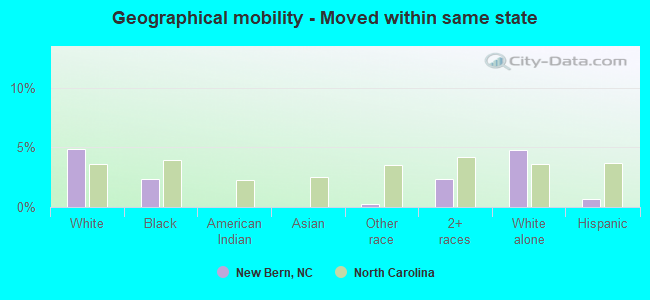
Geographical mobility in New Bern Same house 1 year ago 13,546 80.5% White (Caucasian)6,514 82.4% Black or African American179 100.0% American Indian / Alaska Native1,635 100.0% Asian1,076 98.0% Other race2,493 83.0% Two or more races13,762 81.3% White alone, not Hispanic / Latino1,521 73.4% Hispanic or LatinoMoved within same county 1,061 6.3% White / Caucasian953 12.1% Black or African American20 1.8% Other race235 7.8% Two or more races904 5.3% White alone, not Hispanic / Latino370 17.8% Hispanic or LatinoMoved within same state 814 4.8% White / Caucasian185 2.3% Black or African American3 0.3% Other race70 2.3% Two or more races802 4.7% White alone, not Hispanic / Latino14 0.7% Hispanic or LatinoMoved from different state 1,521 9.0% White / Caucasian82 1.0% Black or African American17 0.6% Two or more races1,560 9.2% White alone, not Hispanic / Latino39 1.9% Hispanic or LatinoMoved from abroad 19 0.1% White97 1.2% Black or African American120 4.0% Two or more races21 0.1% White alone, not Hispanic / Latino120 5.8% Hispanic or Latino
Children Nativity (place of birth) in New Bern
Children under 6 years - Living with two parents Both parents native 1,140 100.0% Native0 0.0% Foreign-bornBoth parents foreign-born 36 53.6% Native31 46.4% Foreign-bornOne native, one foreign-born parent 33 100.0% NativeChildren under 6 years - Living with one parent Native parent 964 100.0% NativeForeign-born parent 139 100.0% NativeChildren 6 to 17 years - Living with two parents Both parents native 2,140 100.0% NativeBoth parents foreign-born 37 71.2% Native15 28.8% Foreign-bornOne native, one foreign-born parent 100 100.0% NativeChildren 6 to 17 years - Living with one parent Native parent 1,688 100.0% NativeForeign-born parent 300 52.1% Native276 47.9% Foreign-born
Grandparents responsible for own grandchildren in New Bern
Grandparents (30 to 59 years) White / Caucasian 52 82.6% Responsible for grandchildren11 17.4% Not responsible for grandchildrenBlack or African American 284 100.0% Not responsible for grandchildrenWhite alone, not Hispanic / Latino 55 83.0% Responsible for grandchildren11 17.0% Not responsible for grandchildrenGrandparents (60 years and over) White / Caucasian 50 41.6% Responsible for grandchildren70 58.4% Not responsible for grandchildrenBlack or African American 4 11.1% Responsible for grandchildren36 88.9% Not responsible for grandchildrenWhite alone, not Hispanic / Latino 51 41.7% Responsible for grandchildren72 58.3% Not responsible for grandchildren