Races in New Haven, Wisconsin (WI) Detailed Stats
Ancestries, Foreign-born residents, place of birth
3.5% of New Haven, WI residents are foreign-born (2.6% born in Europe, 0.6% born in Latin America), which is 42.8% less than the foreign-born rate of 5.0% across the entire state of Wisconsin.
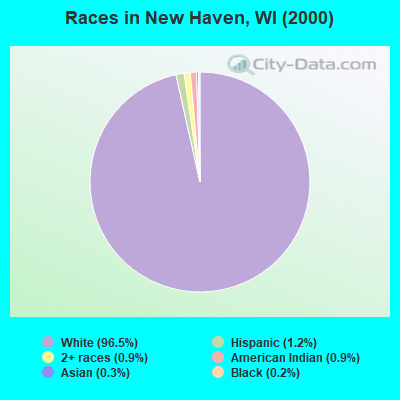
Race distribution in New Haven

- 63496.5%White alone
- 81.2%Hispanic
- 60.9%Two or more races
- 60.9%American Indian alone
- 20.3%Asian alone
- 10.2%Black alone
2000
2022
-
- 4,681,63087.3%White alone
- 300,2455.6%Black alone
- 192,9213.6%Hispanic
- 87,9951.6%Asian alone
- 51,9211.0%Two or more races
- 43,9800.8%American Indian alone
- 3,6370.07%Other race alone
- 1,3460.03%Native Hawaiian and Other
Pacific Islander alone

-
- 4,654,03179.0%White alone
- 447,0227.6%Hispanic
- 345,6785.9%Black alone
- 217,5323.7%Two or more races
- 172,2422.9%Asian alone
- 33,7620.6%American Indian alone
- 19,6800.3%Other race alone
- 2,5920.04%Native Hawaiian and Other
Pacific Islander alone

Income and house value in New Haven
- Median household income in 2022
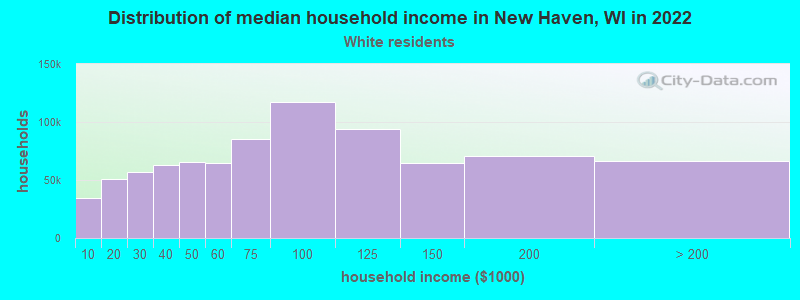
- $59,781White non-Hispanic householders
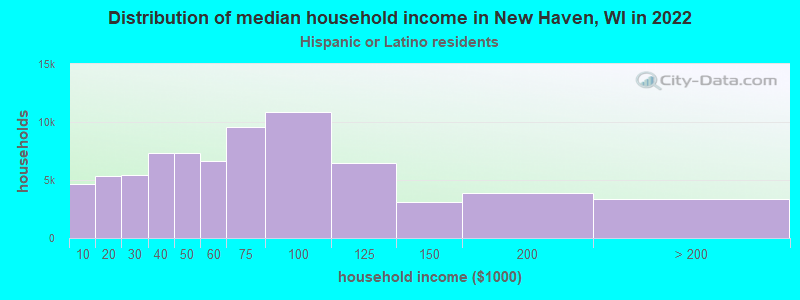
- $68,163Hispanic or Latino race householders
- Median 2022 house value
- $216,843White Non-Hispanic householders
Household income for White non-Hispanic householders
Household income for Hispanic or Latino race householders
Foreign-born residents in New Haven
23 residents are foreign born (2.6% Europe, 0.6% Latin America).
| This city: | 3.5% |
| Wisconsin: | 3.6% |
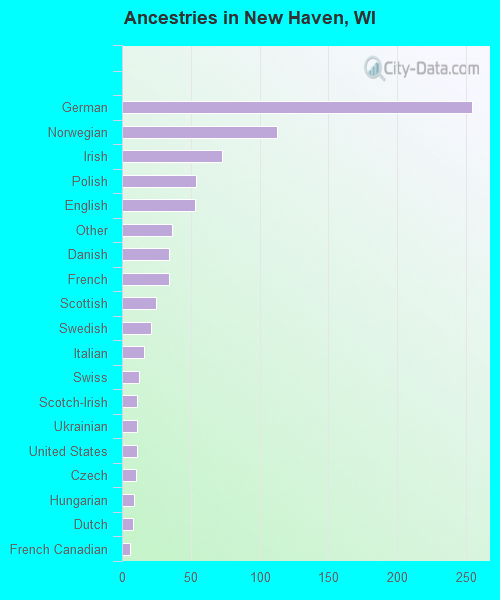
Ancestries in New Haven

- 25431.9%German
- 11314.2%Norwegian
- 739.2%Irish
- 546.8%Polish
- 536.7%English
- 364.5%Other
- 344.3%Danish
- 344.3%French
- 253.1%Scottish
- 212.6%Swedish
- 162.0%Italian
- 121.5%Swiss
- 111.4%Scotch-Irish
- 111.4%Ukrainian
- 111.4%United States
- 101.3%Czech
- 91.1%Hungarian
- 81.0%Dutch
- 60.8%French Canadian
- 20.3%Lithuanian
- 20.3%Welsh
Zip codes: 53965.