Races in Nipomo, California (CA) Detailed Stats
Data:
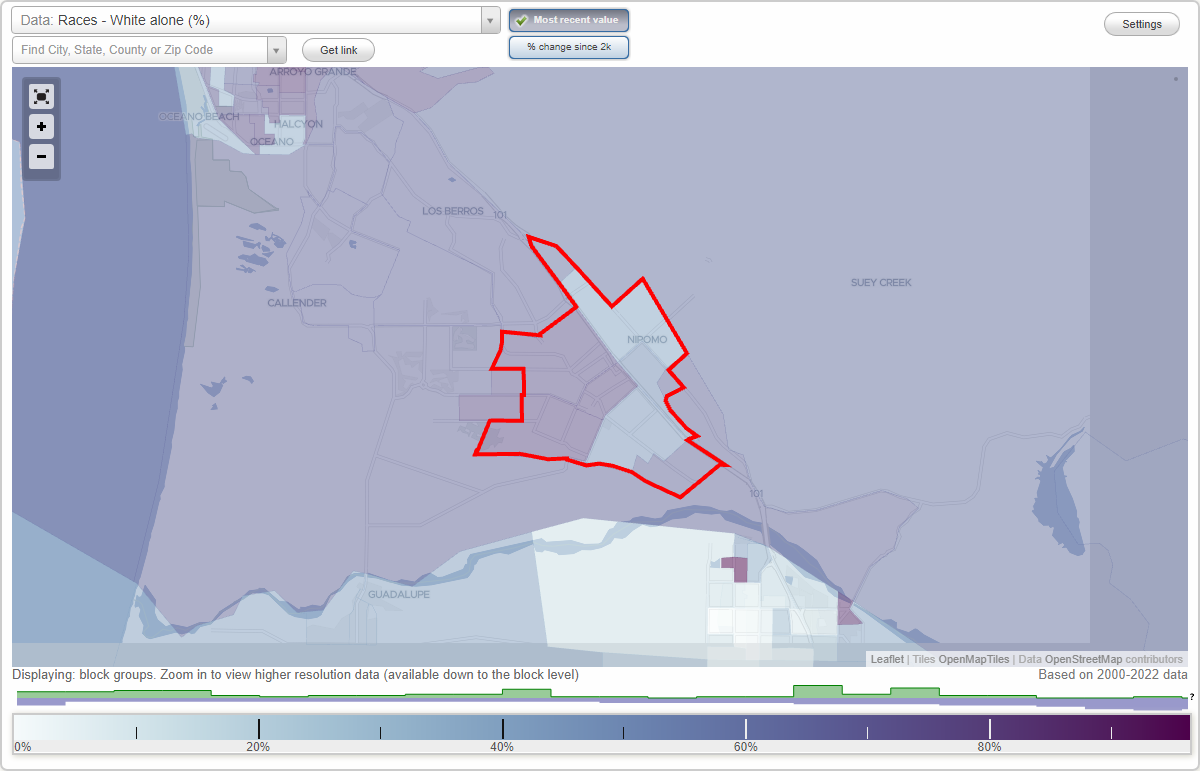
Races - White alone (%)
Races - White alone (% change since 2000)
Races - Black alone (%)
Races - Black alone (% change since 2000)
Races - American Indian alone (%)
Races - American Indian alone (% change since 2000)
Races - Asian alone (%)
Races - Asian alone (% change since 2000)
Races - Hispanic (%)
Races - Hispanic (% change since 2000)
Races - Native Hawaiian and Other Pacific Islander alone (%)
Races - Native Hawaiian and Other Pacific Islander alone (% change since 2000)
Races - Two or more races(%)
Races - Two or more races(% change since 2000)
Races - Other race alone (%)
Races - Other race alone (% change since 2000)
Racial diversity
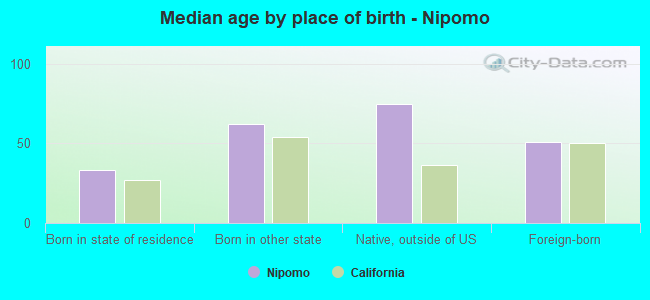
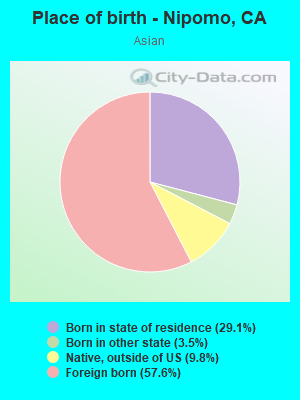
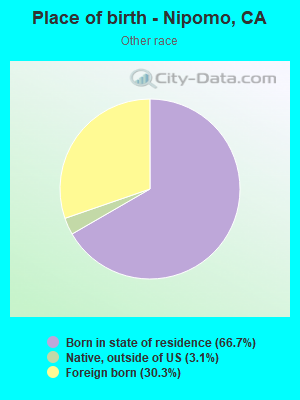
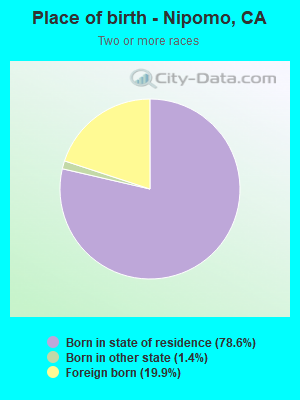
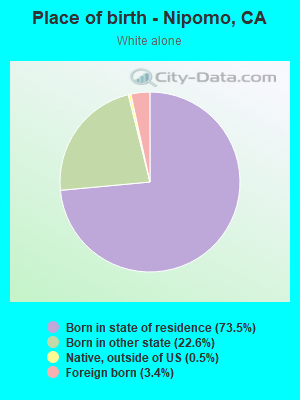
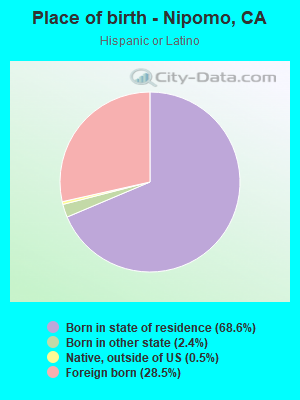
Place of birth - Born in state of residence (%)
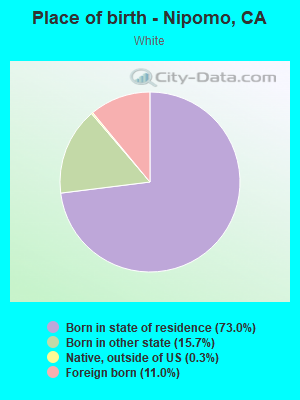
Place of birth - Born in state of residence (%) - White
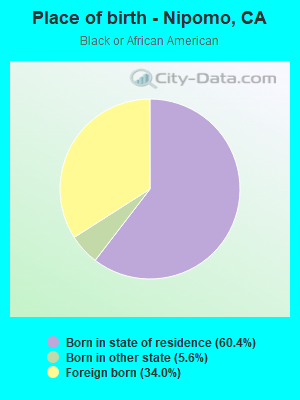
Place of birth - Born in state of residence (%) - Black or African American
Place of birth - Born in state of residence (%) - Asian
Place of birth - Born in state of residence (%) - Hispanic or Latino
Place of birth - Born in state of residence (%) - American Indian and Alaska Native
Place of birth - Born in state of residence (%) - Multirace
Place of birth - Born in state of residence (%) - Other Race
Place of birth - Born in other state (%)
Place of birth - Born in other state (%) - White
Place of birth - Born in other state (%) - Black or African American
Place of birth - Born in other state (%) - Asian
Place of birth - Born in other state (%) - Hispanic or Latino
Place of birth - Born in other state (%) - American Indian and Alaska Native
Place of birth - Born in other state (%) - Multirace
Place of birth - Born in other state (%) - Other Race
Place of birth - Native, outside of US (%)
Place of birth - Native, outside of US (%) - White
Place of birth - Native, outside of US (%) - Black or African American
Place of birth - Native, outside of US (%) - Asian
Place of birth - Native, outside of US (%) - Hispanic or Latino
Place of birth - Native, outside of US (%) - American Indian and Alaska Native
Place of birth - Native, outside of US (%) - Multirace
Place of birth - Native, outside of US (%) - Other Race
Place of birth - Foreign born (%)
Place of birth - Foreign born (%) - White
Place of birth - Foreign born (%) - Black or African American
Place of birth - Foreign born (%) - Asian
Place of birth - Foreign born (%) - Hispanic or Latino
Place of birth - Foreign born (%) - American Indian and Alaska Native
Place of birth - Foreign born (%) - Multirace
Place of birth - Foreign born (%) - Other Race
Residents speaking English at home (%)
Residents speaking English at home - Born in the United States (%)
Residents speaking English at home - Native, born elsewhere (%)
Residents speaking English at home - Foreign born (%)
Residents speaking Spanish at home (%)
Residents speaking Spanish at home - Born in the United States (%)
Residents speaking Spanish at home - Native, born elsewhere (%)
Residents speaking Spanish at home - Foreign born (%)
Residents speaking other language at home (%)
Residents speaking other language at home - Born in the United States (%)
Residents speaking other language at home - Native, born elsewhere (%)
Residents speaking other language at home - Foreign born (%)
Marital status - Never married (%)
Marital status - Now married (%)
Marital status - Separated (%)
Marital status - Widowed (%)
Marital status - Divorced (%)
Ancestries Reported - Arab (%)
Ancestries Reported - Czech (%)
Ancestries Reported - Danish (%)
Ancestries Reported - Dutch (%)
Ancestries Reported - English (%)
Ancestries Reported - French (%)
Ancestries Reported - French Canadian (%)
Ancestries Reported - German (%)
Ancestries Reported - Greek (%)
Ancestries Reported - Hungarian (%)
Ancestries Reported - Irish (%)
Ancestries Reported - Italian (%)
Ancestries Reported - Lithuanian (%)
Ancestries Reported - Norwegian (%)
Ancestries Reported - Polish (%)
Ancestries Reported - Portuguese (%)
Ancestries Reported - Russian (%)
Ancestries Reported - Scotch-Irish (%)
Ancestries Reported - Scottish (%)
Ancestries Reported - Slovak (%)
Ancestries Reported - Subsaharan African (%)
Ancestries Reported - Swedish (%)
Ancestries Reported - Swiss (%)
Ancestries Reported - Ukrainian (%)
Ancestries Reported - United States (%)
Ancestries Reported - Welsh (%)
Ancestries Reported - West Indian (%)
Ancestries Reported - Other (%)
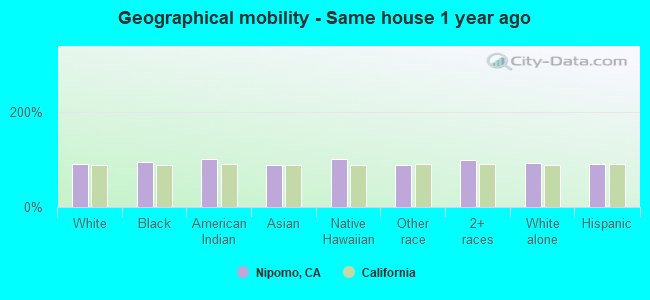
Geographical mobility - Same house 1 year ago (%)
Geographical mobility - Same house 1 year ago (%) - White
Geographical mobility - Same house 1 year ago (%) - Black or African American
Geographical mobility - Same house 1 year ago (%) - Asian
Geographical mobility - Same house 1 year ago (%) - Hispanic or Latino
Geographical mobility - Same house 1 year ago (%) - American Indian and Alaska Native
Geographical mobility - Same house 1 year ago (%) - Multirace
Geographical mobility - Same house 1 year ago (%) - Other Race
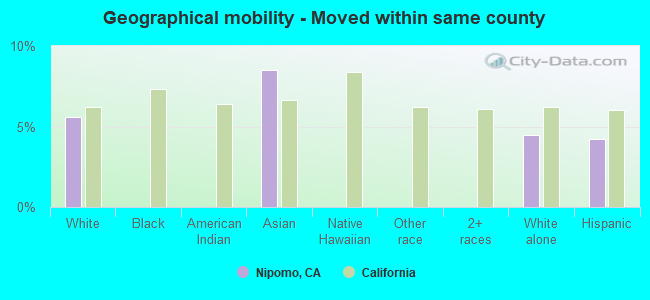
Geographical mobility - Moved within same county (%)
Geographical mobility - Moved within same county (%) - White
Geographical mobility - Moved within same county (%) - Black or African American
Geographical mobility - Moved within same county (%) - Asian
Geographical mobility - Moved within same county (%) - Hispanic or Latino
Geographical mobility - Moved within same county (%) - American Indian and Alaska Native
Geographical mobility - Moved within same county (%) - Multirace
Geographical mobility - Moved within same county (%) - Other Race
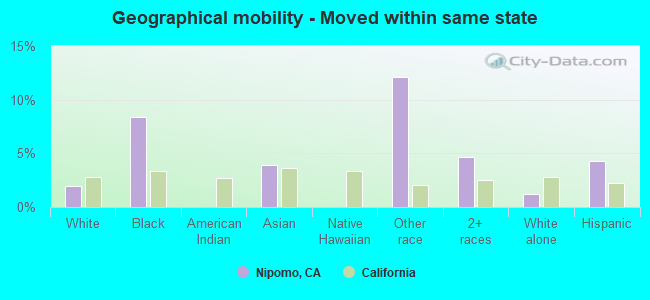
Geographical mobility - Moved from different county within same state (%)
Geographical mobility - Moved from different county within same state (%) - White
Geographical mobility - Moved from different county within same state (%) - Black or African American
Geographical mobility - Moved from different county within same state (%) - Asian
Geographical mobility - Moved from different county within same state (%) - Hispanic or Latino
Geographical mobility - Moved from different county within same state (%) - American Indian and Alaska Native
Geographical mobility - Moved from different county within same state (%) - Multirace
Geographical mobility - Moved from different county within same state (%) - Other Race
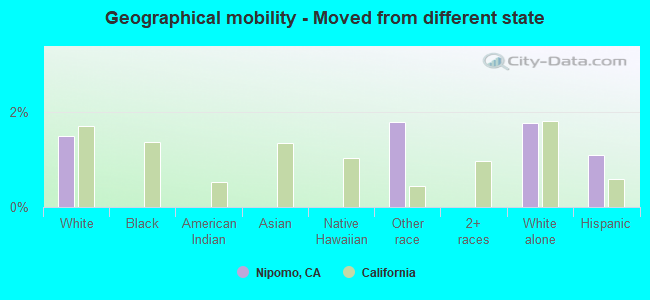
Geographical mobility - Moved from different state (%)
Geographical mobility - Moved from different state (%) - White
Geographical mobility - Moved from different state (%) - Black or African American
Geographical mobility - Moved from different state (%) - Asian
Geographical mobility - Moved from different state (%) - Hispanic or Latino
Geographical mobility - Moved from different state (%) - American Indian and Alaska Native
Geographical mobility - Moved from different state (%) - Multirace
Geographical mobility - Moved from different state (%) - Other Race
Geographical mobility - Moved from abroad (%)
Geographical mobility - Moved from abroad (%) - White
Geographical mobility - Moved from abroad (%) - Black or African American
Geographical mobility - Moved from abroad (%) - Asian
Geographical mobility - Moved from abroad (%) - Hispanic or Latino
Geographical mobility - Moved from abroad (%) - American Indian and Alaska Native
Geographical mobility - Moved from abroad (%) - Multirace
Geographical mobility - Moved from abroad (%) - Other Race
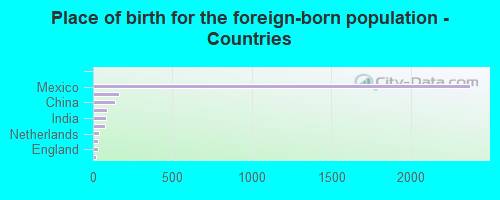
Place of birth for the foreign-born population - Ireland (%)
Place of birth for the foreign-born population - Denmark (%)
Place of birth for the foreign-born population - Norway (%)
Place of birth for the foreign-born population - Sweden (%)
Place of birth for the foreign-born population - United Kingdom (%)
Place of birth for the foreign-born population - England (%)
Place of birth for the foreign-born population - Scotland (%)
Place of birth for the foreign-born population - Other Northern Europe (%)
Place of birth for the foreign-born population - Austria (%)
Place of birth for the foreign-born population - Belgium (%)
Place of birth for the foreign-born population - France (%)
Place of birth for the foreign-born population - Germany (%)
Place of birth for the foreign-born population - Netherlands (%)
Place of birth for the foreign-born population - Switzerland (%)
Place of birth for the foreign-born population - Other Western Europe (%)
Place of birth for the foreign-born population - Greece (%)
Place of birth for the foreign-born population - Italy (%)
Place of birth for the foreign-born population - Portugal (%)
Place of birth for the foreign-born population - Spain (%)
Place of birth for the foreign-born population - Other Southern Europe (%)
Place of birth for the foreign-born population - Albania (%)
Place of birth for the foreign-born population - Belarus (%)
Place of birth for the foreign-born population - Bosnia and Herzegovina (%)
Place of birth for the foreign-born population - Bulgaria (%)
Place of birth for the foreign-born population - Croatia (%)
Place of birth for the foreign-born population - Czechoslovakia (%)
Place of birth for the foreign-born population - Hungary (%)
Place of birth for the foreign-born population - Latvia (%)
Place of birth for the foreign-born population - Lithuania (%)
Place of birth for the foreign-born population - North Macedonia (Macedonia) (%)
Place of birth for the foreign-born population - Moldova (%)
Place of birth for the foreign-born population - Poland (%)
Place of birth for the foreign-born population - Romania (%)
Place of birth for the foreign-born population - Russia (%)
Place of birth for the foreign-born population - Serbia (%)
Place of birth for the foreign-born population - Ukraine (%)
Place of birth for the foreign-born population - Other Eastern Europe (%)
Place of birth for the foreign-born population - China (%)
Place of birth for the foreign-born population - Hong Kong (%)
Place of birth for the foreign-born population - Taiwan (%)
Place of birth for the foreign-born population - Japan (%)
Place of birth for the foreign-born population - Korea (%)
Place of birth for the foreign-born population - Other Eastern Asia (%)
Place of birth for the foreign-born population - Afghanistan (%)
Place of birth for the foreign-born population - Bangladesh (%)
Place of birth for the foreign-born population - India (%)
Place of birth for the foreign-born population - Iran (%)
Place of birth for the foreign-born population - Kazakhstan (%)
Place of birth for the foreign-born population - Nepal (%)
Place of birth for the foreign-born population - Pakistan (%)
Place of birth for the foreign-born population - Sri Lanka (%)
Place of birth for the foreign-born population - Uzbekistan (%)
Place of birth for the foreign-born population - Other South Central Asia (%)
Place of birth for the foreign-born population - Burma (%)
Place of birth for the foreign-born population - Cambodia (%)
Place of birth for the foreign-born population - Indonesia (%)
Place of birth for the foreign-born population - Laos (%)
Place of birth for the foreign-born population - Malaysia (%)
Place of birth for the foreign-born population - Philippines (%)
Place of birth for the foreign-born population - Singapore (%)
Place of birth for the foreign-born population - Thailand (%)
Place of birth for the foreign-born population - Vietnam (%)
Place of birth for the foreign-born population - Other South Eastern Asia (%)
Place of birth for the foreign-born population - Armenia (%)
Place of birth for the foreign-born population - Iraq (%)
Place of birth for the foreign-born population - Israel (%)
Place of birth for the foreign-born population - Jordan (%)
Place of birth for the foreign-born population - Kuwait (%)
Place of birth for the foreign-born population - Lebanon (%)
Place of birth for the foreign-born population - Saudi Arabia (%)
Place of birth for the foreign-born population - Syria (%)
Place of birth for the foreign-born population - Turkey (%)
Place of birth for the foreign-born population - Yemen (%)
Place of birth for the foreign-born population - Other Western Asia (%)
Place of birth for the foreign-born population - Eritrea (%)
Place of birth for the foreign-born population - Ethiopia (%)
Place of birth for the foreign-born population - Kenya (%)
Place of birth for the foreign-born population - Somalia (%)
Place of birth for the foreign-born population - Uganda (%)
Place of birth for the foreign-born population - Zimbabwe (%)
Place of birth for the foreign-born population - Other Eastern Africa (%)
Place of birth for the foreign-born population - Cameroon (%)
Place of birth for the foreign-born population - Congo (%)
Place of birth for the foreign-born population - Democratic Republic of Congo (Zaire) (%)
Place of birth for the foreign-born population - Other Middle Africa (%)
Place of birth for the foreign-born population - Egypt (%)
Place of birth for the foreign-born population - Morocco (%)
Place of birth for the foreign-born population - Sudan (%)
Place of birth for the foreign-born population - Other Northern Africa (%)
Place of birth for the foreign-born population - South Africa (%)
Place of birth for the foreign-born population - Other Southern Africa (%)
Place of birth for the foreign-born population - Cabo Verde (%)
Place of birth for the foreign-born population - Ghana (%)
Place of birth for the foreign-born population - Liberia (%)
Place of birth for the foreign-born population - Nigeria (%)
Place of birth for the foreign-born population - Senegal (%)
Place of birth for the foreign-born population - Sierra Leone (%)
Place of birth for the foreign-born population - Other Western Africa (%)
Place of birth for the foreign-born population - Australia (%)
Place of birth for the foreign-born population - New Zealand (%)
Place of birth for the foreign-born population - Fiji (%)
Place of birth for the foreign-born population - Micronesia (%)
Place of birth for the foreign-born population - Bahamas (%)
Place of birth for the foreign-born population - Barbados (%)
Place of birth for the foreign-born population - Cuba (%)
Place of birth for the foreign-born population - Dominica (%)
Place of birth for the foreign-born population - Dominican Republic (%)
Place of birth for the foreign-born population - Grenada (%)
Place of birth for the foreign-born population - Haiti (%)
Place of birth for the foreign-born population - Jamaica (%)
Place of birth for the foreign-born population - St. Vincent and the Grenadines (%)
Place of birth for the foreign-born population - Trinidad and Tobago (%)
Place of birth for the foreign-born population - West Indies (%)
Place of birth for the foreign-born population - Other Caribbean (%)
Place of birth for the foreign-born population - Belize (%)
Place of birth for the foreign-born population - Costa Rica (%)
Place of birth for the foreign-born population - El Salvador (%)
Place of birth for the foreign-born population - Guatemala (%)
Place of birth for the foreign-born population - Honduras (%)
Place of birth for the foreign-born population - Mexico (%)
Place of birth for the foreign-born population - Nicaragua (%)
Place of birth for the foreign-born population - Panama (%)
Place of birth for the foreign-born population - Other Central America (%)
Place of birth for the foreign-born population - Argentina (%)
Place of birth for the foreign-born population - Bolivia (%)
Place of birth for the foreign-born population - Brazil (%)
Place of birth for the foreign-born population - Chile (%)
Place of birth for the foreign-born population - Colombia (%)
Place of birth for the foreign-born population - Ecuador (%)
Place of birth for the foreign-born population - Guyana (%)
Place of birth for the foreign-born population - Peru (%)
Place of birth for the foreign-born population - Uruguay (%)
Place of birth for the foreign-born population - Venezuela (%)
Place of birth for the foreign-born population - Other South America (%)
Place of birth for the foreign-born population - Canada (%)
Place of birth for the foreign-born population - Other Northern America (%)
Place of birth for the foreign-born population - Other (%)
Latest news about races in Nipomo, CA collected exclusively by city-data.com from local newspapers, TV, and radio stations
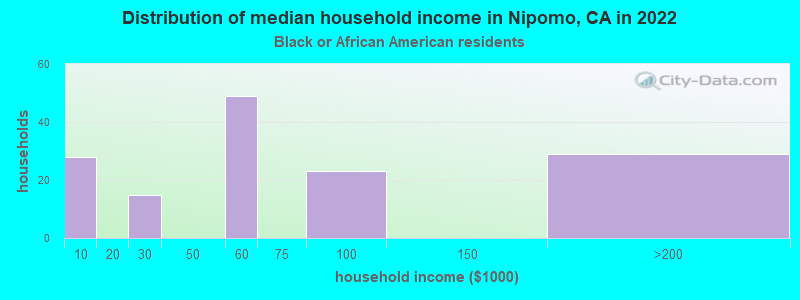
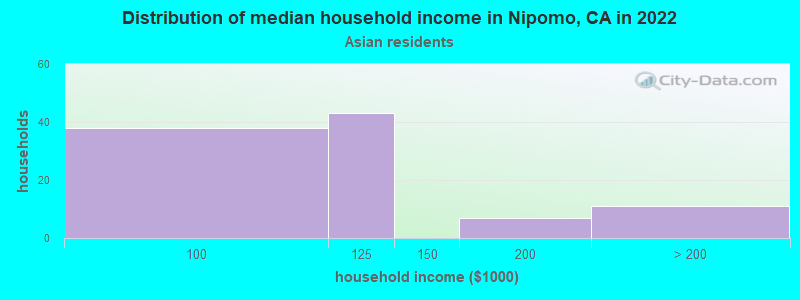
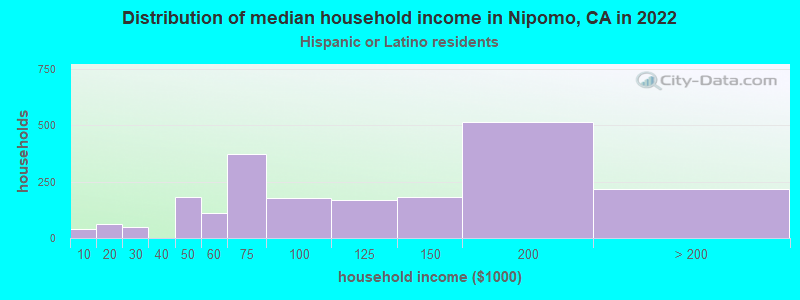
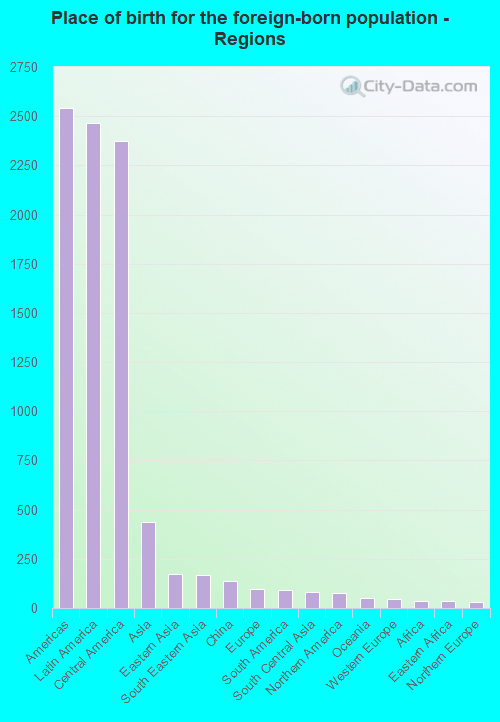
According to 2022 data, the most numerous races in Nipomo, CA are Hispanic (8,115 residents), White alone (8,054 residents), and Asian alone (535 residents). 65.0% of Nipomo residents speak English at home. 17.9% of Nipomo, CA residents are foreign-born (13.8% born in Latin America, 2.4% born in Asia), which is 45.4% less than the foreign-born rate of 26.0% across the entire state of California.
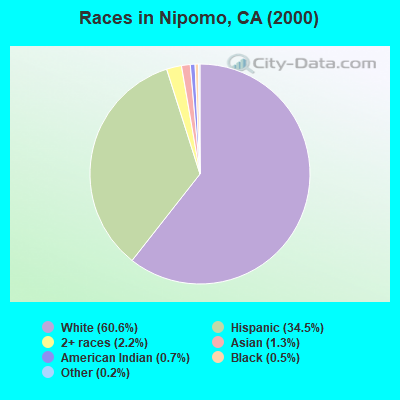
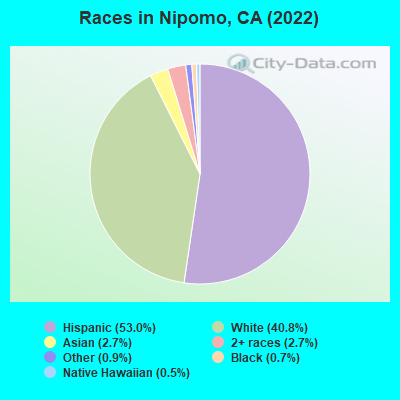
Race distribution in Nipomo
2000 2022
15,816,790 46.7% White alone 10,966,556 32.4% Hispanic 3,648,860 10.8% Asian alone 2,181,926 6.4% Black alone 903,115 2.7% Two or more races 178,984 0.5% American Indian alone 103,736 0.3% Native Hawaiian and Other 71,681 0.2% Other race alone
15,732,184 40.3% Hispanic 13,160,426 33.7% White alone 5,957,867 15.3% Asian alone 2,025,218 5.2% Black alone 1,663,222 4.3% Two or more races 251,618 0.6% Other race alone 135,777 0.3% Native Hawaiian and Other 103,030 0.3% American Indian alone
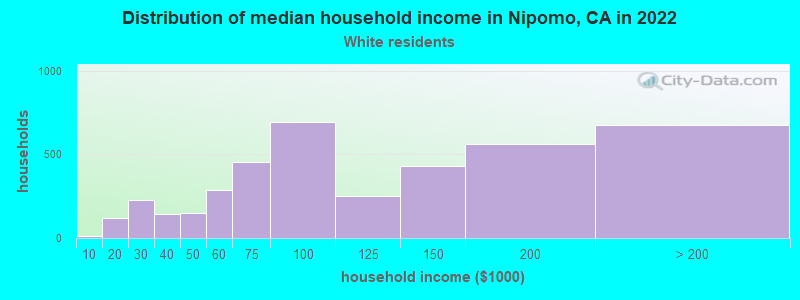
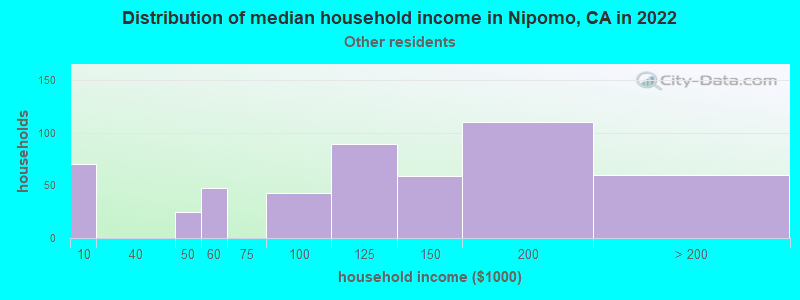
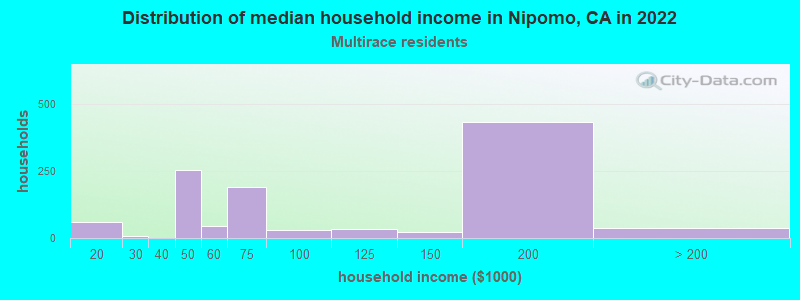
Income and house value in Nipomo Median household income in 2022 $107,143 White non-Hispanic householders$88,277 Black householders$82,993 American Indian and Alaska Native householders$127,332 Asian householders$91,942 Some other race householders$69,802 Two or more races householders$112,745 Hispanic or Latino race householdersMedian 2022 house value $826,758 White Non-Hispanic householdersover $1,000,000 Black or African American householders$764,850 American Indian or Alaska Native householders $709,421 Asian householders$614,399 Some other race householders$688,545 Two or more races householders$588,844 Hispanic or Latino householders
Median age by race in Nipomo
43.4 Median age for White residents43.4 43.0 33.8 Median age for Black or African American residents29.4 49.3 64.4 Median age for American Indian / Alaska Native residents41.3 Median age for Asian residents29.2 58.2 45.1 Median age for Other race residents32.7 52.7 24.5 Median age for Two or more races residents24.1 21.4 51.7 Median age for White alone residents50.6 52.4 31.0 Median age for Hispanic or Latino residents30.2 31.7
Owner/renter occupied households by race in Nipomo
House owners and renters - White residents 3,313 75.6% Owner occupied1,068 24.4% Renter occupiedHouse owners and renters - Black or African American residents 56 32.4% Owner occupied117 67.6% Renter occupiedHouse owners and renters - American Indian / Alaska Native residents 18 100.0% Owner occupiedHouse owners and renters - Asian residents 126 78.6% Owner occupied34 21.4% Renter occupiedHouse owners and renters - Other race residents 261 81.4% Owner occupied59 18.6% Renter occupiedHouse owners and renters - Two or more races residents 181 100.0% Owner occupiedHouse owners and renters - White alone residents 2,764 80.4% Owner occupied673 19.6% Renter occupiedHouse owners and renters - Hispanic or Latino residents 1,197 63.3% Owner occupied694 36.7% Renter occupied
Language usage in Nipomo
English speakers - Total 65.0% of residents of Nipomo speak English at home.
32.0% of residents speak Spanish at home 3,689 67.8% Speak English very well1,750 32.2% Speak English less than very well2.9% of residents speak other language at home 263 53.2% Speak English very well231 46.8% Speak English less than very well
English speakers - Born in the United States 92.2% of residents of Nipomo speak English at home.
6.2% of residents speak Spanish at home 133 100.0% Speak English very well1.5% of residents speak other language at home 32 100.0% Speak English less than very well
English speakers - Native, born elsewhere 73.3% of residents of Nipomo speak English at home.
26.7% of residents speak Spanish at home 25 71.4% Speak English very well10 28.6% Speak English less than very well
English speakers - Foreign-born 13.7% of residents of Nipomo speak English at home.
72.4% of residents speak Spanish at home 735 32.8% Speak English very well1,505 67.2% Speak English less than very well12.5% of residents speak other language at home 205 53.0% Speak English very well182 47.0% Speak English less than very well
White (Caucasian) - Speak only English Native:
82.0% (8,655)Foreign-born:
11.5% (153)
White (Caucasian) - Speak another language Native:
18.2% (1,920)Foreign-born:
86.9% (1,159)
Black or African American - Speak another language Native:
9.2% (19)Foreign-born:
100.0% (116)
Asian - Speak only English Native:
74.1% (170)Foreign-born:
19.8% (74)
Asian - Speak another language Native:
26.8% (62)Foreign-born:
81.8% (305)
Other race - Speak another language Native:
57.4% (420)Foreign-born:
99.7% (247)
Two or more races - Speak only English Native:
68.9% (946)Foreign-born:
57.9% (249)
White alone - Speak only English Native:
96.7% (7,456)Foreign-born:
42.0% (120)
White alone - Speak another language Native:
3.0% (233)Foreign-born:
58.3% (167)
Hispanic or Latino - Speak only English Native:
44.9% (2,605)Foreign-born:
3.0% (57)
Hispanic or Latino - Speak another language Native:
52.2% (3,030)Foreign-born:
96.4% (1,838)
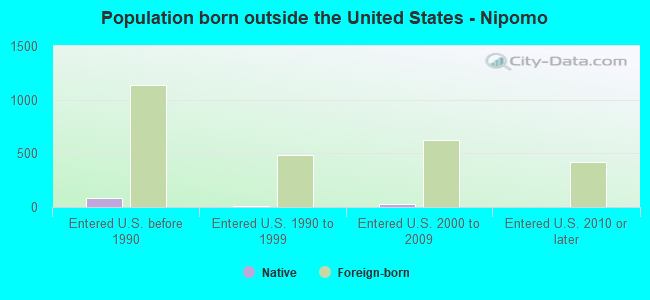
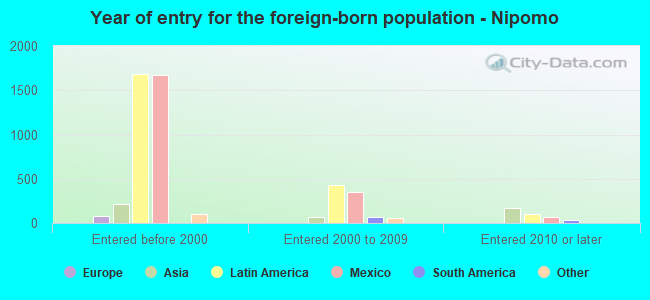
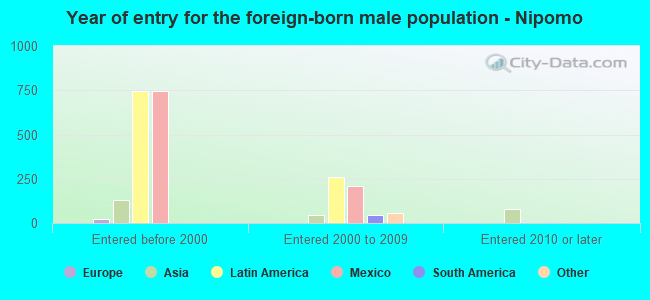
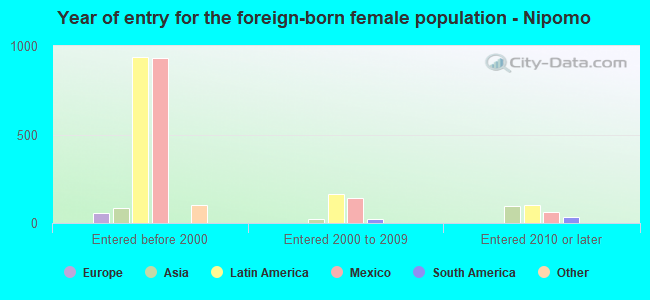
Foreign-born residents in Nipomo 3,164 residents are foreign born (13.8% Latin America , 2.4% Asia ).
This city:
17.9%California:
100.0%
Marital status for residents in Nipomo Marital status - White (Caucasian) population 15 years and over
Males 29.0% Never married58.0% Now married1.7% Separated3.3% Widowed8.0% DivorcedFemales 28.1% Never married49.2% Now married6.6% Separated6.5% Widowed9.6% DivorcedWomen who gave birth in the past 12 months Now married:
100.0% (29)Unmarried:
0.0% (0)
Women who did not give birth in the past 12 months Now married:
45.7% (1,308)Unmarried:
54.3% (1,551)
Marital status - Black or African American population 15 years and over
Males 36.0% Never married56.6% Now married7.4% Separated0.0% Widowed0.0% DivorcedFemales 17.3% Never married44.9% Now married0.0% Separated17.3% Widowed20.5% DivorcedWomen who did not give birth in the past 12 months Now married:
30.4% (20)Unmarried:
69.6% (45)
Marital status - Asian population 15 years and over
Males 44.4% Never married47.6% Now married0.0% Separated8.0% Widowed0.0% DivorcedFemales 31.0% Never married53.0% Now married0.0% Separated16.0% Widowed0.0% DivorcedWomen who gave birth in the past 12 months Now married:
100.0% (19)Unmarried:
0.0% (0)
Women who did not give birth in the past 12 months Now married:
21.2% (19)Unmarried:
78.8% (69)
Marital status - Other race population 15 years and over
Males 37.8% Never married59.4% Now married0.0% Separated0.0% Widowed2.8% DivorcedFemales 18.5% Never married44.0% Now married0.0% Separated19.6% Widowed17.9% DivorcedWomen who did not give birth in the past 12 months Now married:
50.7% (171)Unmarried:
49.3% (166)
Marital status - Two or more races population 15 years and over
Males 89.6% Never married10.4% Now married0.0% Separated0.0% Widowed0.0% DivorcedFemales 27.7% Never married72.3% Now married0.0% Separated0.0% Widowed0.0% DivorcedWomen who did not give birth in the past 12 months Now married:
60.2% (184)Unmarried:
39.8% (121)
Marital status - White alone, not Hispanic / Latino population 15 years and over
Males 23.3% Never married61.3% Now married0.0% Separated4.2% Widowed11.2% DivorcedFemales 23.1% Never married54.8% Now married3.5% Separated6.0% Widowed12.7% DivorcedWomen who gave birth in the past 12 months Now married:
100.0% (12)Unmarried:
0.0% (0)
Women who did not give birth in the past 12 months Now married:
45.6% (729)Unmarried:
54.4% (871)
Marital status - Hispanic or Latino population 15 years and over
Males 41.4% Never married51.1% Now married3.7% Separated1.4% Widowed2.5% DivorcedFemales 34.0% Never married40.5% Now married9.3% Separated9.6% Widowed6.6% DivorcedWomen who gave birth in the past 12 months Now married:
100.0% (25)Unmarried:
0.0% (0)
Women who did not give birth in the past 12 months Now married:
45.9% (1,072)Unmarried:
54.1% (1,261)
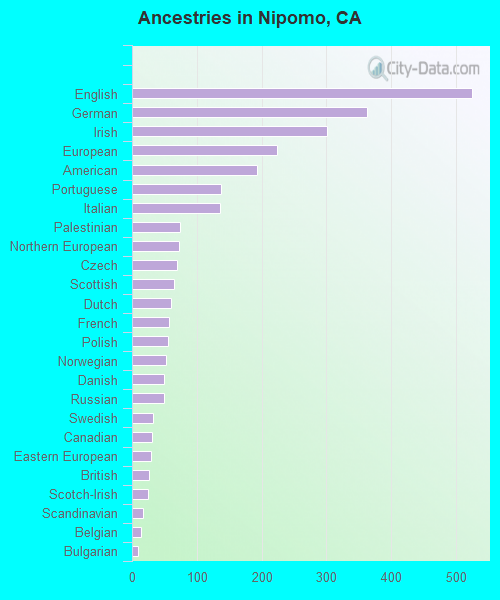
Ancestries in Nipomo
409 4.3% American345 3.6% English275 2.9% European255 2.7% Italian222 2.3% German214 2.2% Portuguese187 2.0% Irish145 1.5% Northern European127 1.3% British113 1.2% Scottish111 1.2% Polish52 0.5% Russian48 0.5% Dutch48 0.5% Norwegian44 0.5% Eastern European43 0.4% French40 0.4% Czechoslovakian29 0.3% Scotch-Irish23 0.2% Welsh20 0.2% Bulgarian19 0.2% Danish17 0.2% Scandinavian14 0.1% French Canadian12 0.1% Belgian12 0.1% Hungarian10 0.1% Czech
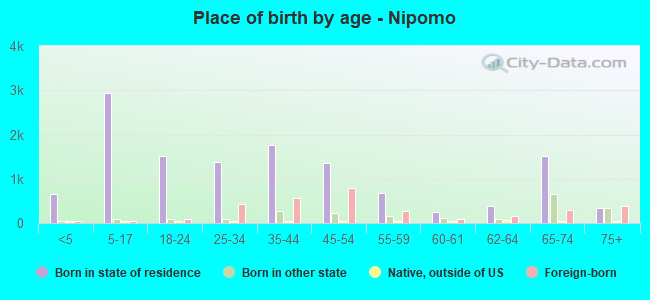
Children Nativity (place of birth) in Nipomo
Children under 6 years - Living with two parents Both parents native 298 100.0% NativeBoth parents foreign-born 51 100.0% NativeOne native, one foreign-born parent 56 100.0% NativeChildren under 6 years - Living with one parent Native parent 282 100.0% NativeForeign-born parent 27 100.0% NativeChildren 6 to 17 years - Living with two parents Both parents native 998 95.7% Native45 4.3% Foreign-bornBoth parents foreign-born 534 100.0% NativeOne native, one foreign-born parent 264 100.0% NativeChildren 6 to 17 years - Living with one parent Native parent 751 100.0% NativeForeign-born parent 154 50.0% Native155 50.0% Foreign-born
Grandparents responsible for own grandchildren in Nipomo
Grandparents (30 to 59 years) White / Caucasian 124 59.1% Responsible for grandchildren86 40.9% Not responsible for grandchildrenOther race 18 100.0% Not responsible for grandchildrenWhite alone, not Hispanic / Latino 7 100.0% Responsible for grandchildrenHispanic or Latino 116 41.5% Responsible for grandchildren163 58.5% Not responsible for grandchildrenGrandparents (60 years and over) White / Caucasian 18 11.1% Responsible for grandchildren143 88.9% Not responsible for grandchildrenOther race 105 100.0% Not responsible for grandchildrenWhite alone, not Hispanic / Latino 13 12.1% Responsible for grandchildren98 87.9% Not responsible for grandchildrenHispanic or Latino 190 100.0% Not responsible for grandchildren