Races in Nolensville, Tennessee (TN) Detailed Stats
Data:
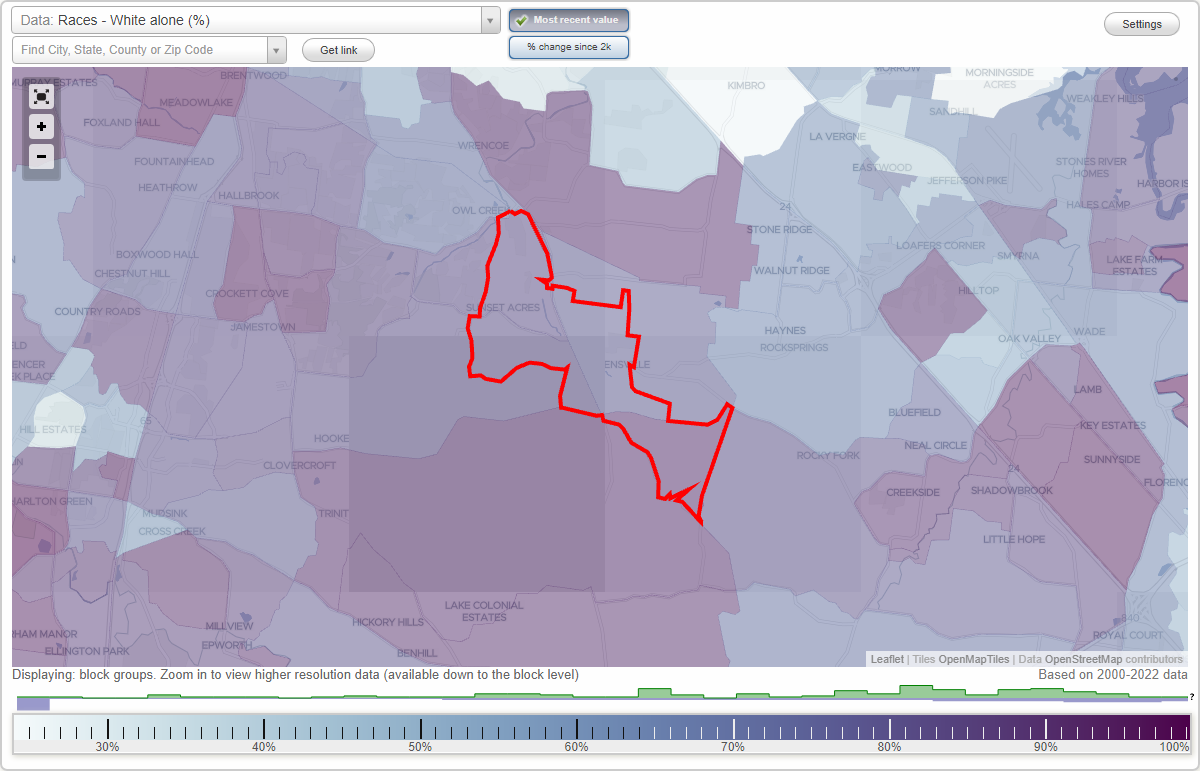
Races - White alone (%)
Races - White alone (% change since 2000)
Races - Black alone (%)
Races - Black alone (% change since 2000)
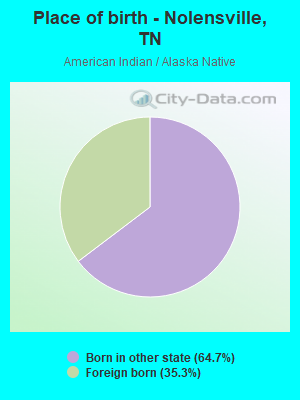
Races - American Indian alone (%)
Races - American Indian alone (% change since 2000)
Races - Asian alone (%)
Races - Asian alone (% change since 2000)
Races - Hispanic (%)
Races - Hispanic (% change since 2000)
Races - Native Hawaiian and Other Pacific Islander alone (%)
Races - Native Hawaiian and Other Pacific Islander alone (% change since 2000)
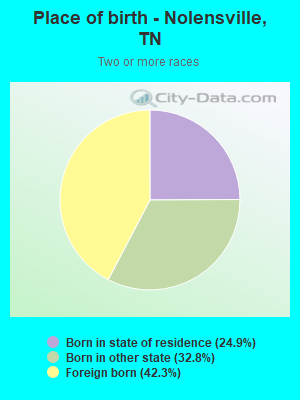
Races - Two or more races(%)
Races - Two or more races(% change since 2000)
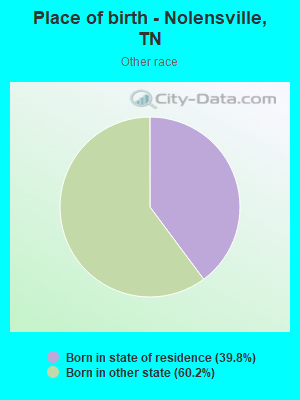
Races - Other race alone (%)
Races - Other race alone (% change since 2000)
Racial diversity
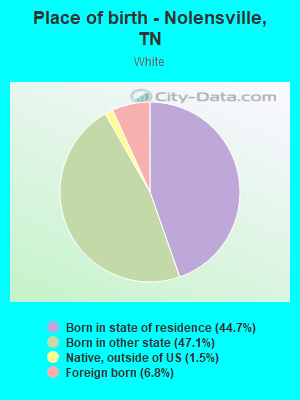
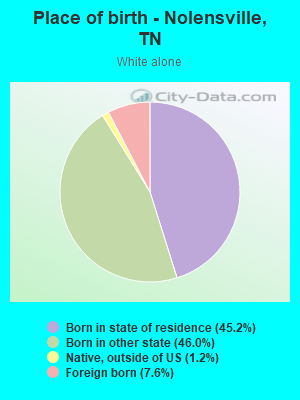
Place of birth - Born in state of residence (%)
Place of birth - Born in state of residence (%) - White
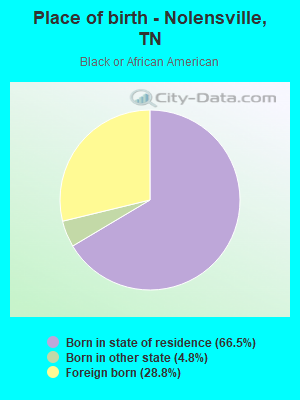
Place of birth - Born in state of residence (%) - Black or African American
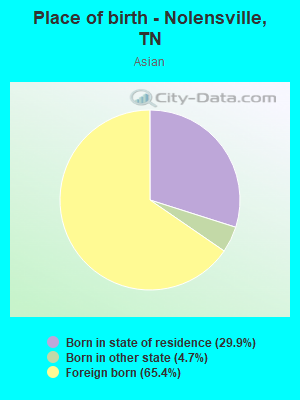
Place of birth - Born in state of residence (%) - Asian
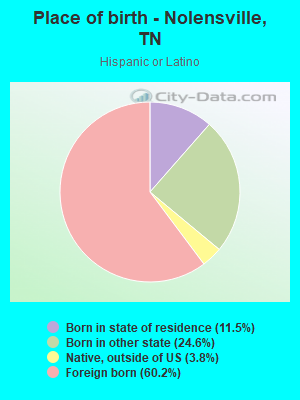
Place of birth - Born in state of residence (%) - Hispanic or Latino
Place of birth - Born in state of residence (%) - American Indian and Alaska Native
Place of birth - Born in state of residence (%) - Multirace
Place of birth - Born in state of residence (%) - Other Race
Place of birth - Born in other state (%)
Place of birth - Born in other state (%) - White
Place of birth - Born in other state (%) - Black or African American
Place of birth - Born in other state (%) - Asian
Place of birth - Born in other state (%) - Hispanic or Latino
Place of birth - Born in other state (%) - American Indian and Alaska Native
Place of birth - Born in other state (%) - Multirace
Place of birth - Born in other state (%) - Other Race
Place of birth - Native, outside of US (%)
Place of birth - Native, outside of US (%) - White
Place of birth - Native, outside of US (%) - Black or African American
Place of birth - Native, outside of US (%) - Asian
Place of birth - Native, outside of US (%) - Hispanic or Latino
Place of birth - Native, outside of US (%) - American Indian and Alaska Native
Place of birth - Native, outside of US (%) - Multirace
Place of birth - Native, outside of US (%) - Other Race
Place of birth - Foreign born (%)
Place of birth - Foreign born (%) - White
Place of birth - Foreign born (%) - Black or African American
Place of birth - Foreign born (%) - Asian
Place of birth - Foreign born (%) - Hispanic or Latino
Place of birth - Foreign born (%) - American Indian and Alaska Native
Place of birth - Foreign born (%) - Multirace
Place of birth - Foreign born (%) - Other Race
Residents speaking English at home (%)
Residents speaking English at home - Born in the United States (%)
Residents speaking English at home - Native, born elsewhere (%)
Residents speaking English at home - Foreign born (%)
Residents speaking Spanish at home (%)
Residents speaking Spanish at home - Born in the United States (%)
Residents speaking Spanish at home - Native, born elsewhere (%)
Residents speaking Spanish at home - Foreign born (%)
Residents speaking other language at home (%)
Residents speaking other language at home - Born in the United States (%)
Residents speaking other language at home - Native, born elsewhere (%)
Residents speaking other language at home - Foreign born (%)
Marital status - Never married (%)
Marital status - Now married (%)
Marital status - Separated (%)
Marital status - Widowed (%)
Marital status - Divorced (%)
Ancestries Reported - Arab (%)
Ancestries Reported - Czech (%)
Ancestries Reported - Danish (%)
Ancestries Reported - Dutch (%)
Ancestries Reported - English (%)
Ancestries Reported - French (%)
Ancestries Reported - French Canadian (%)
Ancestries Reported - German (%)
Ancestries Reported - Greek (%)
Ancestries Reported - Hungarian (%)
Ancestries Reported - Irish (%)
Ancestries Reported - Italian (%)
Ancestries Reported - Lithuanian (%)
Ancestries Reported - Norwegian (%)
Ancestries Reported - Polish (%)
Ancestries Reported - Portuguese (%)
Ancestries Reported - Russian (%)
Ancestries Reported - Scotch-Irish (%)
Ancestries Reported - Scottish (%)
Ancestries Reported - Slovak (%)
Ancestries Reported - Subsaharan African (%)
Ancestries Reported - Swedish (%)
Ancestries Reported - Swiss (%)
Ancestries Reported - Ukrainian (%)
Ancestries Reported - United States (%)
Ancestries Reported - Welsh (%)
Ancestries Reported - West Indian (%)
Ancestries Reported - Other (%)
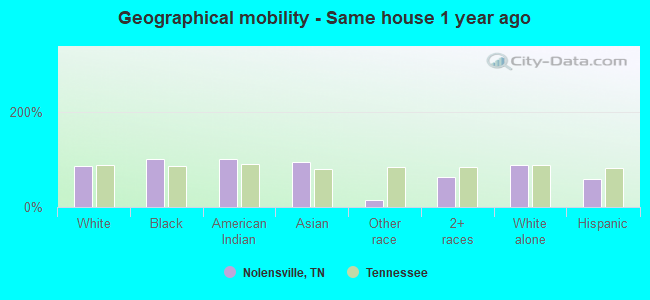
Geographical mobility - Same house 1 year ago (%)
Geographical mobility - Same house 1 year ago (%) - White
Geographical mobility - Same house 1 year ago (%) - Black or African American
Geographical mobility - Same house 1 year ago (%) - Asian
Geographical mobility - Same house 1 year ago (%) - Hispanic or Latino
Geographical mobility - Same house 1 year ago (%) - American Indian and Alaska Native
Geographical mobility - Same house 1 year ago (%) - Multirace
Geographical mobility - Same house 1 year ago (%) - Other Race
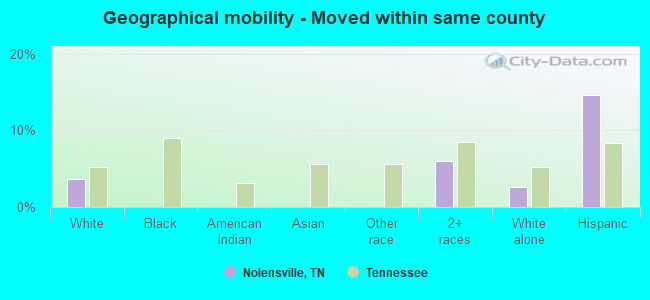
Geographical mobility - Moved within same county (%)
Geographical mobility - Moved within same county (%) - White
Geographical mobility - Moved within same county (%) - Black or African American
Geographical mobility - Moved within same county (%) - Asian
Geographical mobility - Moved within same county (%) - Hispanic or Latino
Geographical mobility - Moved within same county (%) - American Indian and Alaska Native
Geographical mobility - Moved within same county (%) - Multirace
Geographical mobility - Moved within same county (%) - Other Race
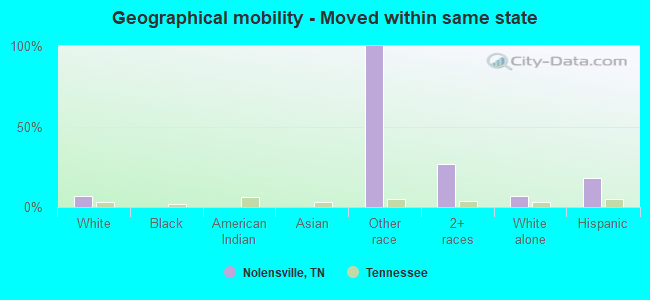
Geographical mobility - Moved from different county within same state (%)
Geographical mobility - Moved from different county within same state (%) - White
Geographical mobility - Moved from different county within same state (%) - Black or African American
Geographical mobility - Moved from different county within same state (%) - Asian
Geographical mobility - Moved from different county within same state (%) - Hispanic or Latino
Geographical mobility - Moved from different county within same state (%) - American Indian and Alaska Native
Geographical mobility - Moved from different county within same state (%) - Multirace
Geographical mobility - Moved from different county within same state (%) - Other Race
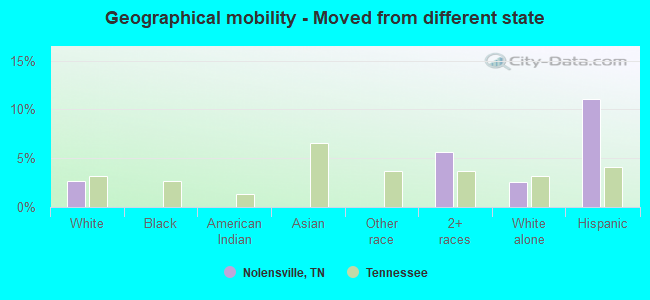
Geographical mobility - Moved from different state (%)
Geographical mobility - Moved from different state (%) - White
Geographical mobility - Moved from different state (%) - Black or African American
Geographical mobility - Moved from different state (%) - Asian
Geographical mobility - Moved from different state (%) - Hispanic or Latino
Geographical mobility - Moved from different state (%) - American Indian and Alaska Native
Geographical mobility - Moved from different state (%) - Multirace
Geographical mobility - Moved from different state (%) - Other Race
Geographical mobility - Moved from abroad (%)
Geographical mobility - Moved from abroad (%) - White
Geographical mobility - Moved from abroad (%) - Black or African American
Geographical mobility - Moved from abroad (%) - Asian
Geographical mobility - Moved from abroad (%) - Hispanic or Latino
Geographical mobility - Moved from abroad (%) - American Indian and Alaska Native
Geographical mobility - Moved from abroad (%) - Multirace
Geographical mobility - Moved from abroad (%) - Other Race
Place of birth for the foreign-born population - Ireland (%)
Place of birth for the foreign-born population - Denmark (%)
Place of birth for the foreign-born population - Norway (%)
Place of birth for the foreign-born population - Sweden (%)
Place of birth for the foreign-born population - United Kingdom (%)
Place of birth for the foreign-born population - England (%)
Place of birth for the foreign-born population - Scotland (%)
Place of birth for the foreign-born population - Other Northern Europe (%)
Place of birth for the foreign-born population - Austria (%)
Place of birth for the foreign-born population - Belgium (%)
Place of birth for the foreign-born population - France (%)
Place of birth for the foreign-born population - Germany (%)
Place of birth for the foreign-born population - Netherlands (%)
Place of birth for the foreign-born population - Switzerland (%)
Place of birth for the foreign-born population - Other Western Europe (%)
Place of birth for the foreign-born population - Greece (%)
Place of birth for the foreign-born population - Italy (%)
Place of birth for the foreign-born population - Portugal (%)
Place of birth for the foreign-born population - Spain (%)
Place of birth for the foreign-born population - Other Southern Europe (%)
Place of birth for the foreign-born population - Albania (%)
Place of birth for the foreign-born population - Belarus (%)
Place of birth for the foreign-born population - Bosnia and Herzegovina (%)
Place of birth for the foreign-born population - Bulgaria (%)
Place of birth for the foreign-born population - Croatia (%)
Place of birth for the foreign-born population - Czechoslovakia (%)
Place of birth for the foreign-born population - Hungary (%)
Place of birth for the foreign-born population - Latvia (%)
Place of birth for the foreign-born population - Lithuania (%)
Place of birth for the foreign-born population - North Macedonia (Macedonia) (%)
Place of birth for the foreign-born population - Moldova (%)
Place of birth for the foreign-born population - Poland (%)
Place of birth for the foreign-born population - Romania (%)
Place of birth for the foreign-born population - Russia (%)
Place of birth for the foreign-born population - Serbia (%)
Place of birth for the foreign-born population - Ukraine (%)
Place of birth for the foreign-born population - Other Eastern Europe (%)
Place of birth for the foreign-born population - China (%)
Place of birth for the foreign-born population - Hong Kong (%)
Place of birth for the foreign-born population - Taiwan (%)
Place of birth for the foreign-born population - Japan (%)
Place of birth for the foreign-born population - Korea (%)
Place of birth for the foreign-born population - Other Eastern Asia (%)
Place of birth for the foreign-born population - Afghanistan (%)
Place of birth for the foreign-born population - Bangladesh (%)
Place of birth for the foreign-born population - India (%)
Place of birth for the foreign-born population - Iran (%)
Place of birth for the foreign-born population - Kazakhstan (%)
Place of birth for the foreign-born population - Nepal (%)
Place of birth for the foreign-born population - Pakistan (%)
Place of birth for the foreign-born population - Sri Lanka (%)
Place of birth for the foreign-born population - Uzbekistan (%)
Place of birth for the foreign-born population - Other South Central Asia (%)
Place of birth for the foreign-born population - Burma (%)
Place of birth for the foreign-born population - Cambodia (%)
Place of birth for the foreign-born population - Indonesia (%)
Place of birth for the foreign-born population - Laos (%)
Place of birth for the foreign-born population - Malaysia (%)
Place of birth for the foreign-born population - Philippines (%)
Place of birth for the foreign-born population - Singapore (%)
Place of birth for the foreign-born population - Thailand (%)
Place of birth for the foreign-born population - Vietnam (%)
Place of birth for the foreign-born population - Other South Eastern Asia (%)
Place of birth for the foreign-born population - Armenia (%)
Place of birth for the foreign-born population - Iraq (%)
Place of birth for the foreign-born population - Israel (%)
Place of birth for the foreign-born population - Jordan (%)
Place of birth for the foreign-born population - Kuwait (%)
Place of birth for the foreign-born population - Lebanon (%)
Place of birth for the foreign-born population - Saudi Arabia (%)
Place of birth for the foreign-born population - Syria (%)
Place of birth for the foreign-born population - Turkey (%)
Place of birth for the foreign-born population - Yemen (%)
Place of birth for the foreign-born population - Other Western Asia (%)
Place of birth for the foreign-born population - Eritrea (%)
Place of birth for the foreign-born population - Ethiopia (%)
Place of birth for the foreign-born population - Kenya (%)
Place of birth for the foreign-born population - Somalia (%)
Place of birth for the foreign-born population - Uganda (%)
Place of birth for the foreign-born population - Zimbabwe (%)
Place of birth for the foreign-born population - Other Eastern Africa (%)
Place of birth for the foreign-born population - Cameroon (%)
Place of birth for the foreign-born population - Congo (%)
Place of birth for the foreign-born population - Democratic Republic of Congo (Zaire) (%)
Place of birth for the foreign-born population - Other Middle Africa (%)
Place of birth for the foreign-born population - Egypt (%)
Place of birth for the foreign-born population - Morocco (%)
Place of birth for the foreign-born population - Sudan (%)
Place of birth for the foreign-born population - Other Northern Africa (%)
Place of birth for the foreign-born population - South Africa (%)
Place of birth for the foreign-born population - Other Southern Africa (%)
Place of birth for the foreign-born population - Cabo Verde (%)
Place of birth for the foreign-born population - Ghana (%)
Place of birth for the foreign-born population - Liberia (%)
Place of birth for the foreign-born population - Nigeria (%)
Place of birth for the foreign-born population - Senegal (%)
Place of birth for the foreign-born population - Sierra Leone (%)
Place of birth for the foreign-born population - Other Western Africa (%)
Place of birth for the foreign-born population - Australia (%)
Place of birth for the foreign-born population - New Zealand (%)
Place of birth for the foreign-born population - Fiji (%)
Place of birth for the foreign-born population - Micronesia (%)
Place of birth for the foreign-born population - Bahamas (%)
Place of birth for the foreign-born population - Barbados (%)
Place of birth for the foreign-born population - Cuba (%)
Place of birth for the foreign-born population - Dominica (%)
Place of birth for the foreign-born population - Dominican Republic (%)
Place of birth for the foreign-born population - Grenada (%)
Place of birth for the foreign-born population - Haiti (%)
Place of birth for the foreign-born population - Jamaica (%)
Place of birth for the foreign-born population - St. Vincent and the Grenadines (%)
Place of birth for the foreign-born population - Trinidad and Tobago (%)
Place of birth for the foreign-born population - West Indies (%)
Place of birth for the foreign-born population - Other Caribbean (%)
Place of birth for the foreign-born population - Belize (%)
Place of birth for the foreign-born population - Costa Rica (%)
Place of birth for the foreign-born population - El Salvador (%)
Place of birth for the foreign-born population - Guatemala (%)
Place of birth for the foreign-born population - Honduras (%)
Place of birth for the foreign-born population - Mexico (%)
Place of birth for the foreign-born population - Nicaragua (%)
Place of birth for the foreign-born population - Panama (%)
Place of birth for the foreign-born population - Other Central America (%)
Place of birth for the foreign-born population - Argentina (%)
Place of birth for the foreign-born population - Bolivia (%)
Place of birth for the foreign-born population - Brazil (%)
Place of birth for the foreign-born population - Chile (%)
Place of birth for the foreign-born population - Colombia (%)
Place of birth for the foreign-born population - Ecuador (%)
Place of birth for the foreign-born population - Guyana (%)
Place of birth for the foreign-born population - Peru (%)
Place of birth for the foreign-born population - Uruguay (%)
Place of birth for the foreign-born population - Venezuela (%)
Place of birth for the foreign-born population - Other South America (%)
Place of birth for the foreign-born population - Canada (%)
Place of birth for the foreign-born population - Other Northern America (%)
Place of birth for the foreign-born population - Other (%)
Latest news about races in Nolensville, TN collected exclusively by city-data.com from local newspapers, TV, and radio stations
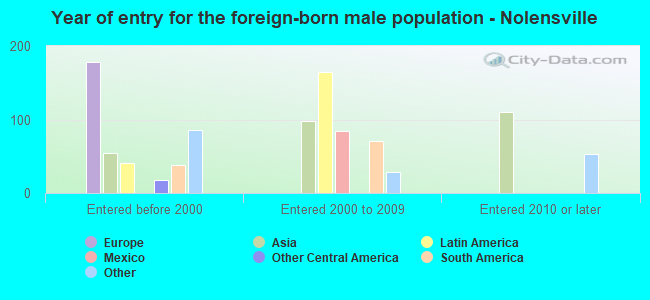
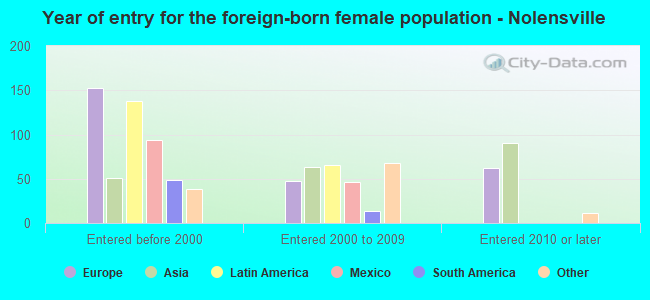
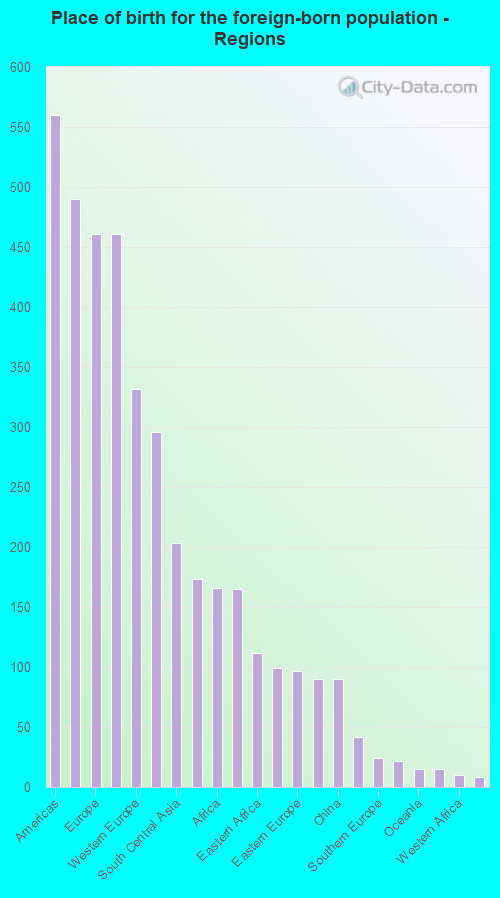
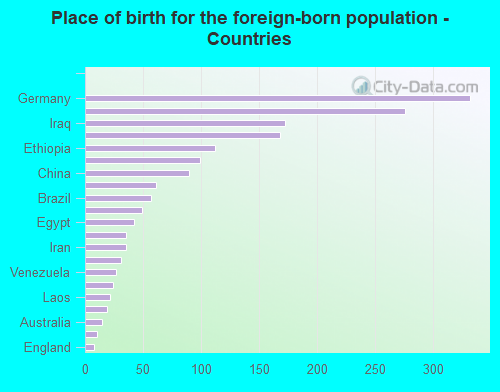
According to 2022 data, the most numerous races in Nolensville, TN are White alone (12,325 residents), Black alone (497 residents), and Hispanic (887 residents). 88.2% of Nolensville residents speak English at home. 11.2% of Nolensville, TN residents are foreign-born (3.3% born in Asia, 3.1% born in Europe, 3.1% born in Latin America), which is 55.4% greater than the foreign-born rate of 5.0% across the entire state of Tennessee.
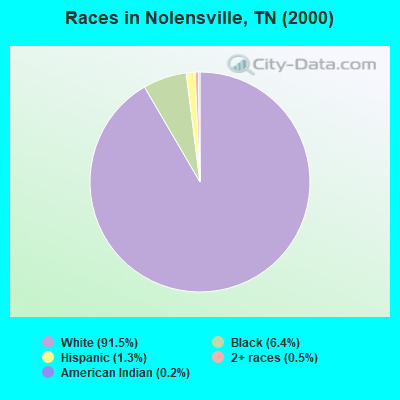
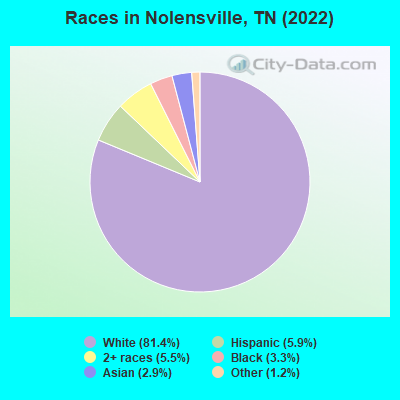
Race distribution in Nolensville
2000 2022
4,505,930 79.2% White alone 928,204 16.3% Black alone 123,838 2.2% Hispanic 54,824 1.0% Two or more races 56,077 1.0% Asian alone 13,820 0.2% American Indian alone 4,780 0.08% Other race alone 1,810 0.03% Native Hawaiian and Other
5,070,026 71.9% White alone 1,089,738 15.5% Black alone 442,629 6.3% Hispanic 279,381 4.0% Two or more races 131,817 1.9% Asian alone 26,972 0.4% Other race alone 6,387 0.09% American Indian alone 4,389 0.06% Native Hawaiian and Other
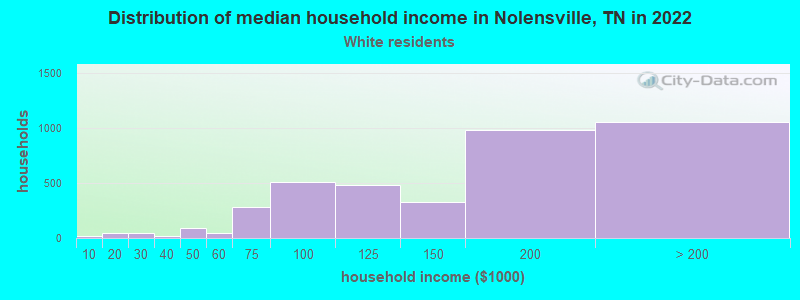
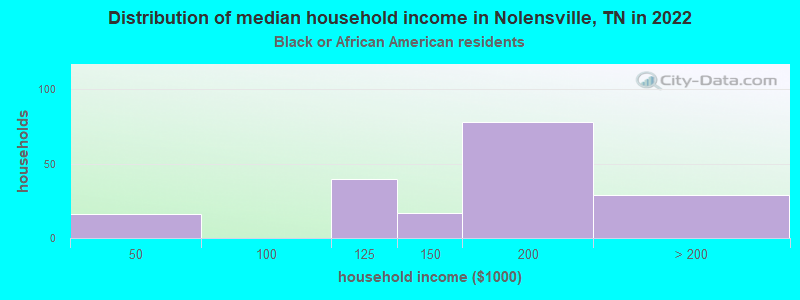
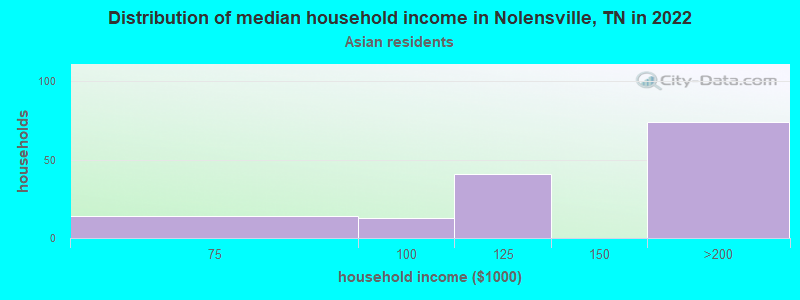
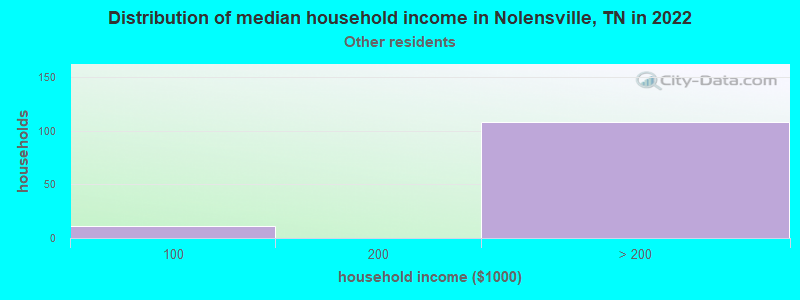
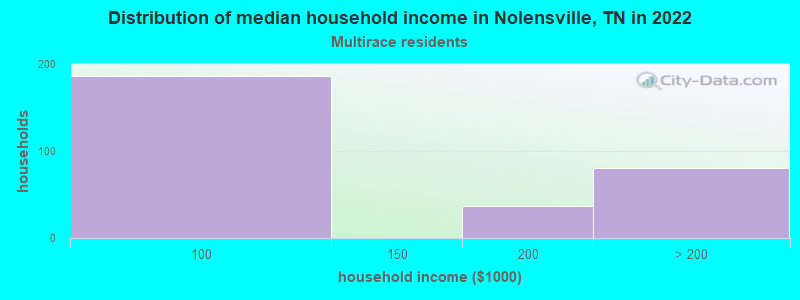
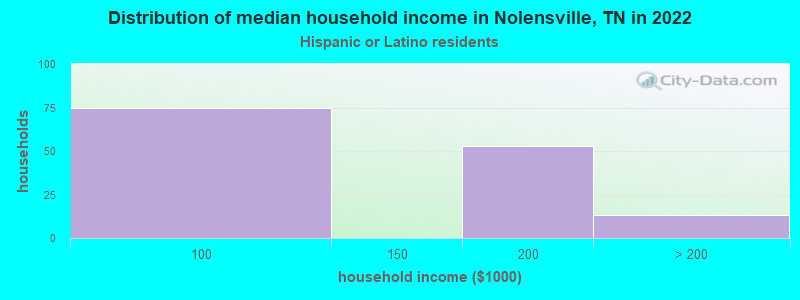
Income and house value in Nolensville Median household income in 2022 $155,109 White non-Hispanic householders$180,883 Black householders$151,392 Asian householdersMedian 2022 house value $737,730 White Non-Hispanic householders$237,401 Black or African American householders $584,994 Asian householders$691,356 Some other race householders$518,624 Hispanic or Latino householders
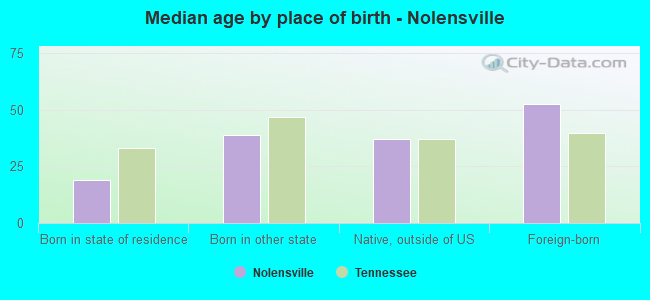
Median age by race in Nolensville
34.6 Median age for White residents34.5 34.7 41.7 Median age for Black or African American residents49.7 39.2 6.8 Median age for American Indian / Alaska Native residents-875,213,674.3 -530,496,453.4 38.0 Median age for Asian residents37.0 33.3 -666,666,666.0 Median age for Native Hawaiian / Pacific Islander residents-666,666,666.0 -735,930,735.2 58.2 Median age for Other race residents64.8 56.6 45.4 Median age for Two or more races residents45.6 37.2 34.6 Median age for White alone residents34.6 34.7 44.2 Median age for Hispanic or Latino residents20.5 57.4
Owner/renter occupied households by race in Nolensville
House owners and renters - White residents 3,635 94.0% Owner occupied233 6.0% Renter occupiedHouse owners and renters - Black or African American residents 220 100.0% Owner occupiedHouse owners and renters - Asian residents 160 100.0% Owner occupiedHouse owners and renters - Other race residents 87 80.6% Owner occupied21 19.4% Renter occupiedHouse owners and renters - Two or more races residents 175 63.5% Owner occupied101 36.5% Renter occupiedHouse owners and renters - White alone residents 3,611 93.9% Owner occupied236 6.1% Renter occupiedHouse owners and renters - Hispanic or Latino residents 40 29.1% Owner occupied99 70.9% Renter occupied
Language usage in Nolensville
English speakers - Total 88.2% of residents of Nolensville speak English at home.
3.6% of residents speak Spanish at home 334 66.4% Speak English very well169 33.6% Speak English less than very well8.4% of residents speak other language at home 1,098 93.4% Speak English very well78 6.6% Speak English less than very well
English speakers - Born in the United States 98.8% of residents of Nolensville speak English at home.
0.3% of residents speak Spanish at home 18 100.0% Speak English very well1.0% of residents speak other language at home 62 100.0% Speak English very well
All residents speak only English at home
English speakers - Foreign-born 32.6% of residents of Nolensville speak English at home.
23.6% of residents speak Spanish at home 275 61.0% Speak English very well176 39.0% Speak English less than very well41.2% of residents speak other language at home 734 93.0% Speak English very well55 7.0% Speak English less than very well
White (Caucasian) - Speak only English Native:
98.5% (10,454)Foreign-born:
75.9% (644)
White (Caucasian) - Speak another language Native:
1.5% (164)Foreign-born:
26.9% (228)
Black or African American - Speak only English Native:
67.0% (229)Foreign-born:
9.0% (11)
Black or African American - Speak another language Native:
34.4% (117)Foreign-born:
88.9% (108)
American Indian / Alaska Native - Speak only English Native:
87.7% (21)Foreign-born:
79.1% (33)
Asian - Speak another language Native:
48.3% (44)Foreign-born:
100.0% (276)
Two or more races - Speak another language Native:
12.2% (102)Foreign-born:
100.0% (601)
White alone - Speak only English Native:
98.6% (10,297)Foreign-born:
69.7% (656)
White alone - Speak another language Native:
1.4% (144)Foreign-born:
30.3% (285)
Hispanic or Latino - Speak only English Native:
71.1% (254)Foreign-born:
7.0% (35)
Hispanic or Latino - Speak another language Native:
23.1% (82)Foreign-born:
93.1% (473)
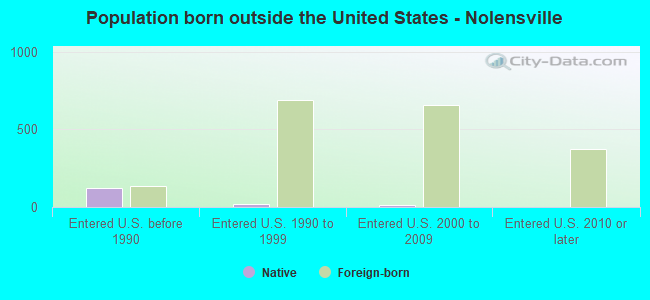
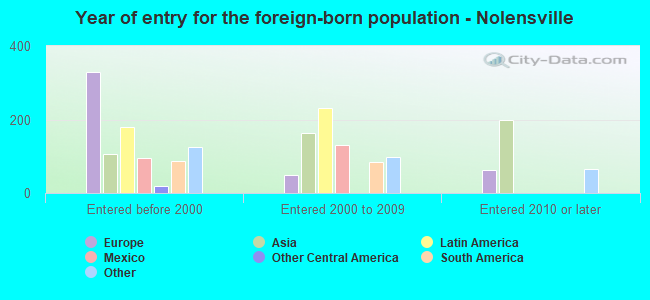
Foreign-born residents in Nolensville 1,695 residents are foreign born (3.3% Asia , 3.1% Europe , 3.1% Latin America ).
This city:
11.2%Tennessee:
5.4%
Marital status for residents in Nolensville Marital status - White (Caucasian) population 15 years and over
Males 27.0% Never married68.6% Now married0.0% Separated0.2% Widowed4.2% DivorcedFemales 24.9% Never married61.0% Now married1.2% Separated2.8% Widowed10.1% DivorcedWomen who gave birth in the past 12 months Now married:
100.0% (188)Unmarried:
0.0% (0)
Women who did not give birth in the past 12 months Now married:
57.5% (1,710)Unmarried:
42.5% (1,265)
Marital status - Black or African American population 15 years and over
Males 0.0% Never married58.8% Now married0.0% Separated0.0% Widowed41.2% DivorcedFemales 13.4% Never married52.1% Now married0.0% Separated9.9% Widowed24.6% DivorcedWomen who did not give birth in the past 12 months Now married:
20.6% (14)Unmarried:
79.4% (52)
Marital status - Asian population 15 years and over
Males 0.0% Never married100.0% Now married0.0% Separated0.0% Widowed0.0% DivorcedFemales 16.2% Never married83.8% Now married0.0% Separated0.0% Widowed0.0% DivorcedWomen who did not give birth in the past 12 months Now married:
77.5% (103)Unmarried:
22.5% (30)
Marital status - Other race population 15 years and over
Males 24.8% Never married75.2% Now married0.0% Separated0.0% Widowed0.0% DivorcedFemales 40.7% Never married59.3% Now married0.0% Separated0.0% Widowed0.0% DivorcedWomen who did not give birth in the past 12 months Now married:
0.0% (0)Unmarried:
100.0% (44)
Marital status - Two or more races population 15 years and over
Males 14.9% Never married66.6% Now married0.0% Separated0.0% Widowed18.6% DivorcedFemales 43.8% Never married56.2% Now married0.0% Separated0.0% Widowed0.0% DivorcedWomen who gave birth in the past 12 months Now married:
0.0% (0)Unmarried:
100.0% (32)
Women who did not give birth in the past 12 months Now married:
40.7% (197)Unmarried:
59.3% (288)
Marital status - White alone, not Hispanic / Latino population 15 years and over
Males 26.7% Never married68.8% Now married0.0% Separated0.2% Widowed4.3% DivorcedFemales 24.9% Never married61.7% Now married1.2% Separated2.9% Widowed9.4% DivorcedWomen who gave birth in the past 12 months Now married:
100.0% (191)Unmarried:
0.0% (0)
Women who did not give birth in the past 12 months Now married:
57.4% (1,697)Unmarried:
42.6% (1,257)
Marital status - Hispanic or Latino population 15 years and over
Males 34.1% Never married65.9% Now married0.0% Separated0.0% Widowed0.0% DivorcedFemales 9.1% Never married75.6% Now married0.0% Separated0.0% Widowed15.3% DivorcedWomen who did not give birth in the past 12 months Now married:
70.5% (75)Unmarried:
29.5% (31)
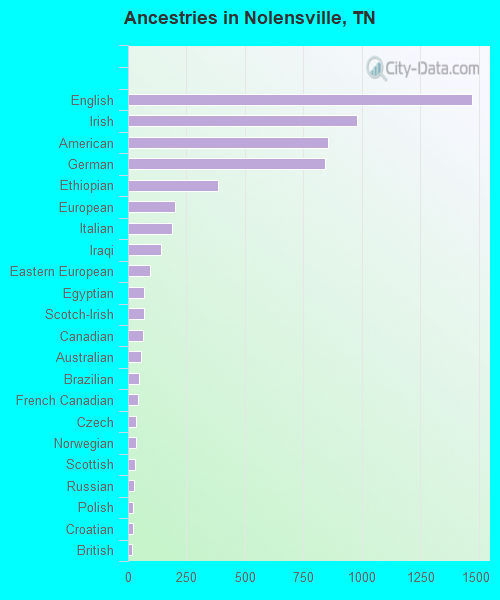
Ancestries in Nolensville
1,470 19.8% English980 13.2% Irish857 11.6% American843 11.4% German386 5.2% Ethiopian203 2.7% European190 2.6% Italian139 1.9% Iraqi95 1.3% Eastern European70 0.9% Egyptian68 0.9% Scotch-Irish63 0.9% Canadian55 0.7% Australian49 0.7% Brazilian41 0.6% French Canadian36 0.5% Czech33 0.4% Norwegian28 0.4% Scottish27 0.4% Russian21 0.3% Polish20 0.3% Croatian17 0.2% British13 0.2% Dutch12 0.2% Scandinavian10 0.1% Iranian10 0.1% Ukrainian6 0.08% African5 0.07% Ghanaian
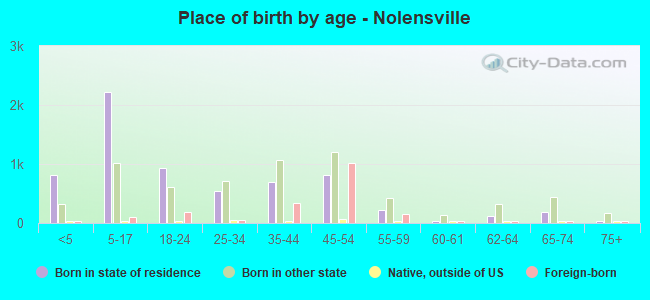
Children Nativity (place of birth) in Nolensville
Children under 6 years - Living with two parents Both parents native 1,150 100.0% NativeBoth parents foreign-born 164 100.0% NativeOne native, one foreign-born parent 30 100.0% NativeChildren under 6 years - Living with one parent Native parent 51 100.0% NativeChildren 6 to 17 years - Living with two parents Both parents native 2,140 99.6% Native8 0.4% Foreign-bornBoth parents foreign-born 143 58.6% Native101 41.4% Foreign-bornOne native, one foreign-born parent 16 100.0% NativeChildren 6 to 17 years - Living with one parent Native parent 466 100.0% NativeForeign-born parent 142 46.5% Native164 53.5% Foreign-born
Grandparents responsible for own grandchildren in Nolensville
Grandparents (30 to 59 years) White / Caucasian 32 100.0% Not responsible for grandchildrenAsian 12 100.0% Not responsible for grandchildrenWhite alone, not Hispanic / Latino 33 100.0% Not responsible for grandchildrenGrandparents (60 years and over) White / Caucasian 9 5.4% Responsible for grandchildren152 94.6% Not responsible for grandchildrenWhite alone, not Hispanic / Latino 9 5.4% Responsible for grandchildren153 94.6% Not responsible for grandchildren