Races in North Craig, Oklahoma (OK) Detailed Stats
Ancestries, Foreign-born residents, place of birth
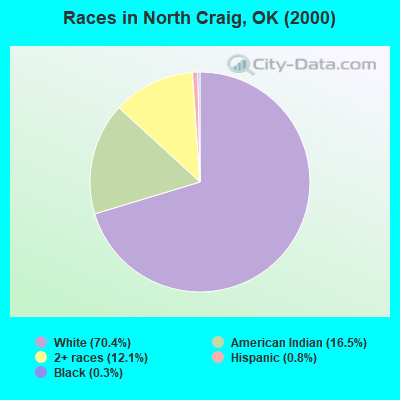
Race distribution in North Craig

- 2,09170.4%White alone
- 49016.5%American Indian alone
- 35912.1%Two or more races
- 240.8%Hispanic
- 80.3%Black alone
2000
2022
-
- 2,556,36874.1%White alone
- 266,1587.7%American Indian alone
- 257,9817.5%Black alone
- 179,3045.2%Hispanic
- 140,2494.1%Two or more races
- 46,1721.3%Asian alone
- 2,3220.07%Other race alone
- 2,1000.06%Native Hawaiian and Other
Pacific Islander alone

-
- 2,517,40362.6%White alone
- 486,69212.1%Hispanic
- 364,4539.1%Two or more races
- 273,6506.8%American Indian alone
- 268,5436.7%Black alone
- 92,6722.3%Asian alone
- 10,7860.3%Other race alone
- 5,6010.1%Native Hawaiian and Other
Pacific Islander alone

Income and house value in North Craig
- Median household income in 2022
- $59,125White non-Hispanic householders
- $52,888American Indian and Alaska Native householders
- $79,490Some other race householders
- $62,244Two or more races householders
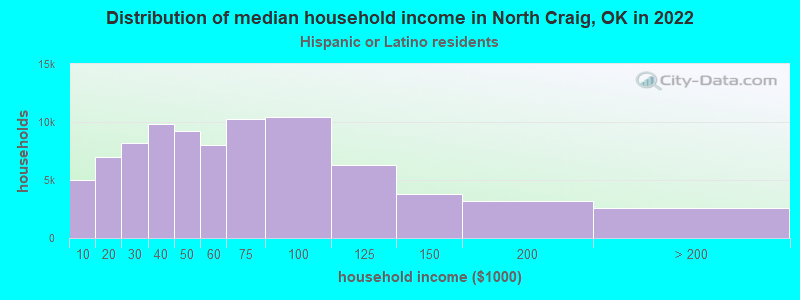
- $78,226Hispanic or Latino race householders
- Median 2022 house value
- $97,003White Non-Hispanic householders
- $100,027American Indian or Alaska Native householders
- $86,070Two or more races householders
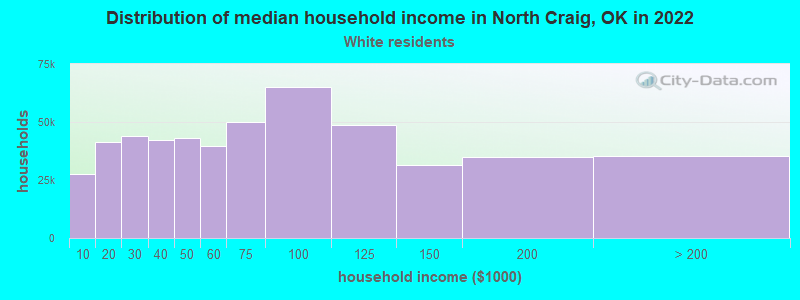
Household income for White non-Hispanic householders
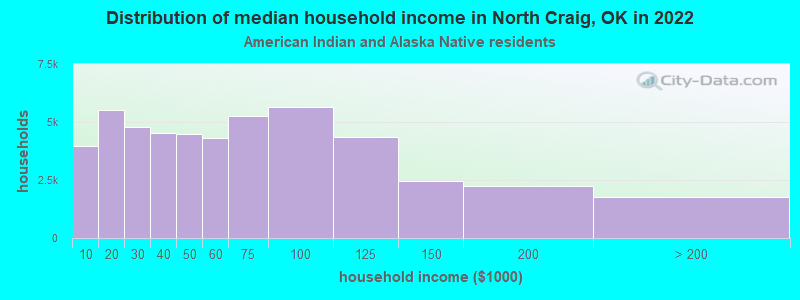
Household income for American Indian and Alaska Native householders
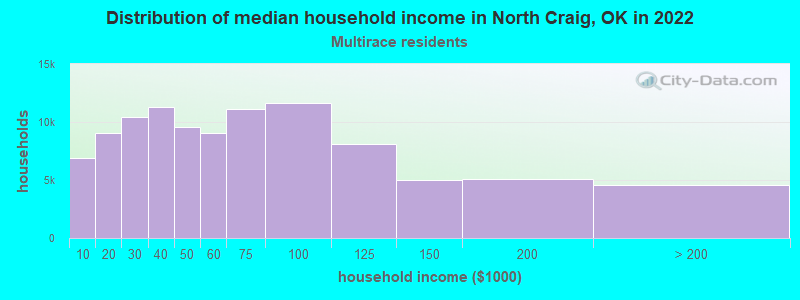
Household income for Two or more races householders
Household income for Hispanic or Latino race householders
Zip code: 74369