Races in North Elba, New York (NY) Detailed Stats
Ancestries, Foreign-born residents, place of birth

Recent posts about races in North Elba, New York on our local forum with over 2,400,000 registered users:
 | smaller Upstate NY cities and towns/African American communities (5993 replies) |
| First time visiting the Adirondacks? What to experience in this famous New York state park (174 replies) |
| Underground Railroad towns in NY..... (19 replies) |
| Vacation lake communities (5 replies) |
8.1% of North Elba, NY residents are foreign-born (3.5% born in Latin America, 2.9% born in Europe, 1.0% born in Asia), which is 172.6% less than the foreign-born rate of 22.0% across the entire state of New York.
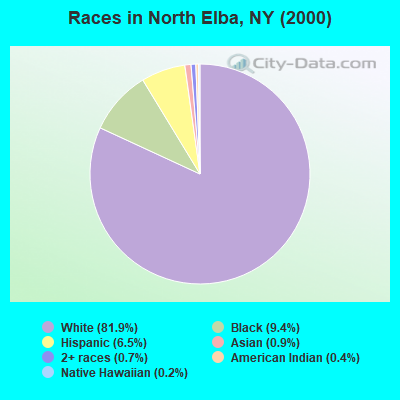
Race distribution in North Elba

- 7,09081.9%White alone
- 8189.4%Black alone
- 5646.5%Hispanic
- 740.9%Asian alone
- 570.7%Two or more races
- 340.4%American Indian alone
- 160.2%Native Hawaiian and Other
Pacific Islander alone - 80.09%Other race alone
2000
2022
-
- 11,760,98162.0%White alone
- 2,867,58315.1%Hispanic
- 2,812,62314.8%Black alone
- 1,035,9265.5%Asian alone
- 366,1161.9%Two or more races
- 75,4990.4%Other race alone
- 52,4990.3%American Indian alone
- 5,2300.03%Native Hawaiian and Other
Pacific Islander alone

-
- 10,408,93352.9%White alone
- 3,867,29919.7%Hispanic
- 2,633,84013.4%Black alone
- 1,776,2869.0%Asian alone
- 732,6703.7%Two or more races
- 216,1101.1%Other race alone
- 35,0820.2%American Indian alone
- 6,9310.04%Native Hawaiian and Other
Pacific Islander alone

Income and house value in North Elba
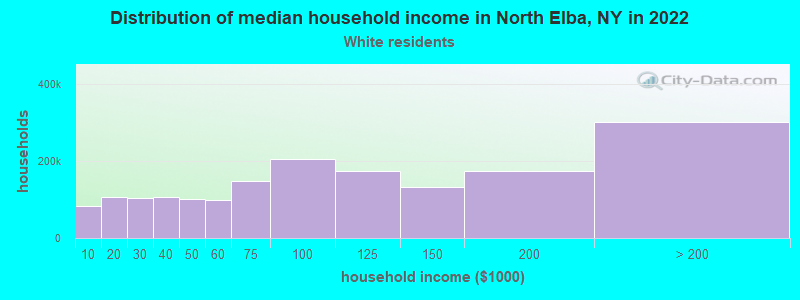
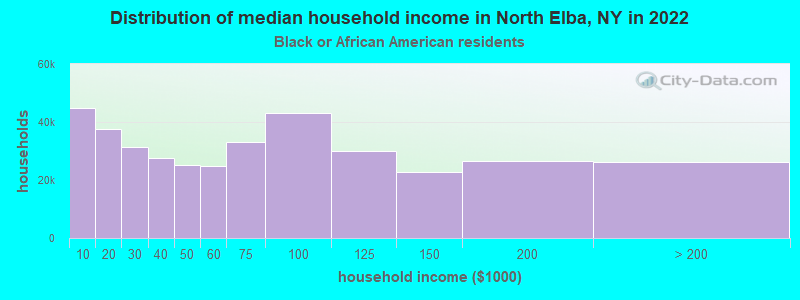
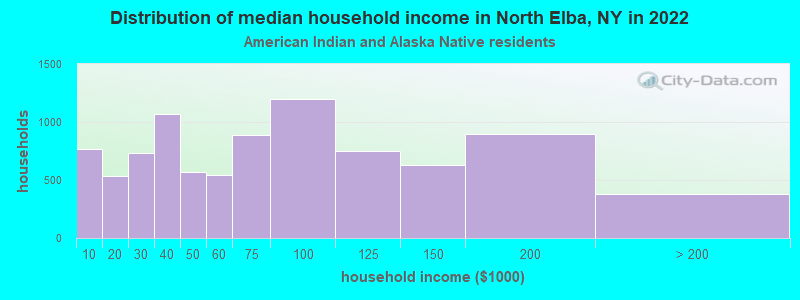
- Median household income in 2022
- $64,762White non-Hispanic householders
- $42,065Black householders
- $26,278American Indian and Alaska Native householders
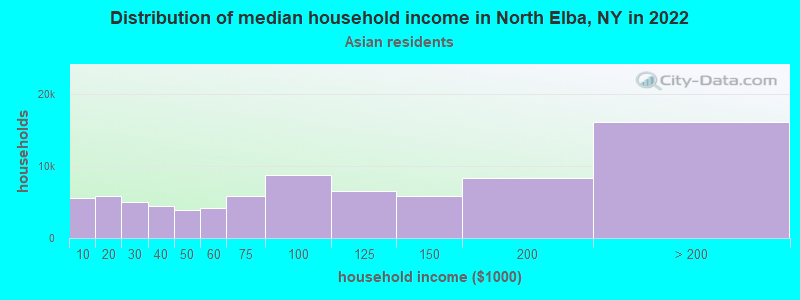
- $22,258Asian householders
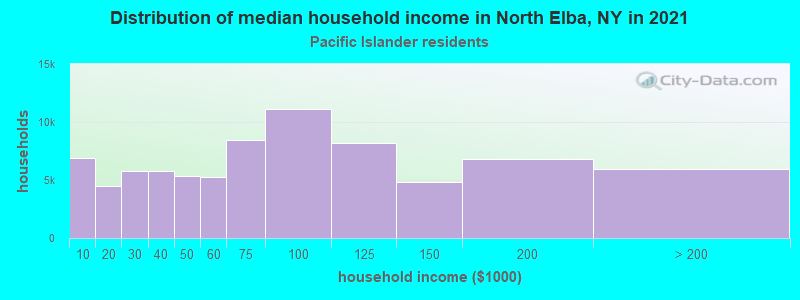
- $29,212Native Hawaiian and other Pacific Islander householders
- $84,243Some other race householders
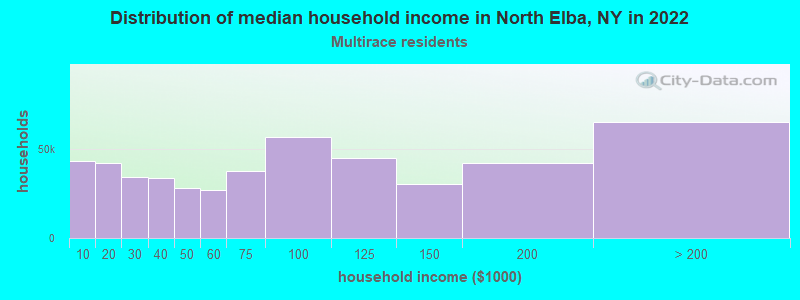
- $107,442Two or more races householders
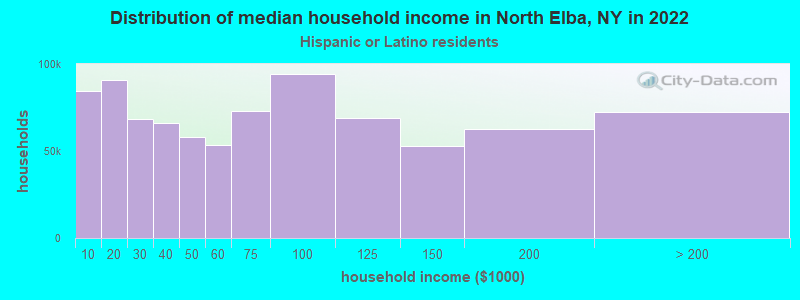
- $79,600Hispanic or Latino race householders
- Median 2022 house value
- $252,071White Non-Hispanic householders
- $141,468Two or more races householders
- $115,747Hispanic or Latino householders
Household income for White non-Hispanic householders
Household income for Black householders
Household income for American Indian and Alaska Native householders
Household income for Asian householders
Household income for Native Hawaiian and other Pacific Islander householders
Household income for Two or more races householders
Household income for Hispanic or Latino race householders
Foreign-born residents in North Elba
699 residents are foreign born (3.5% Latin America, 2.9% Europe, 1.0% Asia).
| This city: | 8.1% |
| New York: | 20.4% |
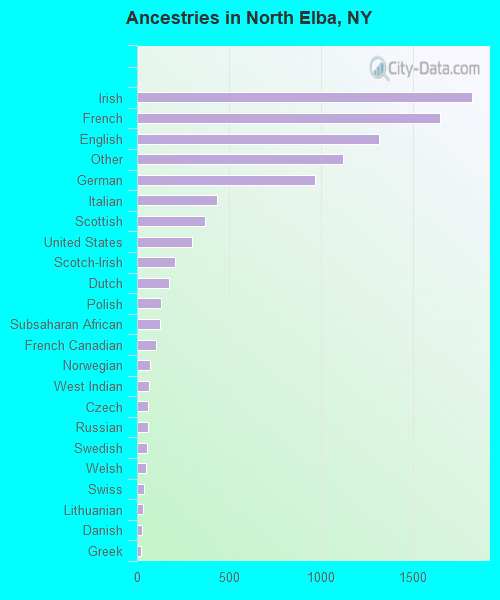
Ancestries in North Elba

- 1,82319.8%Irish
- 1,64617.8%French
- 1,31714.3%English
- 1,12212.2%Other
- 96810.5%German
- 4334.7%Italian
- 3714.0%Scottish
- 3003.3%United States
- 2092.3%Scotch-Irish
- 1741.9%Dutch
- 1291.4%Polish
- 1231.3%Subsaharan African
- 1011.1%French Canadian
- 680.7%Norwegian
- 630.7%West Indian
- 610.7%Czech
- 590.6%Russian
- 550.6%Swedish
- 500.5%Welsh
- 380.4%Swiss
- 340.4%Lithuanian
- 250.3%Danish
- 210.2%Greek
- 160.2%Hungarian
- 130.1%Ukrainian
- 60.07%Portuguese
Zip codes: 12946.