Races in North Logan, Oklahoma (OK) Detailed Stats
Ancestries, Foreign-born residents, place of birth
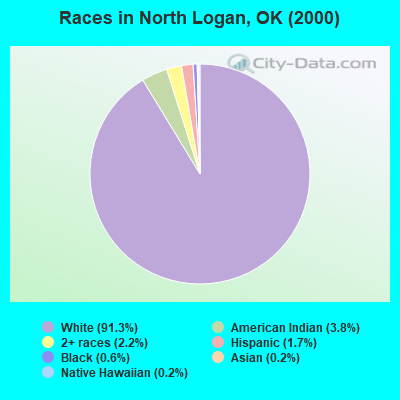
Race distribution in North Logan

- 1,13991.3%White alone
- 473.8%American Indian alone
- 272.2%Two or more races
- 211.7%Hispanic
- 70.6%Black alone
- 30.2%Asian alone
- 30.2%Native Hawaiian and Other
Pacific Islander alone
2000
2022
-
- 2,556,36874.1%White alone
- 266,1587.7%American Indian alone
- 257,9817.5%Black alone
- 179,3045.2%Hispanic
- 140,2494.1%Two or more races
- 46,1721.3%Asian alone
- 2,3220.07%Other race alone
- 2,1000.06%Native Hawaiian and Other
Pacific Islander alone

-
- 2,517,40362.6%White alone
- 486,69212.1%Hispanic
- 364,4539.1%Two or more races
- 273,6506.8%American Indian alone
- 268,5436.7%Black alone
- 92,6722.3%Asian alone
- 10,7860.3%Other race alone
- 5,6010.1%Native Hawaiian and Other
Pacific Islander alone

Income and house value in North Logan
- Median household income in 2022
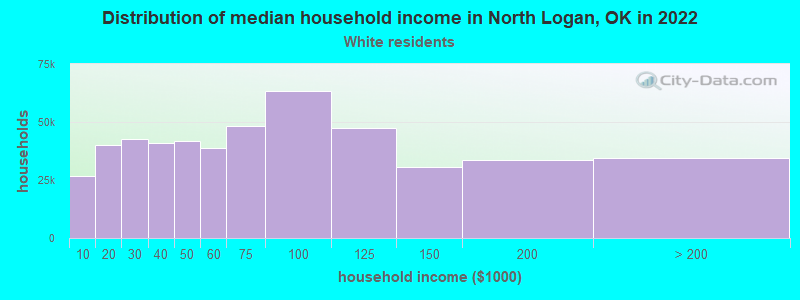
- $57,540White non-Hispanic householders
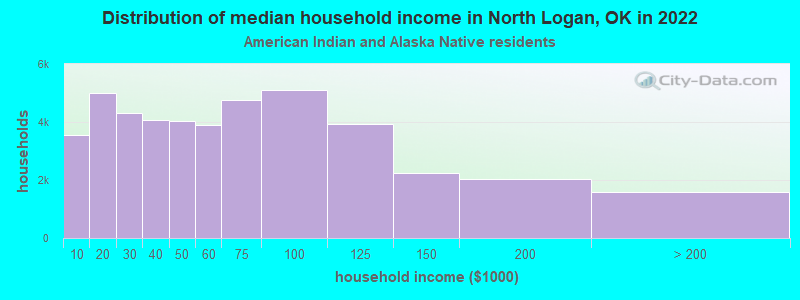
- $47,778American Indian and Alaska Native householders
- $82,329Some other race householders
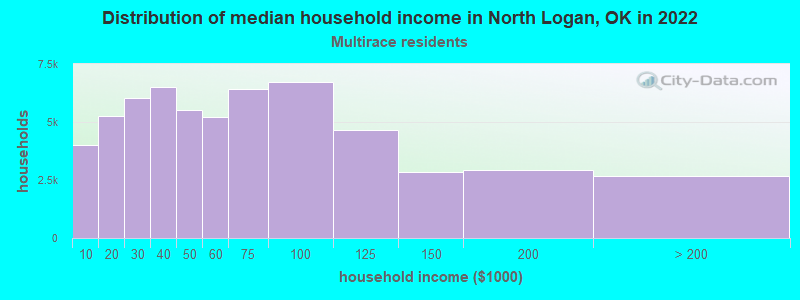
- $35,974Two or more races householders
- $81,020Hispanic or Latino race householders
- Median 2022 house value
- $133,838White Non-Hispanic householders
- $117,879American Indian or Alaska Native householders
- $81,608Some other race householders
- $63,473Two or more races householders
- $81,608Hispanic or Latino householders
Household income for White non-Hispanic householders
Household income for American Indian and Alaska Native householders
Household income for Two or more races householders
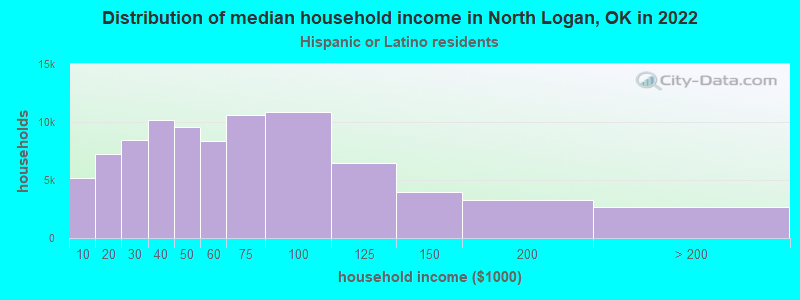
Household income for Hispanic or Latino race householders
Zip code: 73063