Races in North Weeki Wachee, Florida (FL) Detailed Stats
Data:
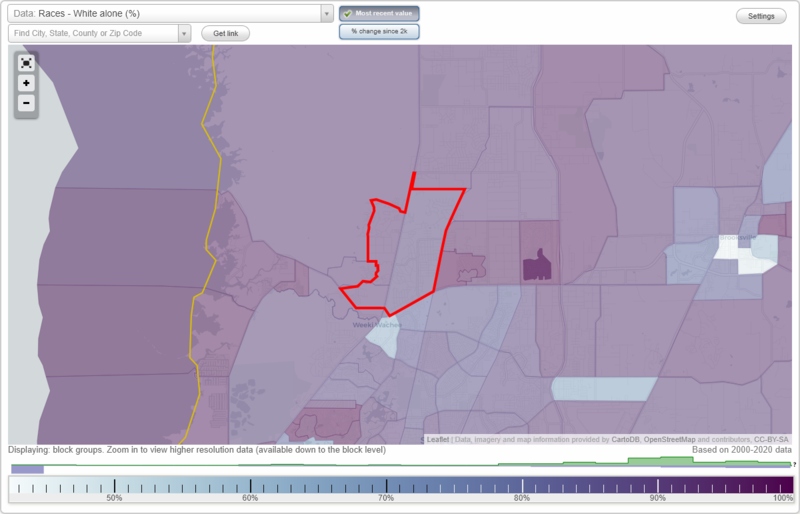
Races - White alone (%)
Races - White alone (% change since 2000)
Races - Black alone (%)
Races - Black alone (% change since 2000)
Races - American Indian alone (%)
Races - American Indian alone (% change since 2000)
Races - Asian alone (%)
Races - Asian alone (% change since 2000)
Races - Hispanic (%)
Races - Hispanic (% change since 2000)
Races - Native Hawaiian and Other Pacific Islander alone (%)
Races - Native Hawaiian and Other Pacific Islander alone (% change since 2000)
Races - Two or more races(%)
Races - Two or more races(% change since 2000)
Races - Other race alone (%)
Races - Other race alone (% change since 2000)
Racial diversity
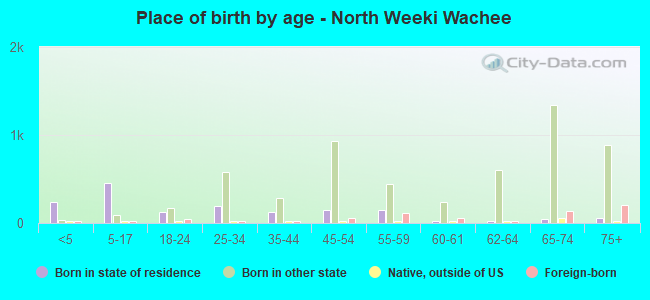
Place of birth - Born in state of residence (%)
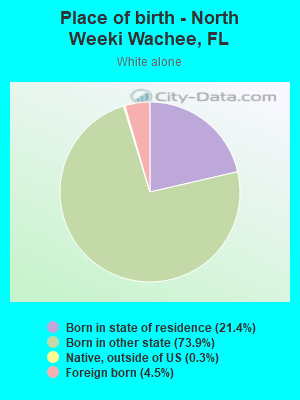
Place of birth - Born in state of residence (%) - White
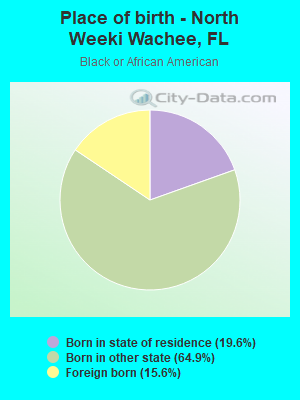
Place of birth - Born in state of residence (%) - Black or African American
Place of birth - Born in state of residence (%) - Asian
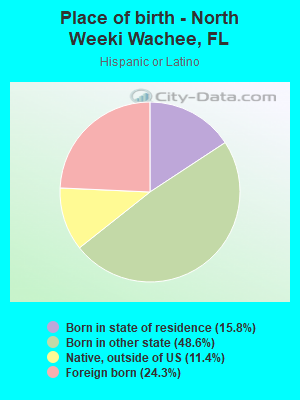
Place of birth - Born in state of residence (%) - Hispanic or Latino
Place of birth - Born in state of residence (%) - American Indian and Alaska Native
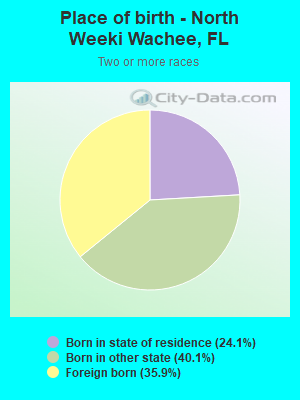
Place of birth - Born in state of residence (%) - Multirace
Place of birth - Born in state of residence (%) - Other Race
Place of birth - Born in other state (%)
Place of birth - Born in other state (%) - White
Place of birth - Born in other state (%) - Black or African American
Place of birth - Born in other state (%) - Asian
Place of birth - Born in other state (%) - Hispanic or Latino
Place of birth - Born in other state (%) - American Indian and Alaska Native
Place of birth - Born in other state (%) - Multirace
Place of birth - Born in other state (%) - Other Race
Place of birth - Native, outside of US (%)
Place of birth - Native, outside of US (%) - White
Place of birth - Native, outside of US (%) - Black or African American
Place of birth - Native, outside of US (%) - Asian
Place of birth - Native, outside of US (%) - Hispanic or Latino
Place of birth - Native, outside of US (%) - American Indian and Alaska Native
Place of birth - Native, outside of US (%) - Multirace
Place of birth - Native, outside of US (%) - Other Race
Place of birth - Foreign born (%)
Place of birth - Foreign born (%) - White
Place of birth - Foreign born (%) - Black or African American
Place of birth - Foreign born (%) - Asian
Place of birth - Foreign born (%) - Hispanic or Latino
Place of birth - Foreign born (%) - American Indian and Alaska Native
Place of birth - Foreign born (%) - Multirace
Place of birth - Foreign born (%) - Other Race
Residents speaking English at home (%)
Residents speaking English at home - Born in the United States (%)
Residents speaking English at home - Native, born elsewhere (%)
Residents speaking English at home - Foreign born (%)
Residents speaking Spanish at home (%)
Residents speaking Spanish at home - Born in the United States (%)
Residents speaking Spanish at home - Native, born elsewhere (%)
Residents speaking Spanish at home - Foreign born (%)
Residents speaking other language at home (%)
Residents speaking other language at home - Born in the United States (%)
Residents speaking other language at home - Native, born elsewhere (%)
Residents speaking other language at home - Foreign born (%)
Marital status - Never married (%)
Marital status - Now married (%)
Marital status - Separated (%)
Marital status - Widowed (%)
Marital status - Divorced (%)
Ancestries Reported - Arab (%)
Ancestries Reported - Czech (%)
Ancestries Reported - Danish (%)
Ancestries Reported - Dutch (%)
Ancestries Reported - English (%)
Ancestries Reported - French (%)
Ancestries Reported - French Canadian (%)
Ancestries Reported - German (%)
Ancestries Reported - Greek (%)
Ancestries Reported - Hungarian (%)
Ancestries Reported - Irish (%)
Ancestries Reported - Italian (%)
Ancestries Reported - Lithuanian (%)
Ancestries Reported - Norwegian (%)
Ancestries Reported - Polish (%)
Ancestries Reported - Portuguese (%)
Ancestries Reported - Russian (%)
Ancestries Reported - Scotch-Irish (%)
Ancestries Reported - Scottish (%)
Ancestries Reported - Slovak (%)
Ancestries Reported - Subsaharan African (%)
Ancestries Reported - Swedish (%)
Ancestries Reported - Swiss (%)
Ancestries Reported - Ukrainian (%)
Ancestries Reported - United States (%)
Ancestries Reported - Welsh (%)
Ancestries Reported - West Indian (%)
Ancestries Reported - Other (%)
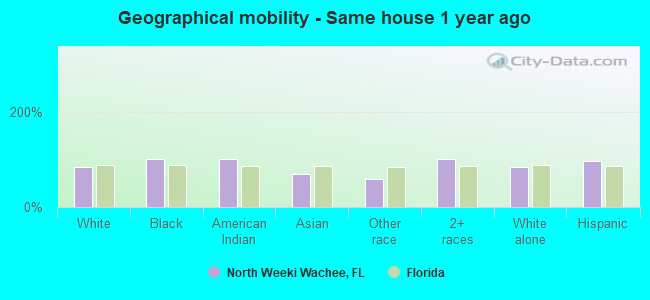
Geographical mobility - Same house 1 year ago (%)
Geographical mobility - Same house 1 year ago (%) - White
Geographical mobility - Same house 1 year ago (%) - Black or African American
Geographical mobility - Same house 1 year ago (%) - Asian
Geographical mobility - Same house 1 year ago (%) - Hispanic or Latino
Geographical mobility - Same house 1 year ago (%) - American Indian and Alaska Native
Geographical mobility - Same house 1 year ago (%) - Multirace
Geographical mobility - Same house 1 year ago (%) - Other Race
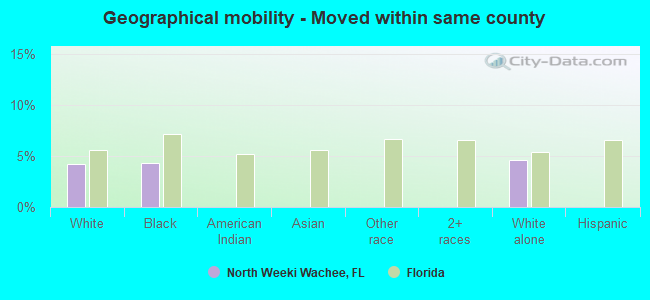
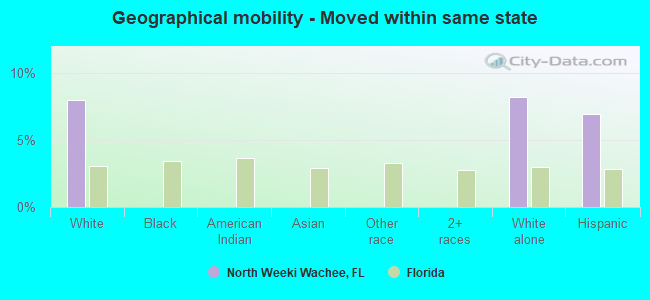
Geographical mobility - Moved within same county (%)
Geographical mobility - Moved within same county (%) - White
Geographical mobility - Moved within same county (%) - Black or African American
Geographical mobility - Moved within same county (%) - Asian
Geographical mobility - Moved within same county (%) - Hispanic or Latino
Geographical mobility - Moved within same county (%) - American Indian and Alaska Native
Geographical mobility - Moved within same county (%) - Multirace
Geographical mobility - Moved within same county (%) - Other Race
Geographical mobility - Moved from different county within same state (%)
Geographical mobility - Moved from different county within same state (%) - White
Geographical mobility - Moved from different county within same state (%) - Black or African American
Geographical mobility - Moved from different county within same state (%) - Asian
Geographical mobility - Moved from different county within same state (%) - Hispanic or Latino
Geographical mobility - Moved from different county within same state (%) - American Indian and Alaska Native
Geographical mobility - Moved from different county within same state (%) - Multirace
Geographical mobility - Moved from different county within same state (%) - Other Race
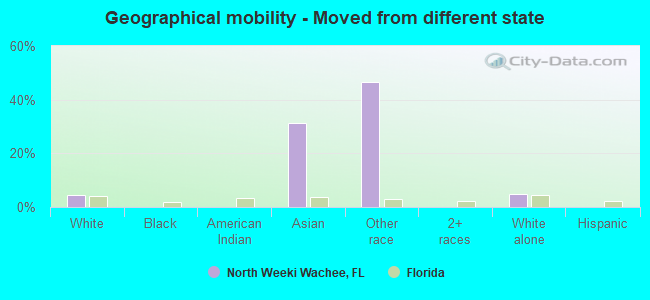
Geographical mobility - Moved from different state (%)
Geographical mobility - Moved from different state (%) - White
Geographical mobility - Moved from different state (%) - Black or African American
Geographical mobility - Moved from different state (%) - Asian
Geographical mobility - Moved from different state (%) - Hispanic or Latino
Geographical mobility - Moved from different state (%) - American Indian and Alaska Native
Geographical mobility - Moved from different state (%) - Multirace
Geographical mobility - Moved from different state (%) - Other Race
Geographical mobility - Moved from abroad (%)
Geographical mobility - Moved from abroad (%) - White
Geographical mobility - Moved from abroad (%) - Black or African American
Geographical mobility - Moved from abroad (%) - Asian
Geographical mobility - Moved from abroad (%) - Hispanic or Latino
Geographical mobility - Moved from abroad (%) - American Indian and Alaska Native
Geographical mobility - Moved from abroad (%) - Multirace
Geographical mobility - Moved from abroad (%) - Other Race
Place of birth for the foreign-born population - Ireland (%)
Place of birth for the foreign-born population - Denmark (%)
Place of birth for the foreign-born population - Norway (%)
Place of birth for the foreign-born population - Sweden (%)
Place of birth for the foreign-born population - United Kingdom (%)
Place of birth for the foreign-born population - England (%)
Place of birth for the foreign-born population - Scotland (%)
Place of birth for the foreign-born population - Other Northern Europe (%)
Place of birth for the foreign-born population - Austria (%)
Place of birth for the foreign-born population - Belgium (%)
Place of birth for the foreign-born population - France (%)
Place of birth for the foreign-born population - Germany (%)
Place of birth for the foreign-born population - Netherlands (%)
Place of birth for the foreign-born population - Switzerland (%)
Place of birth for the foreign-born population - Other Western Europe (%)
Place of birth for the foreign-born population - Greece (%)
Place of birth for the foreign-born population - Italy (%)
Place of birth for the foreign-born population - Portugal (%)
Place of birth for the foreign-born population - Spain (%)
Place of birth for the foreign-born population - Other Southern Europe (%)
Place of birth for the foreign-born population - Albania (%)
Place of birth for the foreign-born population - Belarus (%)
Place of birth for the foreign-born population - Bosnia and Herzegovina (%)
Place of birth for the foreign-born population - Bulgaria (%)
Place of birth for the foreign-born population - Croatia (%)
Place of birth for the foreign-born population - Czechoslovakia (%)
Place of birth for the foreign-born population - Hungary (%)
Place of birth for the foreign-born population - Latvia (%)
Place of birth for the foreign-born population - Lithuania (%)
Place of birth for the foreign-born population - North Macedonia (Macedonia) (%)
Place of birth for the foreign-born population - Moldova (%)
Place of birth for the foreign-born population - Poland (%)
Place of birth for the foreign-born population - Romania (%)
Place of birth for the foreign-born population - Russia (%)
Place of birth for the foreign-born population - Serbia (%)
Place of birth for the foreign-born population - Ukraine (%)
Place of birth for the foreign-born population - Other Eastern Europe (%)
Place of birth for the foreign-born population - China (%)
Place of birth for the foreign-born population - Hong Kong (%)
Place of birth for the foreign-born population - Taiwan (%)
Place of birth for the foreign-born population - Japan (%)
Place of birth for the foreign-born population - Korea (%)
Place of birth for the foreign-born population - Other Eastern Asia (%)
Place of birth for the foreign-born population - Afghanistan (%)
Place of birth for the foreign-born population - Bangladesh (%)
Place of birth for the foreign-born population - India (%)
Place of birth for the foreign-born population - Iran (%)
Place of birth for the foreign-born population - Kazakhstan (%)
Place of birth for the foreign-born population - Nepal (%)
Place of birth for the foreign-born population - Pakistan (%)
Place of birth for the foreign-born population - Sri Lanka (%)
Place of birth for the foreign-born population - Uzbekistan (%)
Place of birth for the foreign-born population - Other South Central Asia (%)
Place of birth for the foreign-born population - Burma (%)
Place of birth for the foreign-born population - Cambodia (%)
Place of birth for the foreign-born population - Indonesia (%)
Place of birth for the foreign-born population - Laos (%)
Place of birth for the foreign-born population - Malaysia (%)
Place of birth for the foreign-born population - Philippines (%)
Place of birth for the foreign-born population - Singapore (%)
Place of birth for the foreign-born population - Thailand (%)
Place of birth for the foreign-born population - Vietnam (%)
Place of birth for the foreign-born population - Other South Eastern Asia (%)
Place of birth for the foreign-born population - Armenia (%)
Place of birth for the foreign-born population - Iraq (%)
Place of birth for the foreign-born population - Israel (%)
Place of birth for the foreign-born population - Jordan (%)
Place of birth for the foreign-born population - Kuwait (%)
Place of birth for the foreign-born population - Lebanon (%)
Place of birth for the foreign-born population - Saudi Arabia (%)
Place of birth for the foreign-born population - Syria (%)
Place of birth for the foreign-born population - Turkey (%)
Place of birth for the foreign-born population - Yemen (%)
Place of birth for the foreign-born population - Other Western Asia (%)
Place of birth for the foreign-born population - Eritrea (%)
Place of birth for the foreign-born population - Ethiopia (%)
Place of birth for the foreign-born population - Kenya (%)
Place of birth for the foreign-born population - Somalia (%)
Place of birth for the foreign-born population - Uganda (%)
Place of birth for the foreign-born population - Zimbabwe (%)
Place of birth for the foreign-born population - Other Eastern Africa (%)
Place of birth for the foreign-born population - Cameroon (%)
Place of birth for the foreign-born population - Congo (%)
Place of birth for the foreign-born population - Democratic Republic of Congo (Zaire) (%)
Place of birth for the foreign-born population - Other Middle Africa (%)
Place of birth for the foreign-born population - Egypt (%)
Place of birth for the foreign-born population - Morocco (%)
Place of birth for the foreign-born population - Sudan (%)
Place of birth for the foreign-born population - Other Northern Africa (%)
Place of birth for the foreign-born population - South Africa (%)
Place of birth for the foreign-born population - Other Southern Africa (%)
Place of birth for the foreign-born population - Cabo Verde (%)
Place of birth for the foreign-born population - Ghana (%)
Place of birth for the foreign-born population - Liberia (%)
Place of birth for the foreign-born population - Nigeria (%)
Place of birth for the foreign-born population - Senegal (%)
Place of birth for the foreign-born population - Sierra Leone (%)
Place of birth for the foreign-born population - Other Western Africa (%)
Place of birth for the foreign-born population - Australia (%)
Place of birth for the foreign-born population - New Zealand (%)
Place of birth for the foreign-born population - Fiji (%)
Place of birth for the foreign-born population - Micronesia (%)
Place of birth for the foreign-born population - Bahamas (%)
Place of birth for the foreign-born population - Barbados (%)
Place of birth for the foreign-born population - Cuba (%)
Place of birth for the foreign-born population - Dominica (%)
Place of birth for the foreign-born population - Dominican Republic (%)
Place of birth for the foreign-born population - Grenada (%)
Place of birth for the foreign-born population - Haiti (%)
Place of birth for the foreign-born population - Jamaica (%)
Place of birth for the foreign-born population - St. Vincent and the Grenadines (%)
Place of birth for the foreign-born population - Trinidad and Tobago (%)
Place of birth for the foreign-born population - West Indies (%)
Place of birth for the foreign-born population - Other Caribbean (%)
Place of birth for the foreign-born population - Belize (%)
Place of birth for the foreign-born population - Costa Rica (%)
Place of birth for the foreign-born population - El Salvador (%)
Place of birth for the foreign-born population - Guatemala (%)
Place of birth for the foreign-born population - Honduras (%)
Place of birth for the foreign-born population - Mexico (%)
Place of birth for the foreign-born population - Nicaragua (%)
Place of birth for the foreign-born population - Panama (%)
Place of birth for the foreign-born population - Other Central America (%)
Place of birth for the foreign-born population - Argentina (%)
Place of birth for the foreign-born population - Bolivia (%)
Place of birth for the foreign-born population - Brazil (%)
Place of birth for the foreign-born population - Chile (%)
Place of birth for the foreign-born population - Colombia (%)
Place of birth for the foreign-born population - Ecuador (%)
Place of birth for the foreign-born population - Guyana (%)
Place of birth for the foreign-born population - Peru (%)
Place of birth for the foreign-born population - Uruguay (%)
Place of birth for the foreign-born population - Venezuela (%)
Place of birth for the foreign-born population - Other South America (%)
Place of birth for the foreign-born population - Canada (%)
Place of birth for the foreign-born population - Other Northern America (%)
Place of birth for the foreign-born population - Other (%)
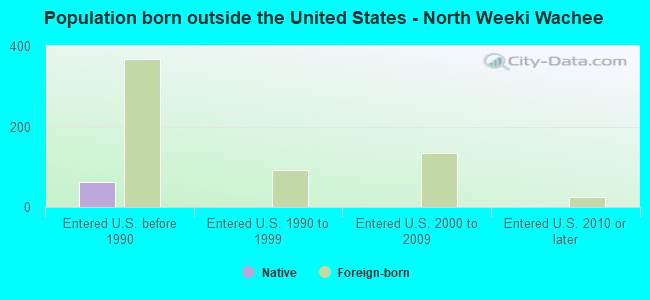
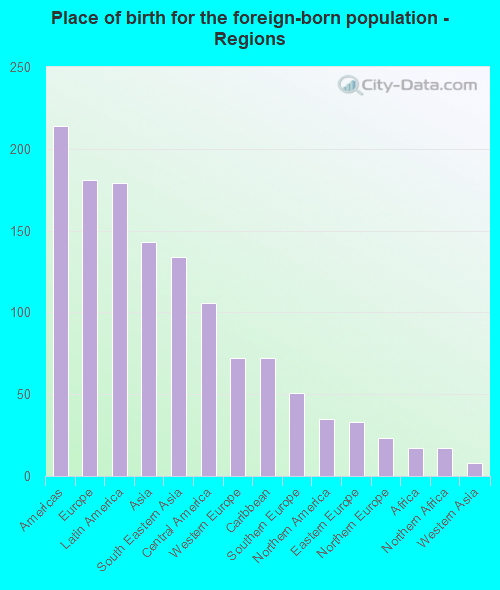
According to 2022 data, the most numerous races in North Weeki Wachee, FL are White alone (6,363 residents), Hispanic (532 residents), and Black alone (401 residents). 89.5% of North Weeki Wachee residents speak English at home. 7.0% of North Weeki Wachee, FL residents are foreign-born (2.3% born in Europe, 2.2% born in Latin America, 1.8% born in Asia), which is 198.7% less than the foreign-born rate of 21.0% across the entire state of Florida.
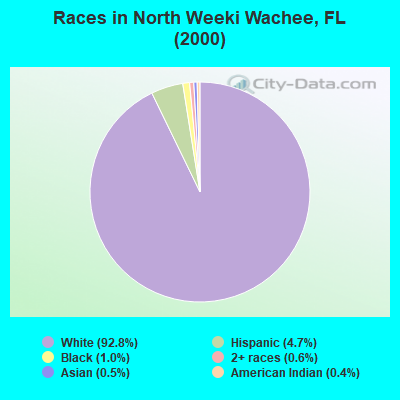
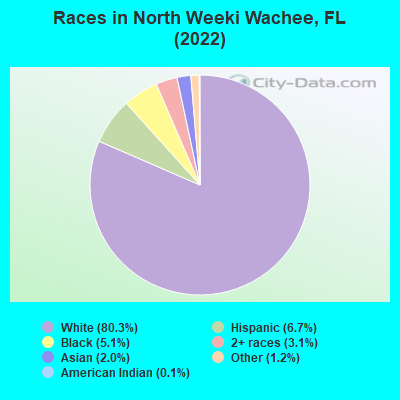
Race distribution in North Weeki Wachee
2000 2022
10,458,509 65.4% White alone 2,682,715 16.8% Hispanic 2,264,268 14.2% Black alone 261,693 1.6% Asian alone 236,954 1.5% Two or more races 42,358 0.3% American Indian alone 28,994 0.2% Other race alone 6,887 0.04% Native Hawaiian and Other
11,309,403 50.8% White alone 6,025,039 27.1% Hispanic 3,241,015 14.6% Black alone 861,630 3.9% Two or more races 623,692 2.8% Asian alone 152,054 0.7% Other race alone 22,504 0.1% American Indian alone 9,486 0.04% Native Hawaiian and Other
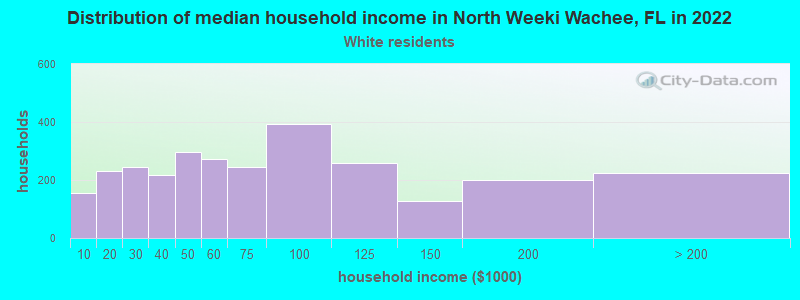
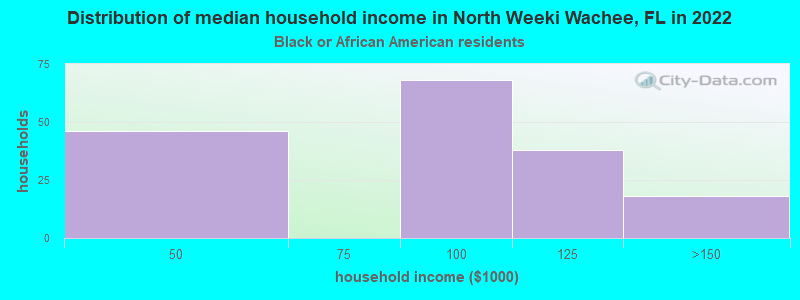
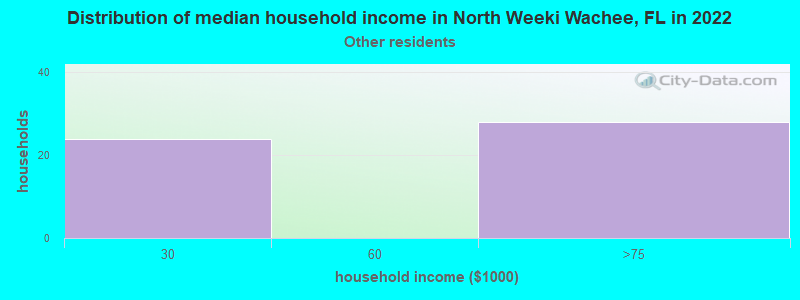
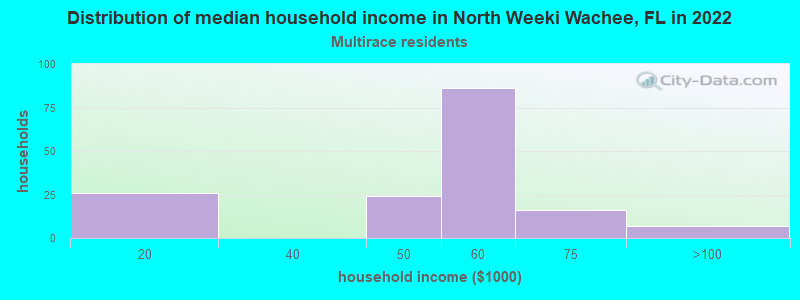
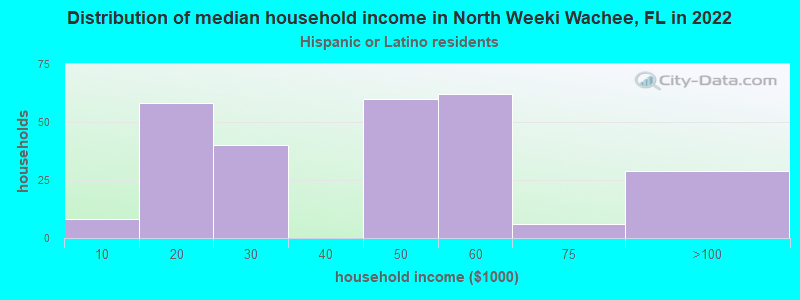
Income and house value in North Weeki Wachee Median household income in 2022 $61,788 White non-Hispanic householders$110,497 Black householders$60,564 Two or more races householdersMedian 2022 house value $440,011 White Non-Hispanic householders$152,664 Two or more races householders$270,384 Hispanic or Latino householders
Median age by race in North Weeki Wachee
58.6 Median age for White residents60.0 56.8 49.7 Median age for Black or African American residents59.3 44.7 -731,305,449.2 Median age for American Indian / Alaska Native residents-802,539,681.7 -704,938,270.9 75.1 Median age for Asian residents-707,668,943.9 76.6 -294,871,794.6 Median age for Native Hawaiian / Pacific Islander residents-666,666,666.0 -443,298,968.6 65.2 Median age for Other race residents53.4 67.4 38.8 Median age for Two or more races residents38.7 36.1 59.2 Median age for White alone residents59.0 56.9 56.7 Median age for Hispanic or Latino residents55.6 28.9
Owner/renter occupied households by race in North Weeki Wachee
House owners and renters - White residents 2,557 87.1% Owner occupied379 12.9% Renter occupiedHouse owners and renters - Black or African American residents 133 100.0% Owner occupiedHouse owners and renters - American Indian / Alaska Native residents 19 100.0% Owner occupiedHouse owners and renters - Asian residents 23 100.0% Owner occupiedHouse owners and renters - Other race residents 66 100.0% Owner occupiedHouse owners and renters - Two or more races residents 150 96.7% Owner occupied5 3.3% Renter occupiedHouse owners and renters - White alone residents 2,524 88.3% Owner occupied336 11.7% Renter occupiedHouse owners and renters - Hispanic or Latino residents 210 79.4% Owner occupied55 20.6% Renter occupied
Language usage in North Weeki Wachee
English speakers - Total 89.5% of residents of North Weeki Wachee speak English at home.
4.8% of residents speak Spanish at home 106 28.6% Speak English very well264 71.4% Speak English less than very well6.3% of residents speak other language at home 277 57.8% Speak English very well202 42.2% Speak English less than very well
English speakers - Born in the United States 94.3% of residents of North Weeki Wachee speak English at home.
3.0% of residents speak Spanish at home 109 66.1% Speak English very well56 33.9% Speak English less than very well2.8% of residents speak other language at home 153 100.0% Speak English very well
English speakers - Native, born elsewhere 20.8% of residents of North Weeki Wachee speak English at home.
107.8% of residents speak Spanish at home 83 100.0% Speak English less than very well
English speakers - Foreign-born 32.2% of residents of North Weeki Wachee speak English at home.
19.3% of residents speak Spanish at home 125 100.0% Speak English less than very well45.4% of residents speak other language at home 109 37.2% Speak English very well184 62.8% Speak English less than very well
White (Caucasian) - Speak only English Native:
95.7% (5,870)Foreign-born:
76.3% (168)
White (Caucasian) - Speak another language Native:
4.1% (254)Foreign-born:
29.5% (65)
Black or African American - Speak only English Native:
95.4% (259)Foreign-born:
39.1% (27)
Black or African American - Speak another language Native:
4.5% (12)Foreign-born:
61.1% (42)
Two or more races - Speak another language Native:
8.8% (21)Foreign-born:
100.0% (199)
White alone - Speak only English Native:
96.5% (5,768)Foreign-born:
65.4% (183)
White alone - Speak another language Native:
3.5% (210)Foreign-born:
34.3% (96)
Hispanic or Latino - Speak another language Native:
40.4% (131)Foreign-born:
100.0% (132)
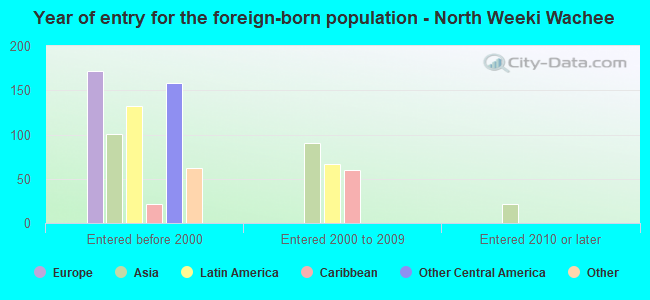
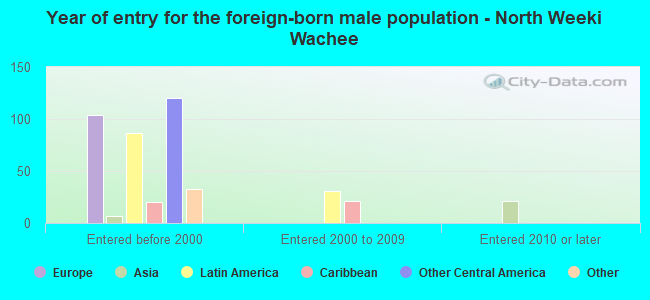
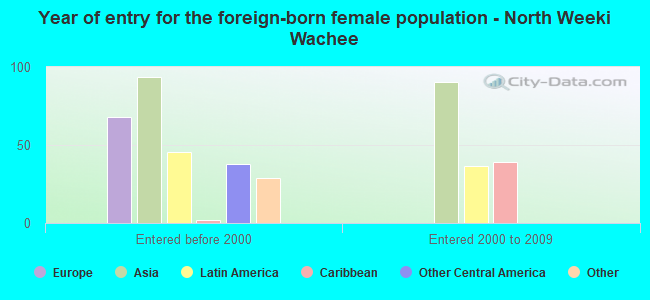
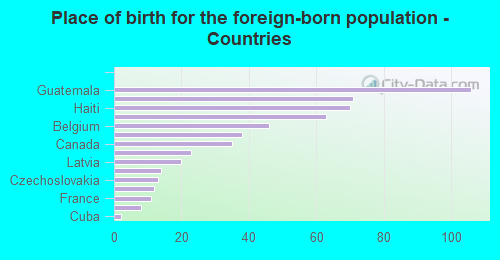
Foreign-born residents in North Weeki Wachee 557 residents are foreign born (2.3% Europe , 2.2% Latin America , 1.8% Asia ).
This city:
7.0%Florida:
21.1%
Marital status for residents in North Weeki Wachee Marital status - White (Caucasian) population 15 years and over
Males 16.0% Never married63.5% Now married2.5% Separated1.4% Widowed16.6% DivorcedFemales 19.4% Never married53.0% Now married0.8% Separated12.2% Widowed14.6% DivorcedWomen who did not give birth in the past 12 months Now married:
41.5% (386)Unmarried:
58.5% (544)
Marital status - Black or African American population 15 years and over
Males 39.7% Never married45.7% Now married0.0% Separated0.0% Widowed14.6% DivorcedFemales 12.9% Never married57.3% Now married0.0% Separated19.7% Widowed10.1% DivorcedWomen who did not give birth in the past 12 months Now married:
68.9% (50)Unmarried:
31.1% (23)
Marital status - Asian population 15 years and over
Males 0.0% Never married100.0% Now married0.0% Separated0.0% Widowed0.0% DivorcedFemales 0.0% Never married63.6% Now married0.0% Separated36.4% Widowed0.0% DivorcedWomen who did not give birth in the past 12 months Now married:
100.0% (14)Unmarried:
0.0% (0)
Marital status - Other race population 15 years and over
Males 28.3% Never married71.7% Now married0.0% Separated0.0% Widowed0.0% DivorcedFemales 0.0% Never married100.0% Now married0.0% Separated0.0% Widowed0.0% DivorcedWomen who did not give birth in the past 12 months Now married:
100.0% (27)Unmarried:
0.0% (0)
Marital status - Two or more races population 15 years and over
Males 45.5% Never married25.9% Now married0.0% Separated0.0% Widowed28.6% DivorcedFemales 49.5% Never married44.2% Now married0.0% Separated0.0% Widowed6.3% DivorcedWomen who did not give birth in the past 12 months Now married:
100.0% (29)Unmarried:
0.0% (0)
Marital status - White alone, not Hispanic / Latino population 15 years and over
Males 14.5% Never married64.3% Now married2.6% Separated1.5% Widowed17.2% DivorcedFemales 19.9% Never married52.9% Now married0.9% Separated11.3% Widowed15.1% DivorcedWomen who did not give birth in the past 12 months Now married:
36.8% (327)Unmarried:
63.2% (562)
Marital status - Hispanic or Latino population 15 years and over
Males 44.4% Never married28.1% Now married0.0% Separated0.0% Widowed27.6% DivorcedFemales 31.8% Never married44.7% Now married0.0% Separated22.3% Widowed1.1% DivorcedWomen who did not give birth in the past 12 months Now married:
100.0% (83)Unmarried:
0.0% (0)
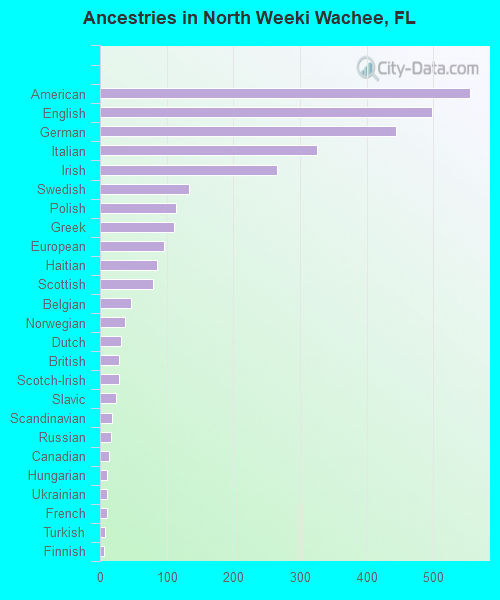
Ancestries in North Weeki Wachee
556 15.8% American498 14.1% English444 12.6% German325 9.2% Italian265 7.5% Irish133 3.8% Swedish114 3.2% Polish111 3.1% Greek96 2.7% European86 2.4% Haitian80 2.3% Scottish46 1.3% Belgian38 1.1% Norwegian32 0.9% Dutch29 0.8% British29 0.8% Scotch-Irish24 0.7% Slavic18 0.5% Scandinavian17 0.5% Russian14 0.4% Canadian11 0.3% Hungarian11 0.3% Ukrainian10 0.3% French8 0.2% Turkish6 0.2% Finnish
Children Nativity (place of birth) in North Weeki Wachee
Children under 6 years - Living with two parents Both parents native 242 100.0% NativeChildren under 6 years - Living with one parent Native parent 82 100.0% Native
Children 6 to 17 years - Living with two parents Both parents native 244 100.0% NativeBoth parents foreign-born 12 100.0% NativeOne native, one foreign-born parent 15 100.0% NativeChildren 6 to 17 years - Living with one parent Native parent 161 100.0% Native
Grandparents responsible for own grandchildren in North Weeki Wachee
Grandparents (30 to 59 years) White / Caucasian 13 70.3% Responsible for grandchildren6 29.7% Not responsible for grandchildrenBlack or African American 11 100.0% Not responsible for grandchildrenWhite alone, not Hispanic / Latino 16 73.5% Responsible for grandchildren6 26.5% Not responsible for grandchildrenGrandparents (60 years and over) White / Caucasian 20 27.8% Responsible for grandchildren53 72.2% Not responsible for grandchildrenWhite alone, not Hispanic / Latino 19 26.1% Responsible for grandchildren54 73.9% Not responsible for grandchildren