Races in Northfield, New Hampshire (NH) Detailed Stats
Ancestries, Foreign-born residents, place of birth

Recent posts about races in Northfield, New Hampshire on our local forum with over 2,400,000 registered users:
 | Mother, 2 young sons shot to death in Northfield, NH (29 replies) |
| Tilton/Northfield (3 replies) |
| Good realtor in the Lakes Region? (11 replies) |
| Opinions on Franklin? (23 replies) |
| First Post -- moving to the Concord, NH area (27 replies) |
| Winnisquam Regional School District (1 reply) |
1.9% of Northfield, NH residents are foreign-born , which is 167.5% less than the foreign-born rate of 5.0% across the entire state of New Hampshire.
Race distribution in Northfield

- 4,43497.5%White alone
- 420.9%Hispanic
- 420.9%Two or more races
- 160.4%Asian alone
- 80.2%American Indian alone
- 60.1%Black alone
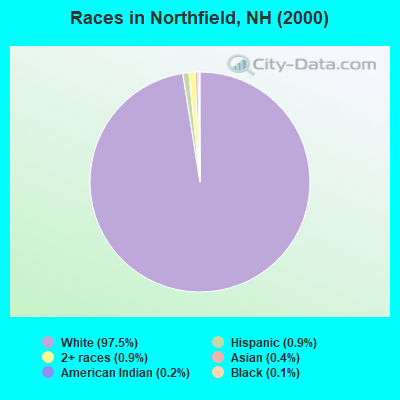
2000
2022
-
- 1,175,25295.1%White alone
- 20,4891.7%Hispanic
- 15,8031.3%Asian alone
- 11,6060.9%Two or more races
- 8,3540.7%Black alone
- 2,6980.2%American Indian alone
- 1,2540.1%Other race alone
- 3300.03%Native Hawaiian and Other
Pacific Islander alone

-
- 1,208,10186.6%White alone
- 63,4794.5%Hispanic
- 60,7244.4%Two or more races
- 36,5192.6%Asian alone
- 17,9311.3%Black alone
- 6,6150.5%Other race alone
- 1,0140.07%American Indian alone
- 8480.06%Native Hawaiian and Other
Pacific Islander alone

Income and house value in Northfield
- Median household income in 2022
- $77,682White non-Hispanic householders
- $14,622Black householders
- $159,714Two or more races householders
- $69,821Hispanic or Latino race householders
- Median 2022 house value
- $291,039White Non-Hispanic householders
- $297,298Two or more races householders
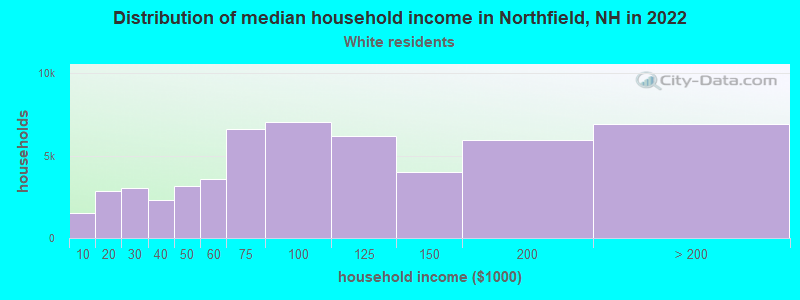
Household income for White non-Hispanic householders
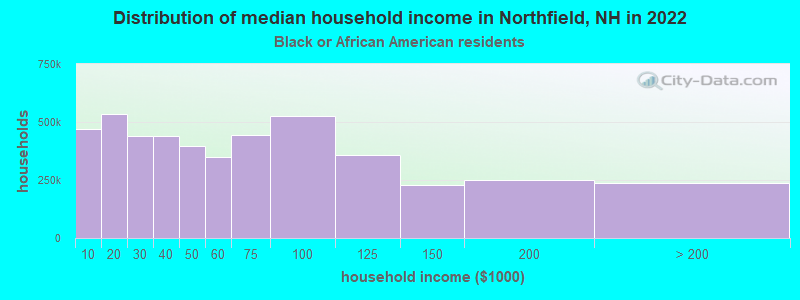
Household income for Black householders
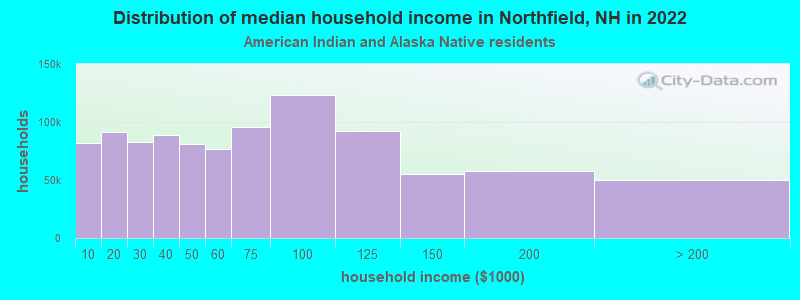
Household income for American Indian and Alaska Native householders
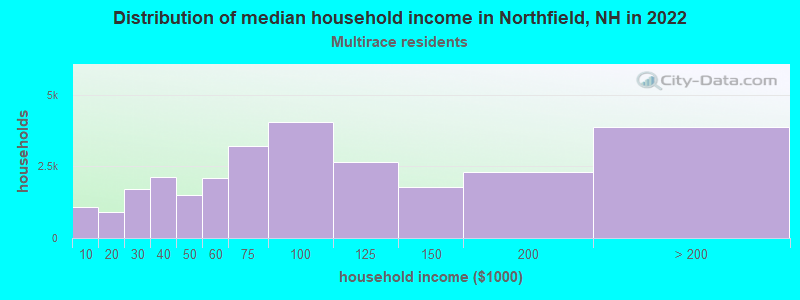
Household income for Two or more races householders
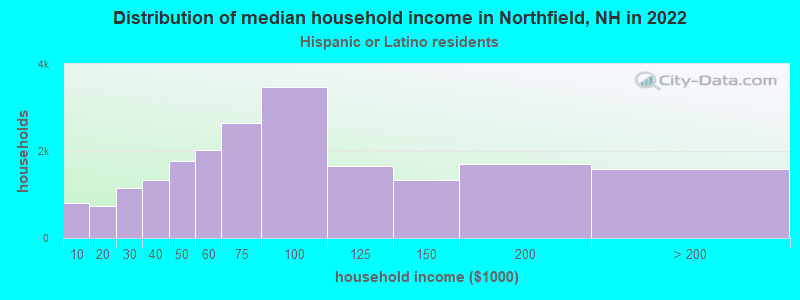
Household income for Hispanic or Latino race householders
Foreign-born residents in Northfield
85 residents are foreign born
| This city: | 1.9% |
| New Hampshire: | 4.4% |
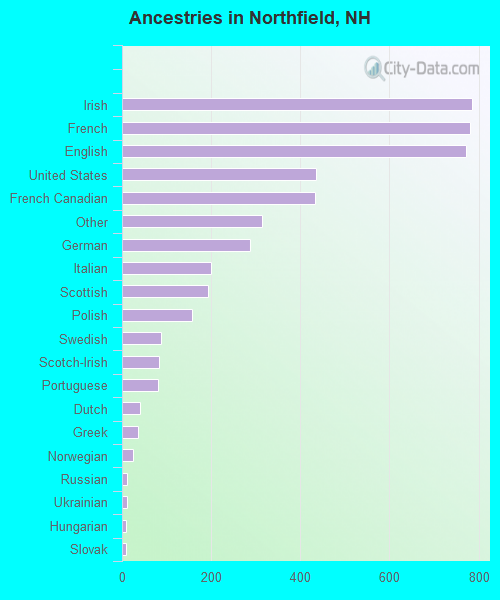
Ancestries in Northfield

- 78416.4%Irish
- 78116.4%French
- 77216.2%English
- 4369.1%United States
- 4329.1%French Canadian
- 3156.6%Other
- 2876.0%German
- 1994.2%Italian
- 1944.1%Scottish
- 1583.3%Polish
- 881.8%Swedish
- 831.7%Scotch-Irish
- 801.7%Portuguese
- 400.8%Dutch
- 360.8%Greek
- 250.5%Norwegian
- 120.3%Russian
- 110.2%Ukrainian
- 80.2%Hungarian
- 80.2%Slovak
- 70.1%Czech
- 70.1%Welsh
- 50.1%Lithuanian
- 40.08%West Indian
Zip codes: 03276.