Races in Northwest Harris, Texas (TX) Detailed Stats
Ancestries, Foreign-born residents, place of birth
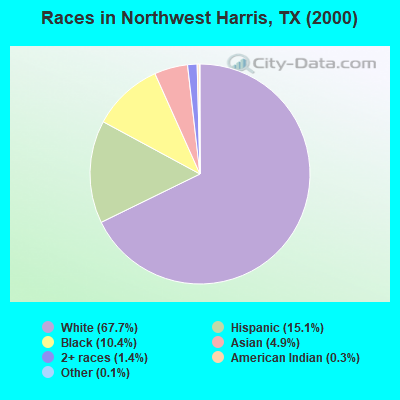
Race distribution in Northwest Harris

- 274,39267.7%White alone
- 61,41215.1%Hispanic
- 42,03710.4%Black alone
- 20,0394.9%Asian alone
- 5,6781.4%Two or more races
- 1,0710.3%American Indian alone
- 5910.1%Other race alone
- 2240.06%Native Hawaiian and Other
Pacific Islander alone
2000
2022
-
- 10,933,31352.4%White alone
- 6,669,66632.0%Hispanic
- 2,364,25511.3%Black alone
- 554,4452.7%Asian alone
- 230,5671.1%Two or more races
- 68,8590.3%American Indian alone
- 19,9580.10%Other race alone
- 10,7570.05%Native Hawaiian and Other
Pacific Islander alone

-
- 12,070,64240.2%Hispanic
- 11,683,43038.9%White alone
- 3,508,70611.7%Black alone
- 1,608,1735.4%Asian alone
- 956,5603.2%Two or more races
- 125,7630.4%Other race alone
- 47,0230.2%American Indian alone
- 29,2750.10%Native Hawaiian and Other
Pacific Islander alone

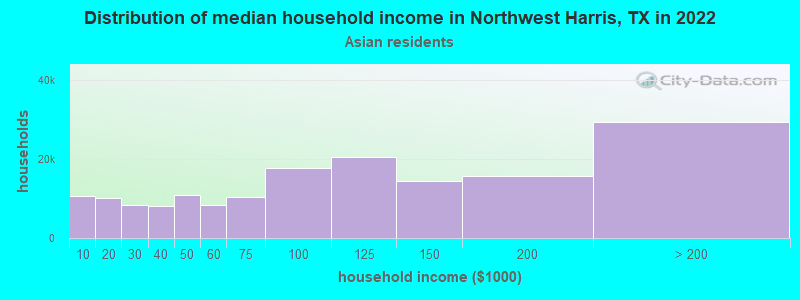
Income and house value in Northwest Harris
- Median household income in 2022
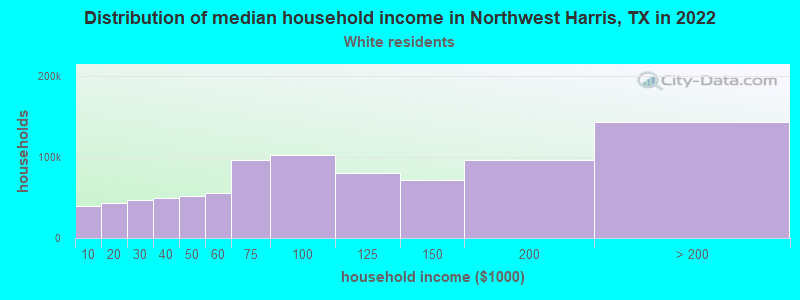
- $113,023White non-Hispanic householders
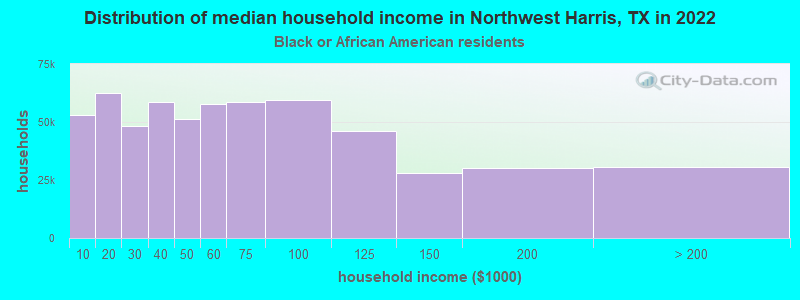
- $81,299Black householders
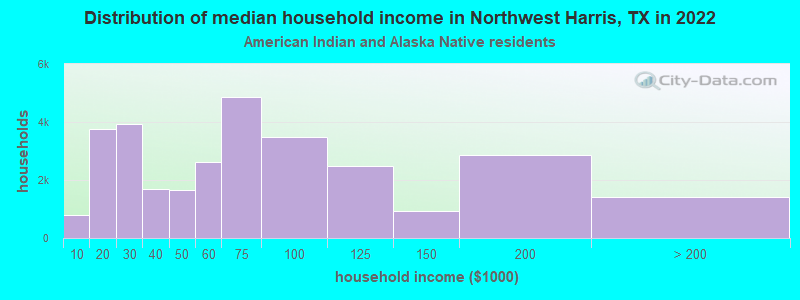
- $92,366American Indian and Alaska Native householders
- $124,279Asian householders
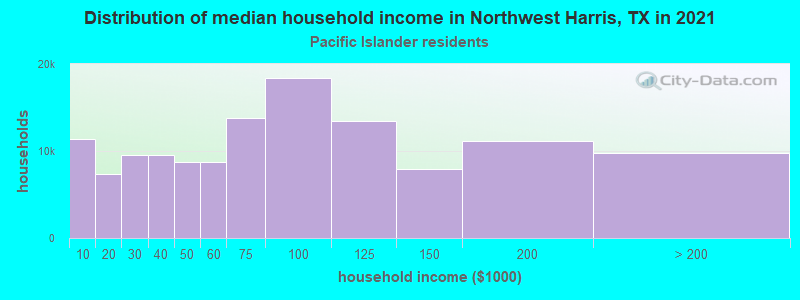
- $43,630Native Hawaiian and other Pacific Islander householders
- $67,095Some other race householders
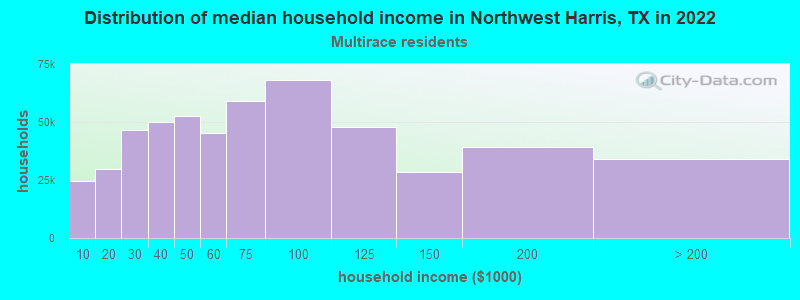
- $96,715Two or more races householders
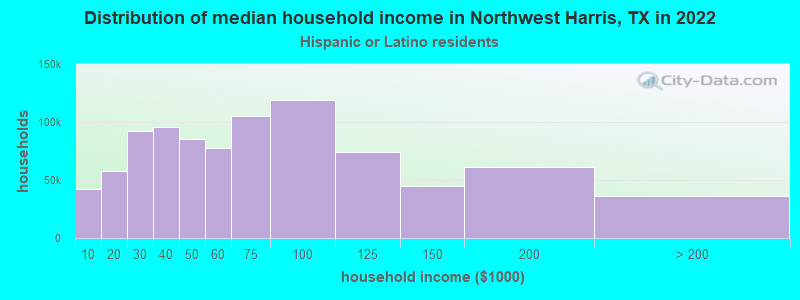
- $80,654Hispanic or Latino race householders
- Median 2022 house value
- $379,068White Non-Hispanic householders
- $282,812Black or African American householders
- $251,771American Indian or Alaska Native householders
- $355,866Asian householders
- $232,332Native Hawaiian and other Pacific Islander householders
- $250,517Some other race householders
- $316,674Two or more races householders
- $258,983Hispanic or Latino householders
Household income for White non-Hispanic householders
Household income for Black householders
Household income for American Indian and Alaska Native householders
Household income for Asian householders
Household income for Native Hawaiian and other Pacific Islander householders
Household income for Two or more races householders
Household income for Hispanic or Latino race householders
Zip code: 77070