Races in Ocean Springs, Mississippi (MS) Detailed Stats
Data:
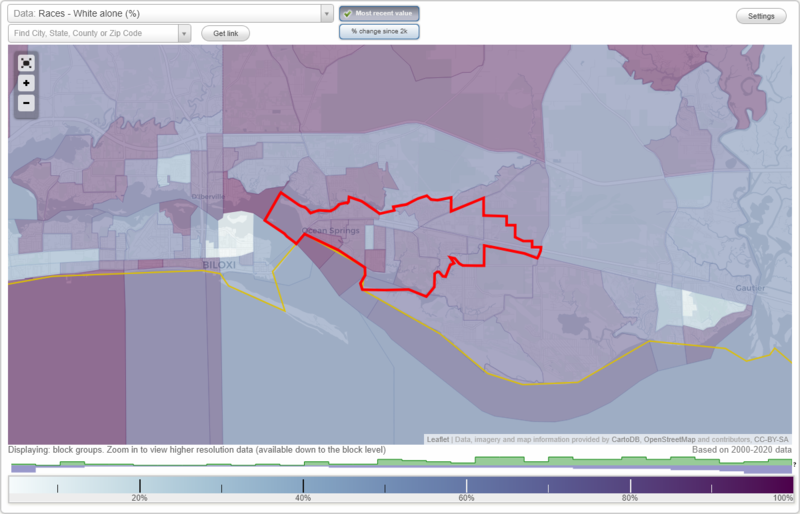
Races - White alone (%)
Races - White alone (% change since 2000)
Races - Black alone (%)
Races - Black alone (% change since 2000)
Races - American Indian alone (%)
Races - American Indian alone (% change since 2000)
Races - Asian alone (%)
Races - Asian alone (% change since 2000)
Races - Hispanic (%)
Races - Hispanic (% change since 2000)
Races - Native Hawaiian and Other Pacific Islander alone (%)
Races - Native Hawaiian and Other Pacific Islander alone (% change since 2000)
Races - Two or more races(%)
Races - Two or more races(% change since 2000)
Races - Other race alone (%)
Races - Other race alone (% change since 2000)
Racial diversity
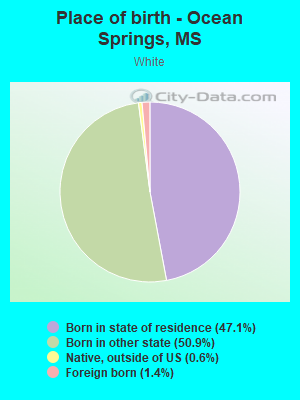
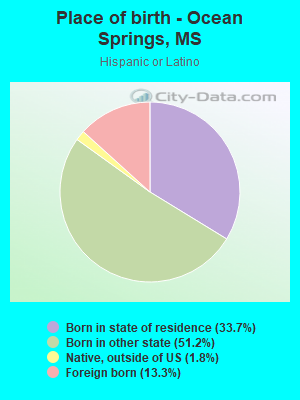
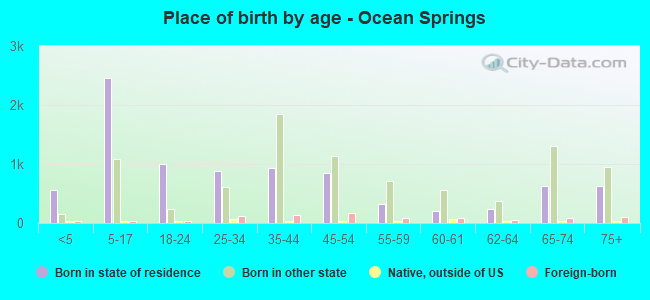
Place of birth - Born in state of residence (%)
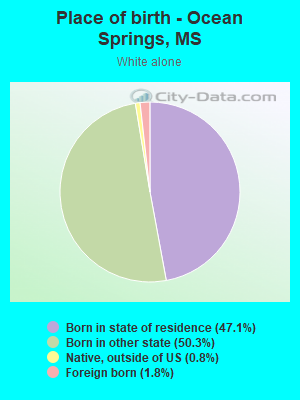
Place of birth - Born in state of residence (%) - White
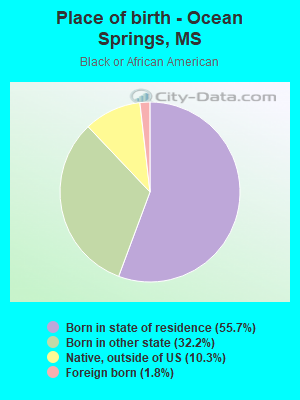
Place of birth - Born in state of residence (%) - Black or African American
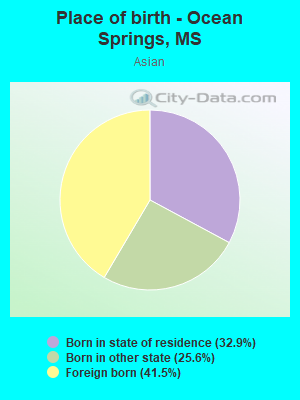
Place of birth - Born in state of residence (%) - Asian
Place of birth - Born in state of residence (%) - Hispanic or Latino
Place of birth - Born in state of residence (%) - American Indian and Alaska Native
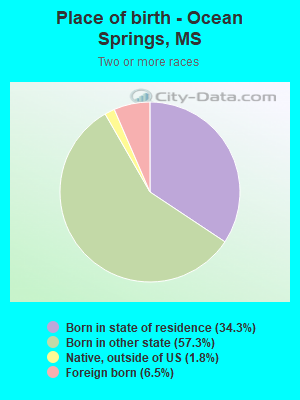
Place of birth - Born in state of residence (%) - Multirace
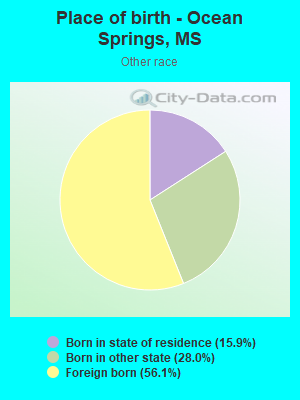
Place of birth - Born in state of residence (%) - Other Race
Place of birth - Born in other state (%)
Place of birth - Born in other state (%) - White
Place of birth - Born in other state (%) - Black or African American
Place of birth - Born in other state (%) - Asian
Place of birth - Born in other state (%) - Hispanic or Latino
Place of birth - Born in other state (%) - American Indian and Alaska Native
Place of birth - Born in other state (%) - Multirace
Place of birth - Born in other state (%) - Other Race
Place of birth - Native, outside of US (%)
Place of birth - Native, outside of US (%) - White
Place of birth - Native, outside of US (%) - Black or African American
Place of birth - Native, outside of US (%) - Asian
Place of birth - Native, outside of US (%) - Hispanic or Latino
Place of birth - Native, outside of US (%) - American Indian and Alaska Native
Place of birth - Native, outside of US (%) - Multirace
Place of birth - Native, outside of US (%) - Other Race
Place of birth - Foreign born (%)
Place of birth - Foreign born (%) - White
Place of birth - Foreign born (%) - Black or African American
Place of birth - Foreign born (%) - Asian
Place of birth - Foreign born (%) - Hispanic or Latino
Place of birth - Foreign born (%) - American Indian and Alaska Native
Place of birth - Foreign born (%) - Multirace
Place of birth - Foreign born (%) - Other Race
Residents speaking English at home (%)
Residents speaking English at home - Born in the United States (%)
Residents speaking English at home - Native, born elsewhere (%)
Residents speaking English at home - Foreign born (%)
Residents speaking Spanish at home (%)
Residents speaking Spanish at home - Born in the United States (%)
Residents speaking Spanish at home - Native, born elsewhere (%)
Residents speaking Spanish at home - Foreign born (%)
Residents speaking other language at home (%)
Residents speaking other language at home - Born in the United States (%)
Residents speaking other language at home - Native, born elsewhere (%)
Residents speaking other language at home - Foreign born (%)
Marital status - Never married (%)
Marital status - Now married (%)
Marital status - Separated (%)
Marital status - Widowed (%)
Marital status - Divorced (%)
Ancestries Reported - Arab (%)
Ancestries Reported - Czech (%)
Ancestries Reported - Danish (%)
Ancestries Reported - Dutch (%)
Ancestries Reported - English (%)
Ancestries Reported - French (%)
Ancestries Reported - French Canadian (%)
Ancestries Reported - German (%)
Ancestries Reported - Greek (%)
Ancestries Reported - Hungarian (%)
Ancestries Reported - Irish (%)
Ancestries Reported - Italian (%)
Ancestries Reported - Lithuanian (%)
Ancestries Reported - Norwegian (%)
Ancestries Reported - Polish (%)
Ancestries Reported - Portuguese (%)
Ancestries Reported - Russian (%)
Ancestries Reported - Scotch-Irish (%)
Ancestries Reported - Scottish (%)
Ancestries Reported - Slovak (%)
Ancestries Reported - Subsaharan African (%)
Ancestries Reported - Swedish (%)
Ancestries Reported - Swiss (%)
Ancestries Reported - Ukrainian (%)
Ancestries Reported - United States (%)
Ancestries Reported - Welsh (%)
Ancestries Reported - West Indian (%)
Ancestries Reported - Other (%)
Geographical mobility - Same house 1 year ago (%)
Geographical mobility - Same house 1 year ago (%) - White
Geographical mobility - Same house 1 year ago (%) - Black or African American
Geographical mobility - Same house 1 year ago (%) - Asian
Geographical mobility - Same house 1 year ago (%) - Hispanic or Latino
Geographical mobility - Same house 1 year ago (%) - American Indian and Alaska Native
Geographical mobility - Same house 1 year ago (%) - Multirace
Geographical mobility - Same house 1 year ago (%) - Other Race
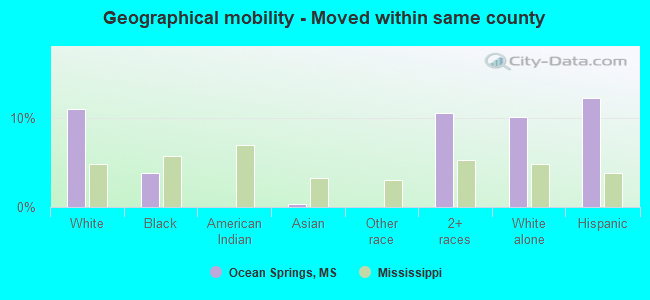
Geographical mobility - Moved within same county (%)
Geographical mobility - Moved within same county (%) - White
Geographical mobility - Moved within same county (%) - Black or African American
Geographical mobility - Moved within same county (%) - Asian
Geographical mobility - Moved within same county (%) - Hispanic or Latino
Geographical mobility - Moved within same county (%) - American Indian and Alaska Native
Geographical mobility - Moved within same county (%) - Multirace
Geographical mobility - Moved within same county (%) - Other Race
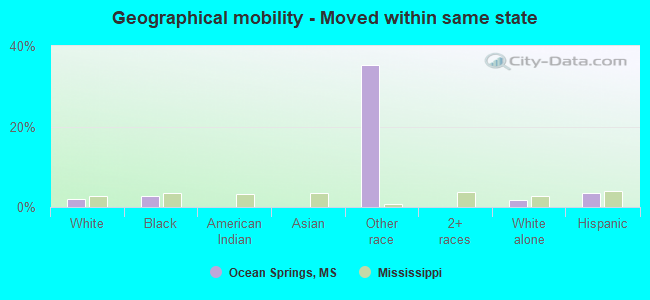
Geographical mobility - Moved from different county within same state (%)
Geographical mobility - Moved from different county within same state (%) - White
Geographical mobility - Moved from different county within same state (%) - Black or African American
Geographical mobility - Moved from different county within same state (%) - Asian
Geographical mobility - Moved from different county within same state (%) - Hispanic or Latino
Geographical mobility - Moved from different county within same state (%) - American Indian and Alaska Native
Geographical mobility - Moved from different county within same state (%) - Multirace
Geographical mobility - Moved from different county within same state (%) - Other Race
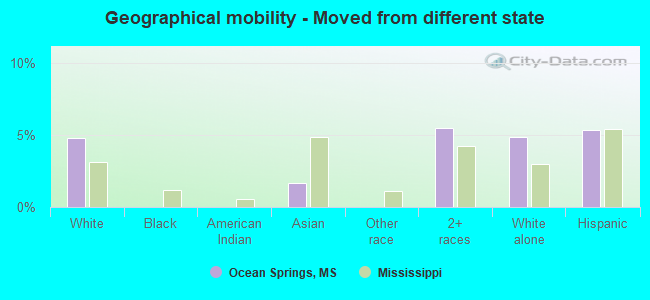
Geographical mobility - Moved from different state (%)
Geographical mobility - Moved from different state (%) - White
Geographical mobility - Moved from different state (%) - Black or African American
Geographical mobility - Moved from different state (%) - Asian
Geographical mobility - Moved from different state (%) - Hispanic or Latino
Geographical mobility - Moved from different state (%) - American Indian and Alaska Native
Geographical mobility - Moved from different state (%) - Multirace
Geographical mobility - Moved from different state (%) - Other Race
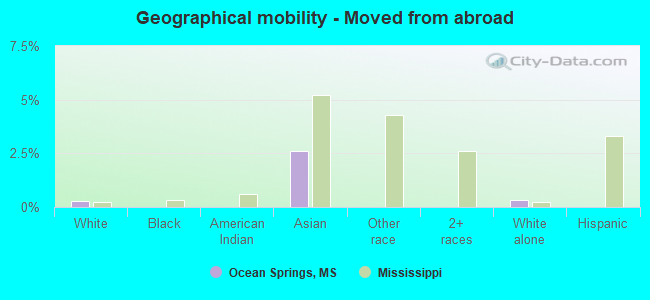
Geographical mobility - Moved from abroad (%)
Geographical mobility - Moved from abroad (%) - White
Geographical mobility - Moved from abroad (%) - Black or African American
Geographical mobility - Moved from abroad (%) - Asian
Geographical mobility - Moved from abroad (%) - Hispanic or Latino
Geographical mobility - Moved from abroad (%) - American Indian and Alaska Native
Geographical mobility - Moved from abroad (%) - Multirace
Geographical mobility - Moved from abroad (%) - Other Race
Place of birth for the foreign-born population - Ireland (%)
Place of birth for the foreign-born population - Denmark (%)
Place of birth for the foreign-born population - Norway (%)
Place of birth for the foreign-born population - Sweden (%)
Place of birth for the foreign-born population - United Kingdom (%)
Place of birth for the foreign-born population - England (%)
Place of birth for the foreign-born population - Scotland (%)
Place of birth for the foreign-born population - Other Northern Europe (%)
Place of birth for the foreign-born population - Austria (%)
Place of birth for the foreign-born population - Belgium (%)
Place of birth for the foreign-born population - France (%)
Place of birth for the foreign-born population - Germany (%)
Place of birth for the foreign-born population - Netherlands (%)
Place of birth for the foreign-born population - Switzerland (%)
Place of birth for the foreign-born population - Other Western Europe (%)
Place of birth for the foreign-born population - Greece (%)
Place of birth for the foreign-born population - Italy (%)
Place of birth for the foreign-born population - Portugal (%)
Place of birth for the foreign-born population - Spain (%)
Place of birth for the foreign-born population - Other Southern Europe (%)
Place of birth for the foreign-born population - Albania (%)
Place of birth for the foreign-born population - Belarus (%)
Place of birth for the foreign-born population - Bosnia and Herzegovina (%)
Place of birth for the foreign-born population - Bulgaria (%)
Place of birth for the foreign-born population - Croatia (%)
Place of birth for the foreign-born population - Czechoslovakia (%)
Place of birth for the foreign-born population - Hungary (%)
Place of birth for the foreign-born population - Latvia (%)
Place of birth for the foreign-born population - Lithuania (%)
Place of birth for the foreign-born population - North Macedonia (Macedonia) (%)
Place of birth for the foreign-born population - Moldova (%)
Place of birth for the foreign-born population - Poland (%)
Place of birth for the foreign-born population - Romania (%)
Place of birth for the foreign-born population - Russia (%)
Place of birth for the foreign-born population - Serbia (%)
Place of birth for the foreign-born population - Ukraine (%)
Place of birth for the foreign-born population - Other Eastern Europe (%)
Place of birth for the foreign-born population - China (%)
Place of birth for the foreign-born population - Hong Kong (%)
Place of birth for the foreign-born population - Taiwan (%)
Place of birth for the foreign-born population - Japan (%)
Place of birth for the foreign-born population - Korea (%)
Place of birth for the foreign-born population - Other Eastern Asia (%)
Place of birth for the foreign-born population - Afghanistan (%)
Place of birth for the foreign-born population - Bangladesh (%)
Place of birth for the foreign-born population - India (%)
Place of birth for the foreign-born population - Iran (%)
Place of birth for the foreign-born population - Kazakhstan (%)
Place of birth for the foreign-born population - Nepal (%)
Place of birth for the foreign-born population - Pakistan (%)
Place of birth for the foreign-born population - Sri Lanka (%)
Place of birth for the foreign-born population - Uzbekistan (%)
Place of birth for the foreign-born population - Other South Central Asia (%)
Place of birth for the foreign-born population - Burma (%)
Place of birth for the foreign-born population - Cambodia (%)
Place of birth for the foreign-born population - Indonesia (%)
Place of birth for the foreign-born population - Laos (%)
Place of birth for the foreign-born population - Malaysia (%)
Place of birth for the foreign-born population - Philippines (%)
Place of birth for the foreign-born population - Singapore (%)
Place of birth for the foreign-born population - Thailand (%)
Place of birth for the foreign-born population - Vietnam (%)
Place of birth for the foreign-born population - Other South Eastern Asia (%)
Place of birth for the foreign-born population - Armenia (%)
Place of birth for the foreign-born population - Iraq (%)
Place of birth for the foreign-born population - Israel (%)
Place of birth for the foreign-born population - Jordan (%)
Place of birth for the foreign-born population - Kuwait (%)
Place of birth for the foreign-born population - Lebanon (%)
Place of birth for the foreign-born population - Saudi Arabia (%)
Place of birth for the foreign-born population - Syria (%)
Place of birth for the foreign-born population - Turkey (%)
Place of birth for the foreign-born population - Yemen (%)
Place of birth for the foreign-born population - Other Western Asia (%)
Place of birth for the foreign-born population - Eritrea (%)
Place of birth for the foreign-born population - Ethiopia (%)
Place of birth for the foreign-born population - Kenya (%)
Place of birth for the foreign-born population - Somalia (%)
Place of birth for the foreign-born population - Uganda (%)
Place of birth for the foreign-born population - Zimbabwe (%)
Place of birth for the foreign-born population - Other Eastern Africa (%)
Place of birth for the foreign-born population - Cameroon (%)
Place of birth for the foreign-born population - Congo (%)
Place of birth for the foreign-born population - Democratic Republic of Congo (Zaire) (%)
Place of birth for the foreign-born population - Other Middle Africa (%)
Place of birth for the foreign-born population - Egypt (%)
Place of birth for the foreign-born population - Morocco (%)
Place of birth for the foreign-born population - Sudan (%)
Place of birth for the foreign-born population - Other Northern Africa (%)
Place of birth for the foreign-born population - South Africa (%)
Place of birth for the foreign-born population - Other Southern Africa (%)
Place of birth for the foreign-born population - Cabo Verde (%)
Place of birth for the foreign-born population - Ghana (%)
Place of birth for the foreign-born population - Liberia (%)
Place of birth for the foreign-born population - Nigeria (%)
Place of birth for the foreign-born population - Senegal (%)
Place of birth for the foreign-born population - Sierra Leone (%)
Place of birth for the foreign-born population - Other Western Africa (%)
Place of birth for the foreign-born population - Australia (%)
Place of birth for the foreign-born population - New Zealand (%)
Place of birth for the foreign-born population - Fiji (%)
Place of birth for the foreign-born population - Micronesia (%)
Place of birth for the foreign-born population - Bahamas (%)
Place of birth for the foreign-born population - Barbados (%)
Place of birth for the foreign-born population - Cuba (%)
Place of birth for the foreign-born population - Dominica (%)
Place of birth for the foreign-born population - Dominican Republic (%)
Place of birth for the foreign-born population - Grenada (%)
Place of birth for the foreign-born population - Haiti (%)
Place of birth for the foreign-born population - Jamaica (%)
Place of birth for the foreign-born population - St. Vincent and the Grenadines (%)
Place of birth for the foreign-born population - Trinidad and Tobago (%)
Place of birth for the foreign-born population - West Indies (%)
Place of birth for the foreign-born population - Other Caribbean (%)
Place of birth for the foreign-born population - Belize (%)
Place of birth for the foreign-born population - Costa Rica (%)
Place of birth for the foreign-born population - El Salvador (%)
Place of birth for the foreign-born population - Guatemala (%)
Place of birth for the foreign-born population - Honduras (%)
Place of birth for the foreign-born population - Mexico (%)
Place of birth for the foreign-born population - Nicaragua (%)
Place of birth for the foreign-born population - Panama (%)
Place of birth for the foreign-born population - Other Central America (%)
Place of birth for the foreign-born population - Argentina (%)
Place of birth for the foreign-born population - Bolivia (%)
Place of birth for the foreign-born population - Brazil (%)
Place of birth for the foreign-born population - Chile (%)
Place of birth for the foreign-born population - Colombia (%)
Place of birth for the foreign-born population - Ecuador (%)
Place of birth for the foreign-born population - Guyana (%)
Place of birth for the foreign-born population - Peru (%)
Place of birth for the foreign-born population - Uruguay (%)
Place of birth for the foreign-born population - Venezuela (%)
Place of birth for the foreign-born population - Other South America (%)
Place of birth for the foreign-born population - Canada (%)
Place of birth for the foreign-born population - Other Northern America (%)
Place of birth for the foreign-born population - Other (%)
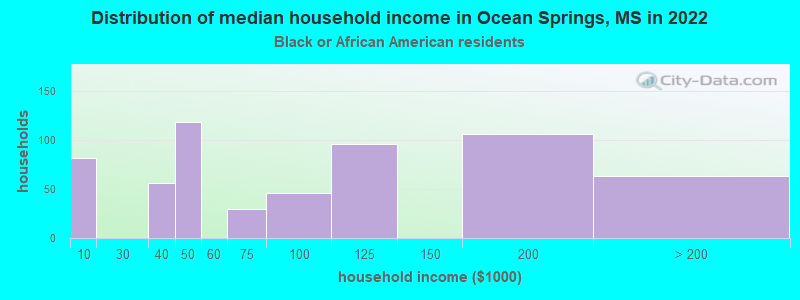
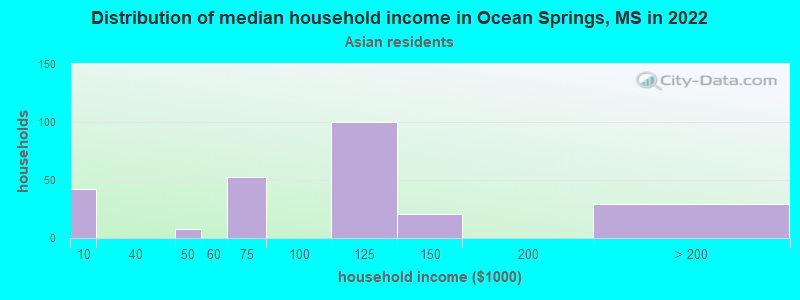
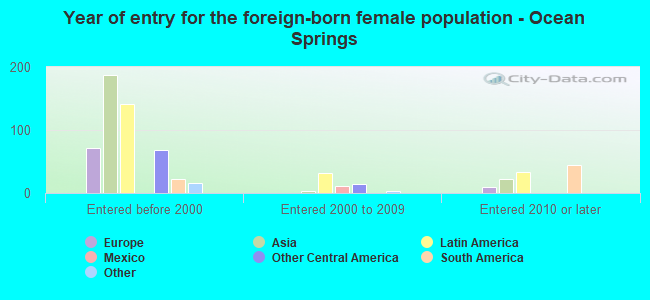
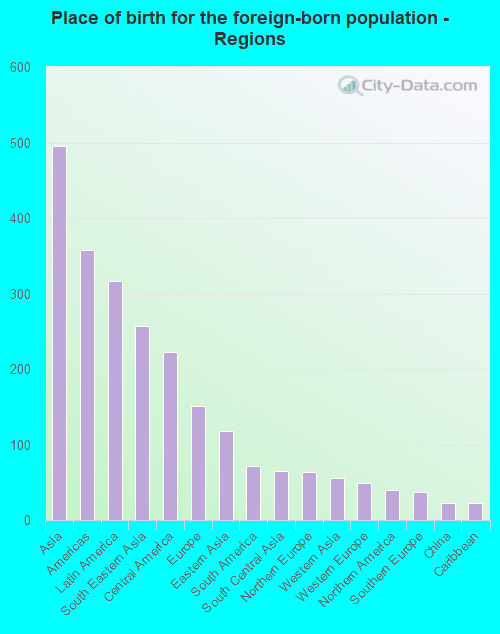
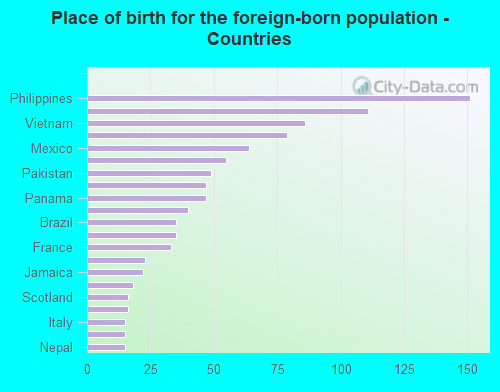
According to 2022 data, the most numerous races in Ocean Springs, MS are White alone (13,976 residents), Black alone (1,176 residents), and Hispanic (1,520 residents). 95.0% of Ocean Springs residents speak English at home. 5.4% of Ocean Springs, MS residents are foreign-born (2.6% born in Asia, 1.7% born in Latin America, 0.8% born in Europe), which is 63.0% greater than the foreign-born rate of 2.0% across the entire state of Mississippi.
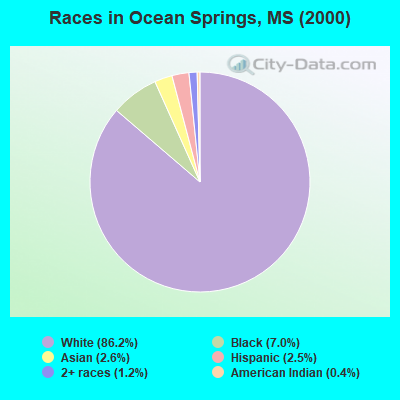
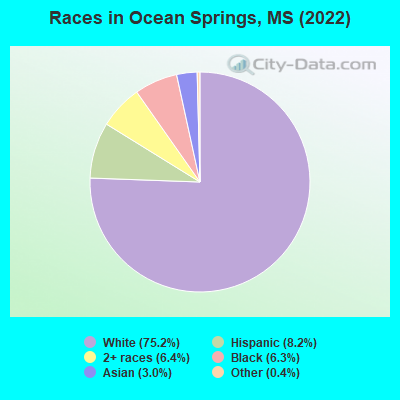
Race distribution in Ocean Springs
2000 2022
1,727,908 60.7% White alone 1,028,473 36.2% Black alone 39,569 1.4% Hispanic 17,272 0.6% Two or more races 18,349 0.6% Asian alone 11,224 0.4% American Indian alone 1,294 0.05% Other race alone 569 0.02% Native Hawaiian and Other
1,625,979 55.3% White alone 1,072,962 36.5% Black alone 97,177 3.3% Hispanic 96,367 3.3% Two or more races 25,217 0.9% Asian alone 12,457 0.4% American Indian alone 9,501 0.3% Other race alone 397 0.01% Native Hawaiian and Other
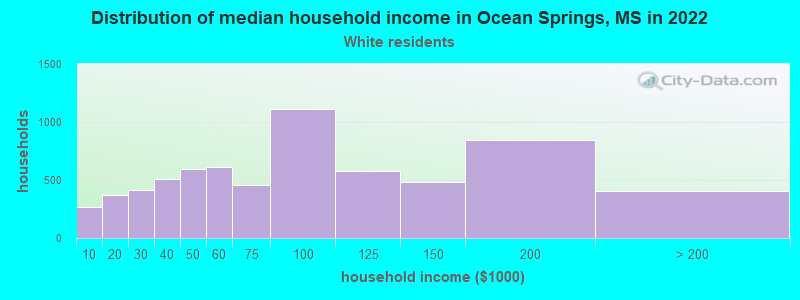
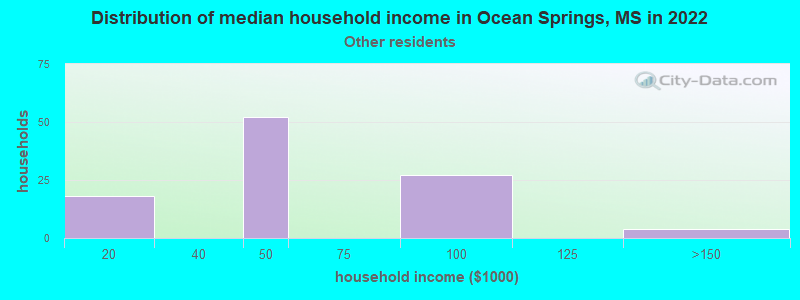
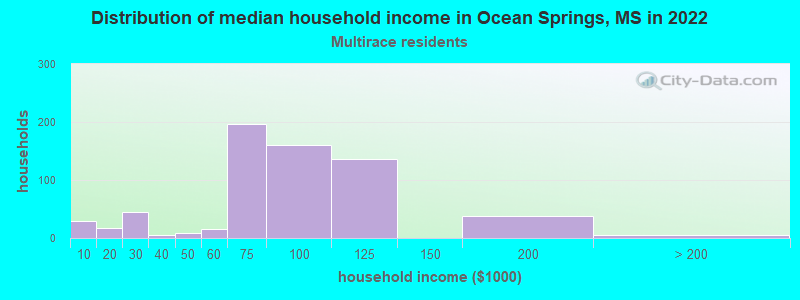
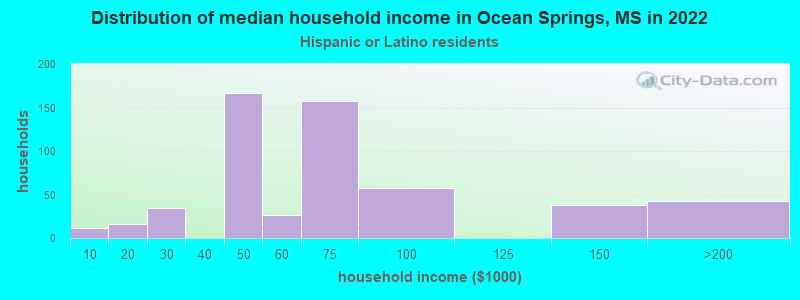
Income and house value in Ocean Springs Median household income in 2022 $73,754 White non-Hispanic householders$93,349 Black householders$73,576 Asian householders$66,765 Two or more races householders$112,705 Hispanic or Latino race householdersMedian 2022 house value $234,339 White Non-Hispanic householders$218,006 Black or African American householders$106,517 American Indian or Alaska Native householders $238,600 Asian householders$308,665 Two or more races householders$263,927 Hispanic or Latino householders
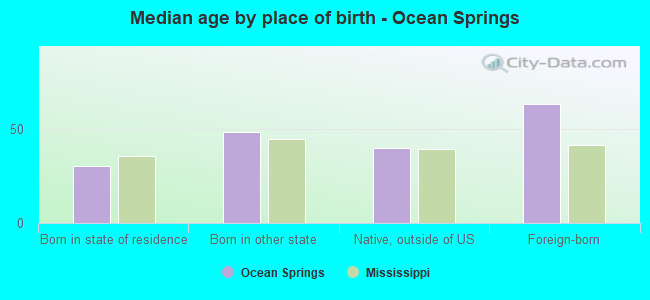
Median age by race in Ocean Springs
43.9 Median age for White residents43.3 45.2 49.6 Median age for Black or African American residents36.2 51.4 10.2 Median age for American Indian / Alaska Native residents10.7 -710,601,718.5 55.5 Median age for Asian residents71.4 52.2 -666,666,666.0 Median age for Native Hawaiian / Pacific Islander residents-666,666,666.0 -666,666,666.0 58.5 Median age for Other race residents60.1 54.3 37.5 Median age for Two or more races residents25.0 27.7 44.9 Median age for White alone residents44.6 45.3 21.5 Median age for Hispanic or Latino residents14.0 30.0
Owner/renter occupied households by race in Ocean Springs
House owners and renters - White residents 4,694 71.0% Owner occupied1,914 29.0% Renter occupiedHouse owners and renters - Black or African American residents 306 52.5% Owner occupied277 47.5% Renter occupiedHouse owners and renters - Asian residents 250 68.0% Owner occupied118 32.0% Renter occupiedHouse owners and renters - Other race residents 30 36.1% Owner occupied53 63.9% Renter occupiedHouse owners and renters - Two or more races residents 483 68.5% Owner occupied222 31.5% Renter occupiedHouse owners and renters - White alone residents 4,635 71.3% Owner occupied1,868 28.7% Renter occupiedHouse owners and renters - Hispanic or Latino residents 280 61.9% Owner occupied172 38.1% Renter occupied
Language usage in Ocean Springs
English speakers - Total 95.0% of residents of Ocean Springs speak English at home.
2.5% of residents speak Spanish at home 340 74.9% Speak English very well114 25.1% Speak English less than very well2.9% of residents speak other language at home 245 47.9% Speak English very well266 52.1% Speak English less than very well
English speakers - Born in the United States 96.9% of residents of Ocean Springs speak English at home.
1.1% of residents speak Spanish at home 68 71.6% Speak English very well27 28.4% Speak English less than very well1.1% of residents speak other language at home 28 28.0% Speak English very well72 72.0% Speak English less than very well
English speakers - Native, born elsewhere 69.7% of residents of Ocean Springs speak English at home.
0.7% of residents speak other language at home 2 100.0% Speak English very well
English speakers - Foreign-born 60.7% of residents of Ocean Springs speak English at home.
26.6% of residents speak Spanish at home 146 74.1% Speak English very well51 25.9% Speak English less than very well47.0% of residents speak other language at home 167 48.0% Speak English very well181 52.0% Speak English less than very well
White (Caucasian) - Speak only English Native:
98.5% (13,568)Foreign-born:
91.4% (201)
White (Caucasian) - Speak another language Native:
1.5% (208)Foreign-born:
57.5% (127)
Black or African American - Speak only English Native:
98.8% (1,089)Foreign-born:
92.9% (20)
Asian - Speak only English Native:
87.6% (305)Foreign-born:
35.5% (107)
Asian - Speak another language Native:
8.9% (31)Foreign-born:
68.2% (205)
Other race - Speak only English Native:
31.4% (20)Foreign-born:
42.8% (31)
Other race - Speak another language Native:
58.1% (36)Foreign-born:
62.9% (46)
Two or more races - Speak only English Native:
91.1% (1,378)Foreign-born:
77.3% (109)
Two or more races - Speak another language Native:
8.5% (129)Foreign-born:
1.0% (1)
White alone - Speak only English Native:
97.7% (12,964)Foreign-born:
85.0% (211)
White alone - Speak another language Native:
3.8% (507)Foreign-born:
18.9% (47)
Hispanic or Latino - Speak only English Native:
100.0% (1,359)Foreign-born:
31.7% (68)
Hispanic or Latino - Speak another language Native:
8.2% (111)Foreign-born:
85.2% (182)
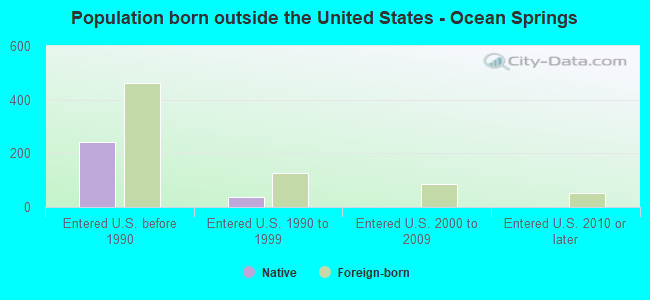
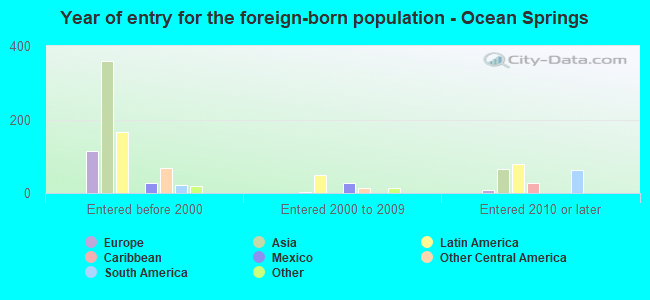
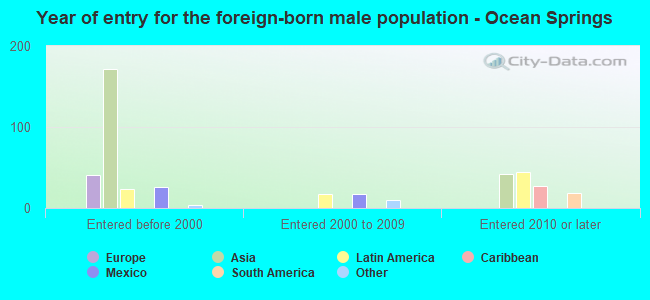
Foreign-born residents in Ocean Springs 1,005 residents are foreign born (2.6% Asia , 1.7% Latin America , 0.8% Europe ).
This city:
5.4%Mississippi:
2.3%
Marital status for residents in Ocean Springs Marital status - White (Caucasian) population 15 years and over
Males 25.9% Never married56.5% Now married0.4% Separated2.1% Widowed15.2% DivorcedFemales 17.8% Never married52.7% Now married1.1% Separated12.3% Widowed16.1% DivorcedWomen who gave birth in the past 12 months Now married:
100.0% (116)Unmarried:
0.0% (0)
Women who did not give birth in the past 12 months Now married:
51.2% (1,373)Unmarried:
48.8% (1,309)
Marital status - Black or African American population 15 years and over
Males 49.6% Never married40.9% Now married0.0% Separated0.0% Widowed9.4% DivorcedFemales 19.9% Never married44.1% Now married0.0% Separated12.0% Widowed24.0% DivorcedWomen who did not give birth in the past 12 months Now married:
31.5% (77)Unmarried:
68.5% (168)
Marital status - American Indian / Alaska Native population 15 years and over
Males 100.0% Never married0.0% Now married0.0% Separated0.0% Widowed0.0% DivorcedFemales 0.0% Never married100.0% Now married0.0% Separated0.0% Widowed0.0% DivorcedWomen who did not give birth in the past 12 months Now married:
100.0% (1)Unmarried:
0.0% (0)
Marital status - Asian population 15 years and over
Males 33.9% Never married54.0% Now married8.5% Separated0.0% Widowed3.7% DivorcedFemales 35.9% Never married54.2% Now married0.0% Separated9.9% Widowed0.0% DivorcedWomen who did not give birth in the past 12 months Now married:
41.5% (93)Unmarried:
58.5% (131)
Marital status - Other race population 15 years and over
Males 61.5% Never married38.5% Now married0.0% Separated0.0% Widowed0.0% DivorcedFemales 0.0% Never married66.0% Now married0.0% Separated0.0% Widowed34.0% DivorcedWomen who did not give birth in the past 12 months Now married:
66.0% (100)Unmarried:
34.0% (52)
Marital status - Two or more races population 15 years and over
Males 48.8% Never married22.2% Now married14.4% Separated0.0% Widowed14.6% DivorcedFemales 36.9% Never married32.1% Now married0.0% Separated5.7% Widowed25.2% DivorcedWomen who did not give birth in the past 12 months Now married:
24.1% (87)Unmarried:
75.9% (276)
Marital status - White alone, not Hispanic / Latino population 15 years and over
Males 24.4% Never married57.4% Now married0.4% Separated2.2% Widowed15.7% DivorcedFemales 18.2% Never married53.1% Now married0.9% Separated12.8% Widowed14.9% DivorcedWomen who gave birth in the past 12 months Now married:
100.0% (119)Unmarried:
0.0% (0)
Women who did not give birth in the past 12 months Now married:
51.5% (1,310)Unmarried:
48.5% (1,235)
Marital status - Hispanic or Latino population 15 years and over
Males 70.5% Never married29.5% Now married0.0% Separated0.0% Widowed0.0% DivorcedFemales 13.9% Never married44.2% Now married3.7% Separated0.0% Widowed38.2% DivorcedWomen who did not give birth in the past 12 months Now married:
43.3% (176)Unmarried:
56.7% (231)
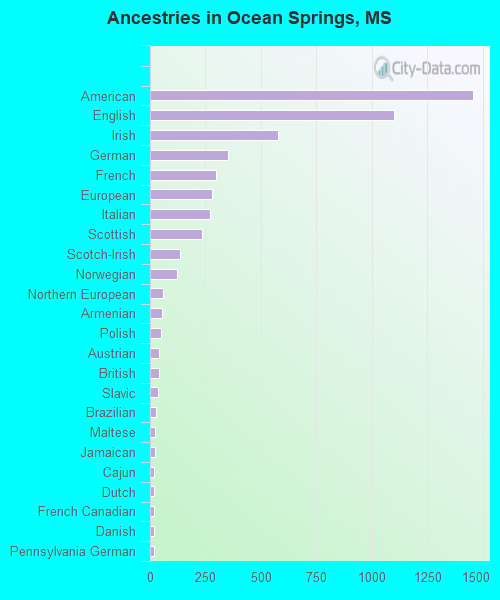
Ancestries in Ocean Springs
1,456 18.3% American1,102 13.9% English576 7.3% Irish352 4.4% German296 3.7% French279 3.5% European271 3.4% Italian235 3.0% Scottish136 1.7% Scotch-Irish124 1.6% Norwegian60 0.8% Northern European52 0.7% Armenian49 0.6% Polish41 0.5% Austrian41 0.5% British38 0.5% Slavic26 0.3% Brazilian22 0.3% Maltese22 0.3% Jamaican19 0.2% Cajun19 0.2% Dutch18 0.2% French Canadian16 0.2% Danish16 0.2% Pennsylvania German13 0.2% Greek13 0.2% Swedish10 0.1% Canadian10 0.1% Portuguese9 0.1% Hungarian6 0.08% Eastern European
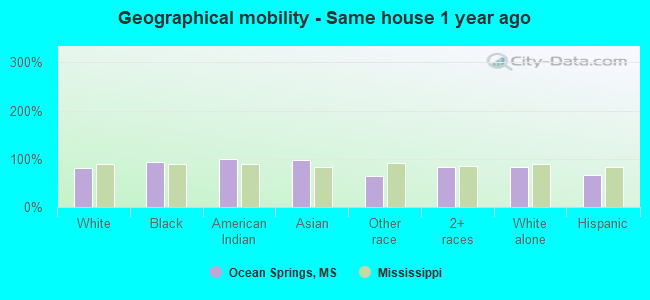
Geographical mobility in Ocean Springs Same house 1 year ago 11,689 80.6% White (Caucasian)1,177 93.6% Black or African American26 99.4% American Indian / Alaska Native759 96.9% Asian161 64.7% Other race1,520 83.2% Two or more races11,464 82.2% White alone, not Hispanic / Latino972 66.2% Hispanic or LatinoMoved within same county 1,592 11.0% White / Caucasian48 3.8% Black or African American3 0.4% Asian192 10.5% Two or more races1,407 10.1% White alone, not Hispanic / Latino179 12.2% Hispanic or LatinoMoved within same state 291 2.0% White / Caucasian35 2.8% Black or African American88 35.3% Other race252 1.8% White alone, not Hispanic / Latino50 3.4% Hispanic or LatinoMoved from different state 700 4.8% White / Caucasian13 1.7% Asian101 5.5% Two or more races683 4.9% White alone, not Hispanic / Latino78 5.3% Hispanic or LatinoMoved from abroad 41 0.3% White20 2.6% Asian48 0.3% White alone, not Hispanic / Latino
Children Nativity (place of birth) in Ocean Springs
Children under 6 years - Living with two parents Both parents native 541 100.0% NativeChildren under 6 years - Living with one parent Native parent 213 100.0% NativeForeign-born parent 84 100.0% NativeChildren 6 to 17 years - Living with two parents Both parents native 2,105 100.0% NativeBoth parents foreign-born 48 100.0% NativeOne native, one foreign-born parent 95 93.2% Native7 6.8% Foreign-bornChildren 6 to 17 years - Living with one parent Native parent 798 100.0% NativeForeign-born parent 109 50.4% Native107 49.6% Foreign-born
Grandparents responsible for own grandchildren in Ocean Springs
Grandparents (30 to 59 years) White / Caucasian 13 27.7% Responsible for grandchildren35 72.3% Not responsible for grandchildrenWhite alone, not Hispanic / Latino 13 24.4% Responsible for grandchildren42 75.6% Not responsible for grandchildrenHispanic or Latino 30 100.0% Not responsible for grandchildrenGrandparents (60 years and over) White / Caucasian 15 7.3% Responsible for grandchildren187 92.7% Not responsible for grandchildrenWhite alone, not Hispanic / Latino 15 9.3% Responsible for grandchildren142 90.7% Not responsible for grandchildrenHispanic or Latino 50 100.0% Not responsible for grandchildren