Races in Oroville, Washington (WA) Detailed Stats
Data:
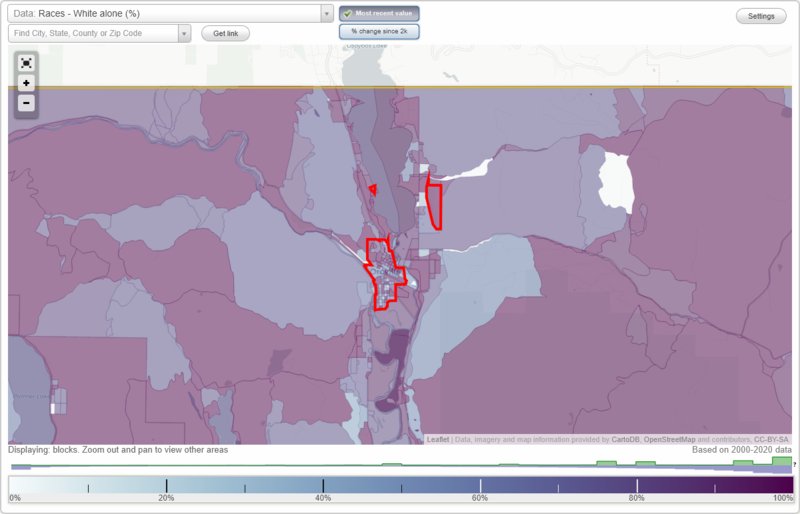
Races - White alone (%)
Races - White alone (% change since 2000)
Races - Black alone (%)
Races - Black alone (% change since 2000)
Races - American Indian alone (%)
Races - American Indian alone (% change since 2000)
Races - Asian alone (%)
Races - Asian alone (% change since 2000)
Races - Hispanic (%)
Races - Hispanic (% change since 2000)
Races - Native Hawaiian and Other Pacific Islander alone (%)
Races - Native Hawaiian and Other Pacific Islander alone (% change since 2000)
Races - Two or more races(%)
Races - Two or more races(% change since 2000)
Races - Other race alone (%)
Races - Other race alone (% change since 2000)
Racial diversity
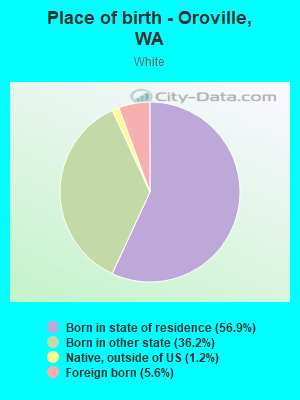
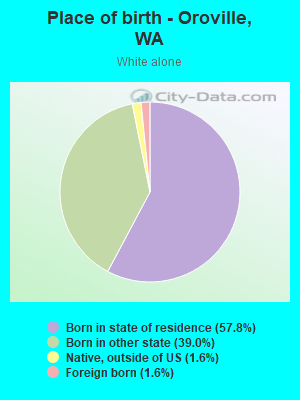
Place of birth - Born in state of residence (%)
Place of birth - Born in state of residence (%) - White
Place of birth - Born in state of residence (%) - Black or African American
Place of birth - Born in state of residence (%) - Asian
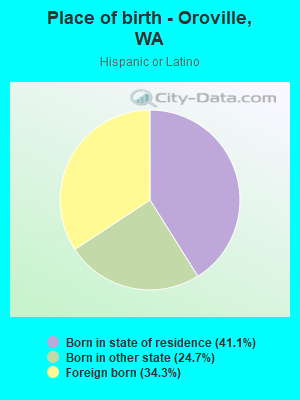
Place of birth - Born in state of residence (%) - Hispanic or Latino
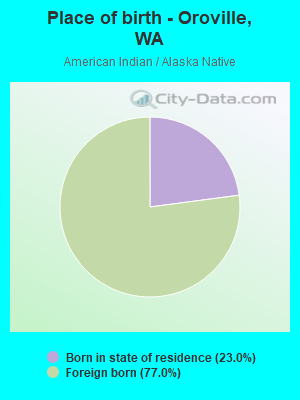
Place of birth - Born in state of residence (%) - American Indian and Alaska Native
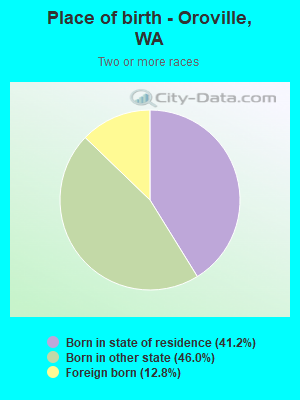
Place of birth - Born in state of residence (%) - Multirace
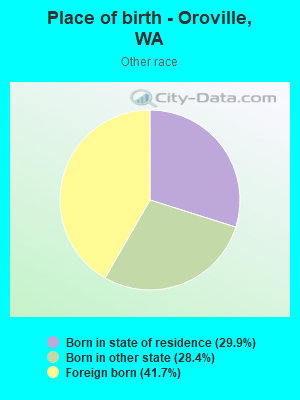
Place of birth - Born in state of residence (%) - Other Race
Place of birth - Born in other state (%)
Place of birth - Born in other state (%) - White
Place of birth - Born in other state (%) - Black or African American
Place of birth - Born in other state (%) - Asian
Place of birth - Born in other state (%) - Hispanic or Latino
Place of birth - Born in other state (%) - American Indian and Alaska Native
Place of birth - Born in other state (%) - Multirace
Place of birth - Born in other state (%) - Other Race
Place of birth - Native, outside of US (%)
Place of birth - Native, outside of US (%) - White
Place of birth - Native, outside of US (%) - Black or African American
Place of birth - Native, outside of US (%) - Asian
Place of birth - Native, outside of US (%) - Hispanic or Latino
Place of birth - Native, outside of US (%) - American Indian and Alaska Native
Place of birth - Native, outside of US (%) - Multirace
Place of birth - Native, outside of US (%) - Other Race
Place of birth - Foreign born (%)
Place of birth - Foreign born (%) - White
Place of birth - Foreign born (%) - Black or African American
Place of birth - Foreign born (%) - Asian
Place of birth - Foreign born (%) - Hispanic or Latino
Place of birth - Foreign born (%) - American Indian and Alaska Native
Place of birth - Foreign born (%) - Multirace
Place of birth - Foreign born (%) - Other Race
Residents speaking English at home (%)
Residents speaking English at home - Born in the United States (%)
Residents speaking English at home - Native, born elsewhere (%)
Residents speaking English at home - Foreign born (%)
Residents speaking Spanish at home (%)
Residents speaking Spanish at home - Born in the United States (%)
Residents speaking Spanish at home - Native, born elsewhere (%)
Residents speaking Spanish at home - Foreign born (%)
Residents speaking other language at home (%)
Residents speaking other language at home - Born in the United States (%)
Residents speaking other language at home - Native, born elsewhere (%)
Residents speaking other language at home - Foreign born (%)
Marital status - Never married (%)
Marital status - Now married (%)
Marital status - Separated (%)
Marital status - Widowed (%)
Marital status - Divorced (%)
Ancestries Reported - Arab (%)
Ancestries Reported - Czech (%)
Ancestries Reported - Danish (%)
Ancestries Reported - Dutch (%)
Ancestries Reported - English (%)
Ancestries Reported - French (%)
Ancestries Reported - French Canadian (%)
Ancestries Reported - German (%)
Ancestries Reported - Greek (%)
Ancestries Reported - Hungarian (%)
Ancestries Reported - Irish (%)
Ancestries Reported - Italian (%)
Ancestries Reported - Lithuanian (%)
Ancestries Reported - Norwegian (%)
Ancestries Reported - Polish (%)
Ancestries Reported - Portuguese (%)
Ancestries Reported - Russian (%)
Ancestries Reported - Scotch-Irish (%)
Ancestries Reported - Scottish (%)
Ancestries Reported - Slovak (%)
Ancestries Reported - Subsaharan African (%)
Ancestries Reported - Swedish (%)
Ancestries Reported - Swiss (%)
Ancestries Reported - Ukrainian (%)
Ancestries Reported - United States (%)
Ancestries Reported - Welsh (%)
Ancestries Reported - West Indian (%)
Ancestries Reported - Other (%)
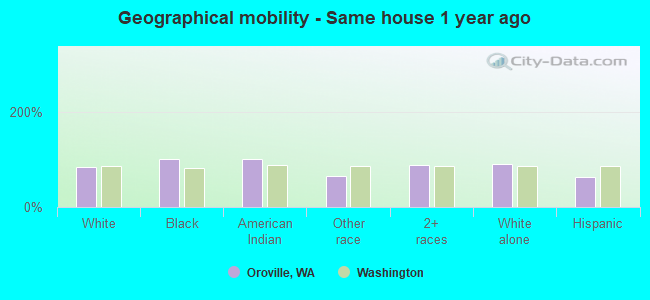
Geographical mobility - Same house 1 year ago (%)
Geographical mobility - Same house 1 year ago (%) - White
Geographical mobility - Same house 1 year ago (%) - Black or African American
Geographical mobility - Same house 1 year ago (%) - Asian
Geographical mobility - Same house 1 year ago (%) - Hispanic or Latino
Geographical mobility - Same house 1 year ago (%) - American Indian and Alaska Native
Geographical mobility - Same house 1 year ago (%) - Multirace
Geographical mobility - Same house 1 year ago (%) - Other Race
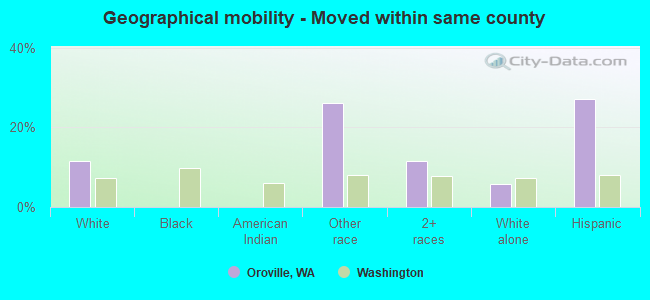
Geographical mobility - Moved within same county (%)
Geographical mobility - Moved within same county (%) - White
Geographical mobility - Moved within same county (%) - Black or African American
Geographical mobility - Moved within same county (%) - Asian
Geographical mobility - Moved within same county (%) - Hispanic or Latino
Geographical mobility - Moved within same county (%) - American Indian and Alaska Native
Geographical mobility - Moved within same county (%) - Multirace
Geographical mobility - Moved within same county (%) - Other Race
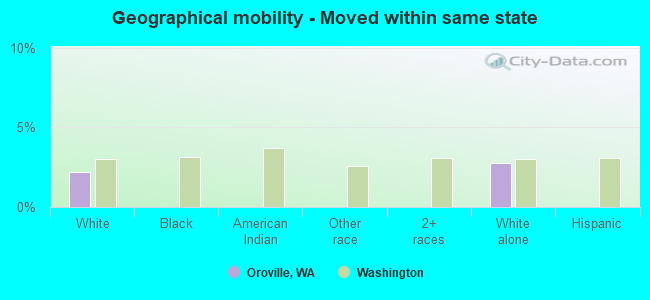
Geographical mobility - Moved from different county within same state (%)
Geographical mobility - Moved from different county within same state (%) - White
Geographical mobility - Moved from different county within same state (%) - Black or African American
Geographical mobility - Moved from different county within same state (%) - Asian
Geographical mobility - Moved from different county within same state (%) - Hispanic or Latino
Geographical mobility - Moved from different county within same state (%) - American Indian and Alaska Native
Geographical mobility - Moved from different county within same state (%) - Multirace
Geographical mobility - Moved from different county within same state (%) - Other Race
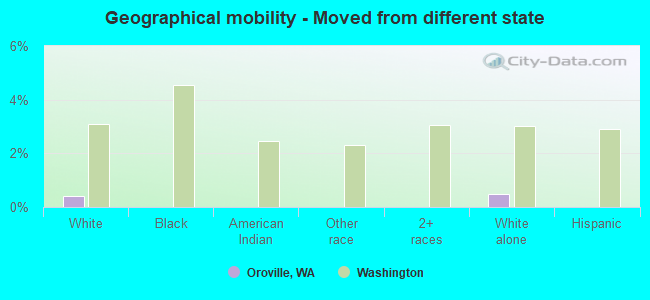
Geographical mobility - Moved from different state (%)
Geographical mobility - Moved from different state (%) - White
Geographical mobility - Moved from different state (%) - Black or African American
Geographical mobility - Moved from different state (%) - Asian
Geographical mobility - Moved from different state (%) - Hispanic or Latino
Geographical mobility - Moved from different state (%) - American Indian and Alaska Native
Geographical mobility - Moved from different state (%) - Multirace
Geographical mobility - Moved from different state (%) - Other Race
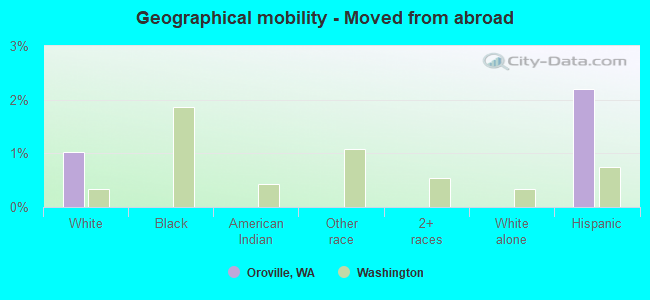
Geographical mobility - Moved from abroad (%)
Geographical mobility - Moved from abroad (%) - White
Geographical mobility - Moved from abroad (%) - Black or African American
Geographical mobility - Moved from abroad (%) - Asian
Geographical mobility - Moved from abroad (%) - Hispanic or Latino
Geographical mobility - Moved from abroad (%) - American Indian and Alaska Native
Geographical mobility - Moved from abroad (%) - Multirace
Geographical mobility - Moved from abroad (%) - Other Race
Place of birth for the foreign-born population - Ireland (%)
Place of birth for the foreign-born population - Denmark (%)
Place of birth for the foreign-born population - Norway (%)
Place of birth for the foreign-born population - Sweden (%)
Place of birth for the foreign-born population - United Kingdom (%)
Place of birth for the foreign-born population - England (%)
Place of birth for the foreign-born population - Scotland (%)
Place of birth for the foreign-born population - Other Northern Europe (%)
Place of birth for the foreign-born population - Austria (%)
Place of birth for the foreign-born population - Belgium (%)
Place of birth for the foreign-born population - France (%)
Place of birth for the foreign-born population - Germany (%)
Place of birth for the foreign-born population - Netherlands (%)
Place of birth for the foreign-born population - Switzerland (%)
Place of birth for the foreign-born population - Other Western Europe (%)
Place of birth for the foreign-born population - Greece (%)
Place of birth for the foreign-born population - Italy (%)
Place of birth for the foreign-born population - Portugal (%)
Place of birth for the foreign-born population - Spain (%)
Place of birth for the foreign-born population - Other Southern Europe (%)
Place of birth for the foreign-born population - Albania (%)
Place of birth for the foreign-born population - Belarus (%)
Place of birth for the foreign-born population - Bosnia and Herzegovina (%)
Place of birth for the foreign-born population - Bulgaria (%)
Place of birth for the foreign-born population - Croatia (%)
Place of birth for the foreign-born population - Czechoslovakia (%)
Place of birth for the foreign-born population - Hungary (%)
Place of birth for the foreign-born population - Latvia (%)
Place of birth for the foreign-born population - Lithuania (%)
Place of birth for the foreign-born population - North Macedonia (Macedonia) (%)
Place of birth for the foreign-born population - Moldova (%)
Place of birth for the foreign-born population - Poland (%)
Place of birth for the foreign-born population - Romania (%)
Place of birth for the foreign-born population - Russia (%)
Place of birth for the foreign-born population - Serbia (%)
Place of birth for the foreign-born population - Ukraine (%)
Place of birth for the foreign-born population - Other Eastern Europe (%)
Place of birth for the foreign-born population - China (%)
Place of birth for the foreign-born population - Hong Kong (%)
Place of birth for the foreign-born population - Taiwan (%)
Place of birth for the foreign-born population - Japan (%)
Place of birth for the foreign-born population - Korea (%)
Place of birth for the foreign-born population - Other Eastern Asia (%)
Place of birth for the foreign-born population - Afghanistan (%)
Place of birth for the foreign-born population - Bangladesh (%)
Place of birth for the foreign-born population - India (%)
Place of birth for the foreign-born population - Iran (%)
Place of birth for the foreign-born population - Kazakhstan (%)
Place of birth for the foreign-born population - Nepal (%)
Place of birth for the foreign-born population - Pakistan (%)
Place of birth for the foreign-born population - Sri Lanka (%)
Place of birth for the foreign-born population - Uzbekistan (%)
Place of birth for the foreign-born population - Other South Central Asia (%)
Place of birth for the foreign-born population - Burma (%)
Place of birth for the foreign-born population - Cambodia (%)
Place of birth for the foreign-born population - Indonesia (%)
Place of birth for the foreign-born population - Laos (%)
Place of birth for the foreign-born population - Malaysia (%)
Place of birth for the foreign-born population - Philippines (%)
Place of birth for the foreign-born population - Singapore (%)
Place of birth for the foreign-born population - Thailand (%)
Place of birth for the foreign-born population - Vietnam (%)
Place of birth for the foreign-born population - Other South Eastern Asia (%)
Place of birth for the foreign-born population - Armenia (%)
Place of birth for the foreign-born population - Iraq (%)
Place of birth for the foreign-born population - Israel (%)
Place of birth for the foreign-born population - Jordan (%)
Place of birth for the foreign-born population - Kuwait (%)
Place of birth for the foreign-born population - Lebanon (%)
Place of birth for the foreign-born population - Saudi Arabia (%)
Place of birth for the foreign-born population - Syria (%)
Place of birth for the foreign-born population - Turkey (%)
Place of birth for the foreign-born population - Yemen (%)
Place of birth for the foreign-born population - Other Western Asia (%)
Place of birth for the foreign-born population - Eritrea (%)
Place of birth for the foreign-born population - Ethiopia (%)
Place of birth for the foreign-born population - Kenya (%)
Place of birth for the foreign-born population - Somalia (%)
Place of birth for the foreign-born population - Uganda (%)
Place of birth for the foreign-born population - Zimbabwe (%)
Place of birth for the foreign-born population - Other Eastern Africa (%)
Place of birth for the foreign-born population - Cameroon (%)
Place of birth for the foreign-born population - Congo (%)
Place of birth for the foreign-born population - Democratic Republic of Congo (Zaire) (%)
Place of birth for the foreign-born population - Other Middle Africa (%)
Place of birth for the foreign-born population - Egypt (%)
Place of birth for the foreign-born population - Morocco (%)
Place of birth for the foreign-born population - Sudan (%)
Place of birth for the foreign-born population - Other Northern Africa (%)
Place of birth for the foreign-born population - South Africa (%)
Place of birth for the foreign-born population - Other Southern Africa (%)
Place of birth for the foreign-born population - Cabo Verde (%)
Place of birth for the foreign-born population - Ghana (%)
Place of birth for the foreign-born population - Liberia (%)
Place of birth for the foreign-born population - Nigeria (%)
Place of birth for the foreign-born population - Senegal (%)
Place of birth for the foreign-born population - Sierra Leone (%)
Place of birth for the foreign-born population - Other Western Africa (%)
Place of birth for the foreign-born population - Australia (%)
Place of birth for the foreign-born population - New Zealand (%)
Place of birth for the foreign-born population - Fiji (%)
Place of birth for the foreign-born population - Micronesia (%)
Place of birth for the foreign-born population - Bahamas (%)
Place of birth for the foreign-born population - Barbados (%)
Place of birth for the foreign-born population - Cuba (%)
Place of birth for the foreign-born population - Dominica (%)
Place of birth for the foreign-born population - Dominican Republic (%)
Place of birth for the foreign-born population - Grenada (%)
Place of birth for the foreign-born population - Haiti (%)
Place of birth for the foreign-born population - Jamaica (%)
Place of birth for the foreign-born population - St. Vincent and the Grenadines (%)
Place of birth for the foreign-born population - Trinidad and Tobago (%)
Place of birth for the foreign-born population - West Indies (%)
Place of birth for the foreign-born population - Other Caribbean (%)
Place of birth for the foreign-born population - Belize (%)
Place of birth for the foreign-born population - Costa Rica (%)
Place of birth for the foreign-born population - El Salvador (%)
Place of birth for the foreign-born population - Guatemala (%)
Place of birth for the foreign-born population - Honduras (%)
Place of birth for the foreign-born population - Mexico (%)
Place of birth for the foreign-born population - Nicaragua (%)
Place of birth for the foreign-born population - Panama (%)
Place of birth for the foreign-born population - Other Central America (%)
Place of birth for the foreign-born population - Argentina (%)
Place of birth for the foreign-born population - Bolivia (%)
Place of birth for the foreign-born population - Brazil (%)
Place of birth for the foreign-born population - Chile (%)
Place of birth for the foreign-born population - Colombia (%)
Place of birth for the foreign-born population - Ecuador (%)
Place of birth for the foreign-born population - Guyana (%)
Place of birth for the foreign-born population - Peru (%)
Place of birth for the foreign-born population - Uruguay (%)
Place of birth for the foreign-born population - Venezuela (%)
Place of birth for the foreign-born population - Other South America (%)
Place of birth for the foreign-born population - Canada (%)
Place of birth for the foreign-born population - Other Northern America (%)
Place of birth for the foreign-born population - Other (%)
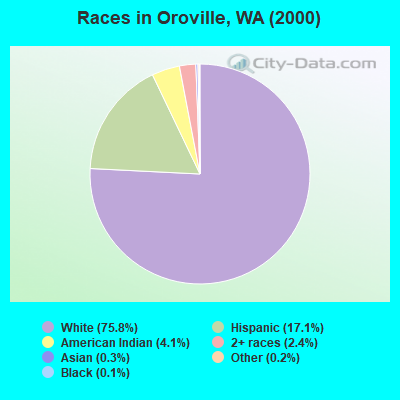
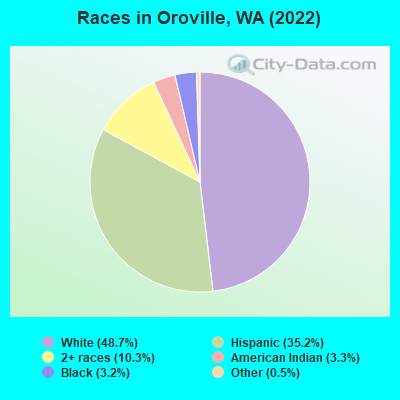
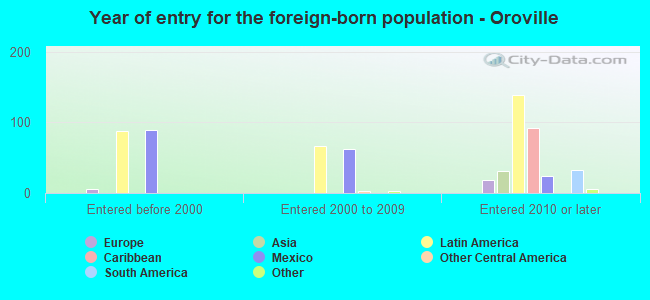
According to 2022 data, the most numerous races in Oroville, WA are White alone (864 residents), Hispanic (624 residents), and Asian alone (0 residents). 76.6% of Oroville residents speak English at home. 18.6% of Oroville, WA residents are foreign-born (15.0% born in Latin America), which is 19.3% greater than the foreign-born rate of 15.0% across the entire state of Washington.
Race distribution in Oroville
2000 2022
4,652,490 78.9% White alone 441,509 7.5% Hispanic 319,401 5.4% Asian alone 184,631 3.1% Black alone 175,926 3.0% Two or more races 85,396 1.4% American Indian alone 22,779 0.4% Native Hawaiian and Other 11,989 0.2% Other race alone
4,941,456 63.5% White alone 1,093,313 14.0% Hispanic 755,832 9.7% Asian alone 523,448 6.7% Two or more races 299,537 3.8% Black alone 69,024 0.9% American Indian alone 52,231 0.7% Native Hawaiian and Other 50,945 0.7% Other race alone
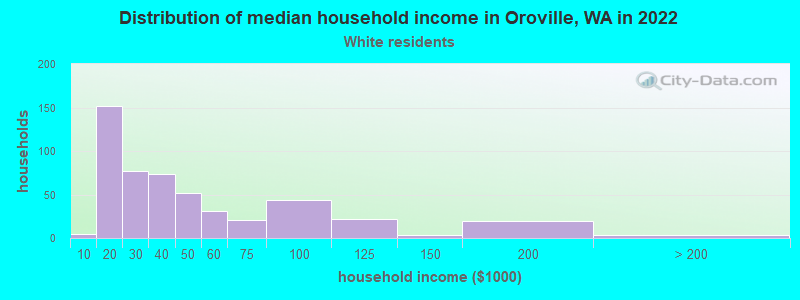
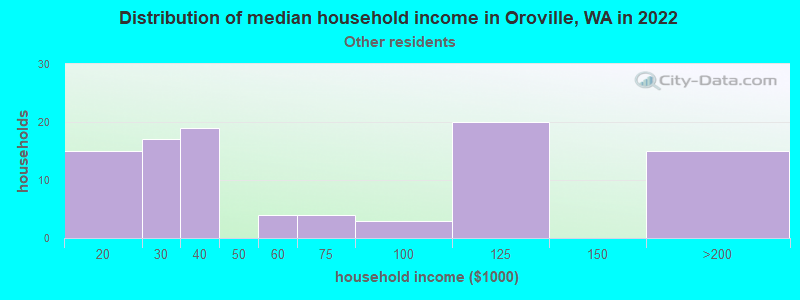
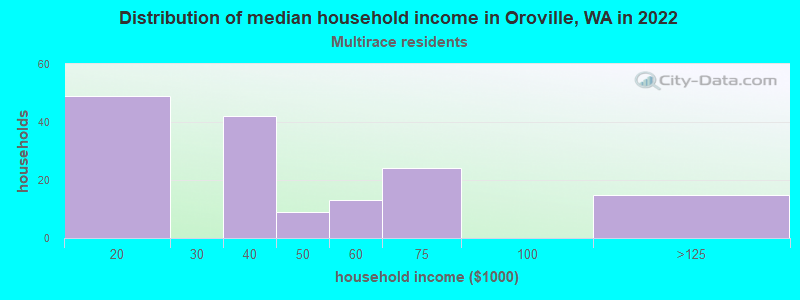
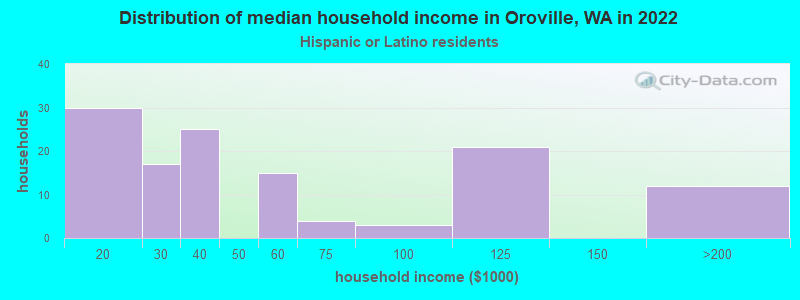
Income and house value in Oroville Median household income in 2022 $30,973 White non-Hispanic householders$33,492 Two or more races householders$40,591 Hispanic or Latino race householdersMedian 2022 house value $205,457 White Non-Hispanic householders$103,539 American Indian or Alaska Native householders$189,237 Some other race householders$87,860 Two or more races householders$175,720 Hispanic or Latino householders
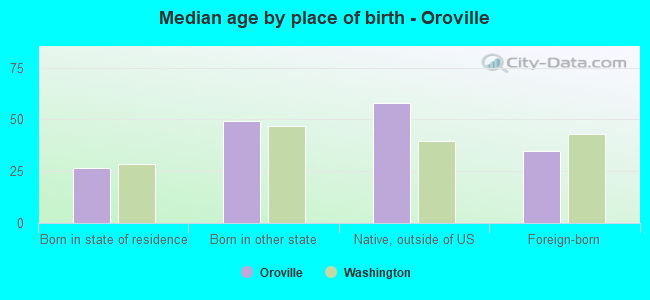
Median age by race in Oroville
50.1 Median age for White residents50.3 45.4 36.4 Median age for Black or African American residents35.8 -711,934,155.7 20.9 Median age for American Indian / Alaska Native residents-639,498,432.0 -626,984,126.4 -672,131,146.9 Median age for Asian residents-678,127,984.0 -673,647,468.8 -681,388,011.9 Median age for Native Hawaiian / Pacific Islander residents-696,774,192.9 -666,666,666.0 20.6 Median age for Other race residents19.0 21.5 30.7 Median age for Two or more races residents27.7 52.6 54.2 Median age for White alone residents54.3 54.0 14.9 Median age for Hispanic or Latino residents11.8 20.9
Owner/renter occupied households by race in Oroville
House owners and renters - White residents 290 56.0% Owner occupied228 44.0% Renter occupiedHouse owners and renters - American Indian / Alaska Native residents 26 100.0% Owner occupiedHouse owners and renters - Other race residents 31 34.5% Owner occupied59 65.5% Renter occupiedHouse owners and renters - Two or more races residents 68 46.7% Owner occupied78 53.3% Renter occupiedHouse owners and renters - White alone residents 289 56.9% Owner occupied219 43.1% Renter occupiedHouse owners and renters - Hispanic or Latino residents 39 30.9% Owner occupied87 69.1% Renter occupied
Language usage in Oroville
English speakers - Total 76.6% of residents of Oroville speak English at home.
22.6% of residents speak Spanish at home 231 63.8% Speak English very well131 36.2% Speak English less than very well0.4% of residents speak other language at home 7 100.0% Speak English very well
English speakers - Born in the United States 83.4% of residents of Oroville speak English at home.
17.2% of residents speak Spanish at home 98 96.1% Speak English very well4 3.9% Speak English less than very well
English speakers - Native, born elsewhere 92.9% of residents of Oroville speak English at home.
English speakers - Foreign-born 37.9% of residents of Oroville speak English at home.
58.2% of residents speak Spanish at home 74 38.5% Speak English very well118 61.5% Speak English less than very well2.1% of residents speak other language at home 7 100.0% Speak English very well
White (Caucasian) - Speak only English Native:
97.8% (864)Foreign-born:
10.6% (6)
White (Caucasian) - Speak another language Native:
2.5% (22)Foreign-born:
86.6% (51)
American Indian / Alaska Native - Speak only English Native:
97.5% (16)Foreign-born:
67.1% (38)
Other race - Speak only English Native:
13.5% (23)Foreign-born:
16.1% (22)
Other race - Speak another language Native:
82.2% (140)Foreign-born:
83.8% (115)
Two or more races - Speak another language Native:
5.2% (12)Foreign-born:
100.0% (41)
White alone - Speak only English Native:
99.5% (814)Foreign-born:
46.8% (6)
White alone - Speak another language Native:
0.5% (4)Foreign-born:
52.0% (7)
Hispanic or Latino - Speak only English Native:
35.9% (95)Foreign-born:
9.2% (20)
Hispanic or Latino - Speak another language Native:
62.6% (166)Foreign-born:
90.6% (193)
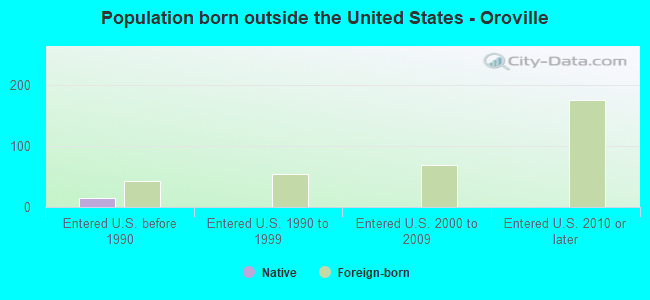
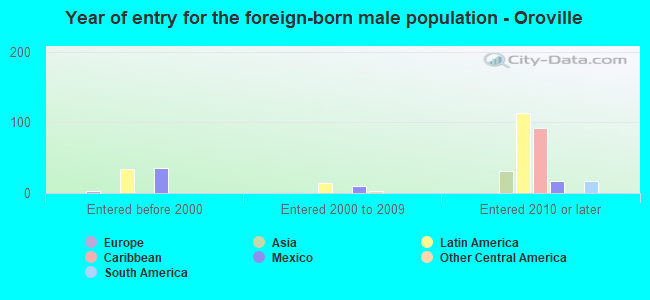
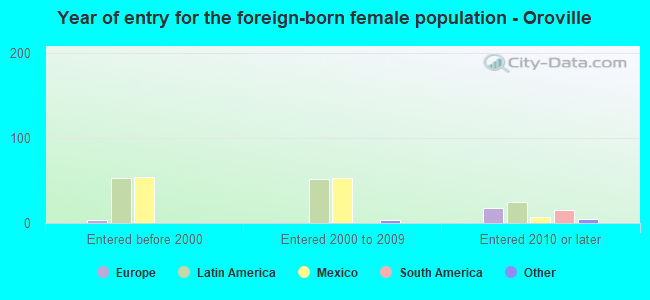
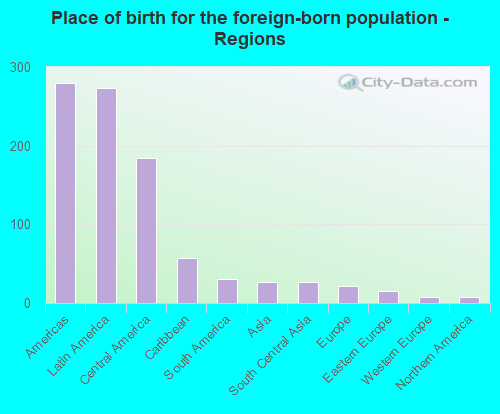
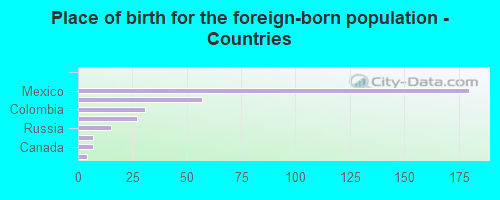
Foreign-born residents in Oroville 330 residents are foreign born (15.0% Latin America ).
This city:
18.6%Washington:
14.9%
Marital status for residents in Oroville Marital status - White (Caucasian) population 15 years and over
Males 23.2% Never married40.9% Now married0.5% Separated9.9% Widowed25.4% DivorcedFemales 15.9% Never married40.3% Now married4.0% Separated17.5% Widowed22.4% DivorcedWomen who gave birth in the past 12 months Now married:
71.4% (28)Unmarried:
28.6% (11)
Women who did not give birth in the past 12 months Now married:
62.4% (78)Unmarried:
37.6% (47)
Marital status - American Indian / Alaska Native population 15 years and over
Males 100.0% Never married0.0% Now married0.0% Separated0.0% Widowed0.0% DivorcedFemales 65.2% Never married34.8% Now married0.0% Separated0.0% Widowed0.0% DivorcedWomen who did not give birth in the past 12 months Now married:
0.0% (0)Unmarried:
100.0% (18)
Marital status - Other race population 15 years and over
Males 46.2% Never married53.8% Now married0.0% Separated0.0% Widowed0.0% DivorcedFemales 20.6% Never married55.9% Now married0.0% Separated7.8% Widowed15.7% DivorcedWomen who did not give birth in the past 12 months Now married:
32.8% (26)Unmarried:
67.2% (53)
Marital status - Two or more races population 15 years and over
Males 64.6% Never married35.4% Now married0.0% Separated0.0% Widowed0.0% DivorcedFemales 22.9% Never married50.5% Now married0.0% Separated25.7% Widowed0.9% DivorcedWomen who did not give birth in the past 12 months Now married:
18.2% (15)Unmarried:
81.8% (68)
Marital status - White alone, not Hispanic / Latino population 15 years and over
Males 23.5% Never married36.9% Now married0.5% Separated11.0% Widowed28.1% DivorcedFemales 16.5% Never married36.4% Now married4.4% Separated19.4% Widowed23.3% DivorcedWomen who gave birth in the past 12 months Now married:
47.8% (11)Unmarried:
52.2% (12)
Women who did not give birth in the past 12 months Now married:
63.6% (73)Unmarried:
36.4% (42)
Marital status - Hispanic or Latino population 15 years and over
Males 33.3% Never married66.7% Now married0.0% Separated0.0% Widowed0.0% DivorcedFemales 22.0% Never married60.1% Now married0.0% Separated4.8% Widowed13.1% DivorcedWomen who gave birth in the past 12 months Now married:
100.0% (20)Unmarried:
0.0% (0)
Women who did not give birth in the past 12 months Now married:
36.0% (38)Unmarried:
64.0% (67)
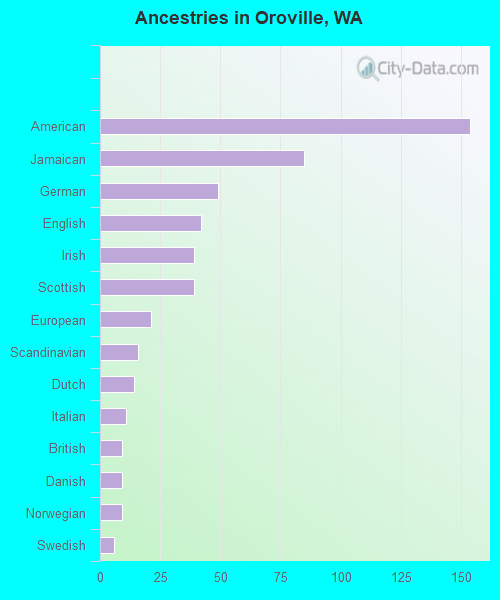
Ancestries in Oroville
154 15.7% American85 8.6% Jamaican49 5.0% German42 4.3% English39 4.0% Irish39 4.0% Scottish21 2.1% European16 1.6% Scandinavian14 1.4% Dutch11 1.1% Italian9 0.9% British9 0.9% Danish9 0.9% Norwegian6 0.6% Swedish
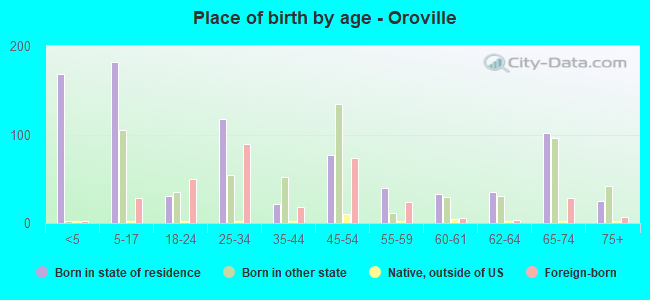
Children Nativity (place of birth) in Oroville
Children under 6 years - Living with two parents Both parents native 79 100.0% NativeBoth parents foreign-born 42 100.0% NativeOne native, one foreign-born parent 17 100.0% NativeChildren under 6 years - Living with one parent Native parent 56 100.0% NativeForeign-born parent 13 100.0% NativeChildren 6 to 17 years - Living with two parents Both parents native 87 100.0% NativeBoth parents foreign-born 28 87.1% Native4 12.9% Foreign-bornOne native, one foreign-born parent 14 100.0% Foreign-bornChildren 6 to 17 years - Living with one parent Native parent 56 100.0% NativeForeign-born parent 45 58.6% Native32 41.4% Foreign-born
Grandparents responsible for own grandchildren in Oroville
Grandparents (30 to 59 years) White / Caucasian 10 100.0% Responsible for grandchildrenOther race 9 100.0% Not responsible for grandchildrenTwo or more races 10 84.1% Responsible for grandchildren2 15.9% Not responsible for grandchildrenWhite alone, not Hispanic / Latino 10 100.0% Responsible for grandchildrenHispanic or Latino 8 100.0% Not responsible for grandchildren
Grandparents (60 years and over) White / Caucasian 36 100.0% Responsible for grandchildrenWhite alone, not Hispanic / Latino 37 100.0% Responsible for grandchildren