Races in Othello, Washington (WA) Detailed Stats
Data:
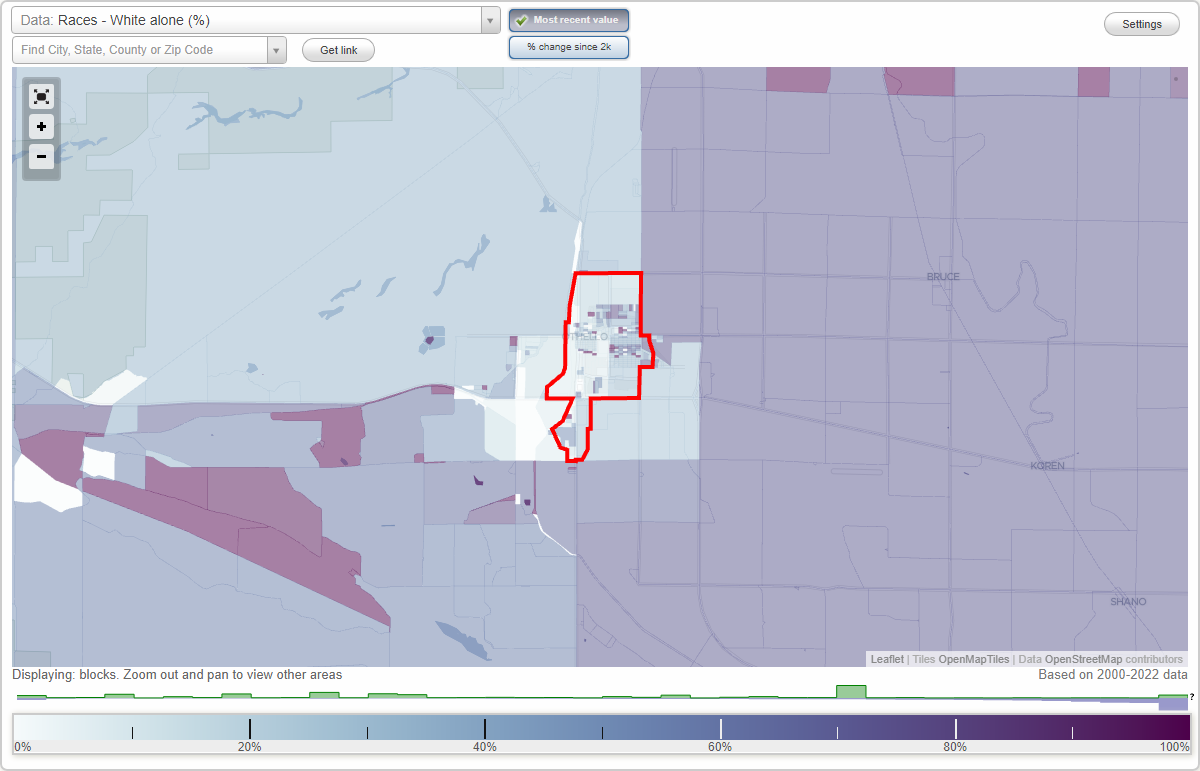
Races - White alone (%)
Races - White alone (% change since 2000)
Races - Black alone (%)
Races - Black alone (% change since 2000)
Races - American Indian alone (%)
Races - American Indian alone (% change since 2000)
Races - Asian alone (%)
Races - Asian alone (% change since 2000)
Races - Hispanic (%)
Races - Hispanic (% change since 2000)
Races - Native Hawaiian and Other Pacific Islander alone (%)
Races - Native Hawaiian and Other Pacific Islander alone (% change since 2000)
Races - Two or more races(%)
Races - Two or more races(% change since 2000)
Races - Other race alone (%)
Races - Other race alone (% change since 2000)
Racial diversity
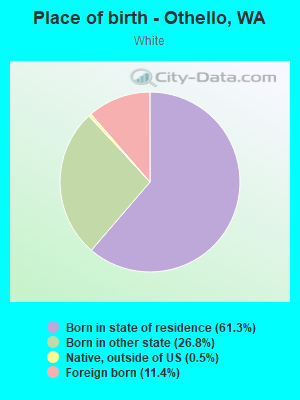
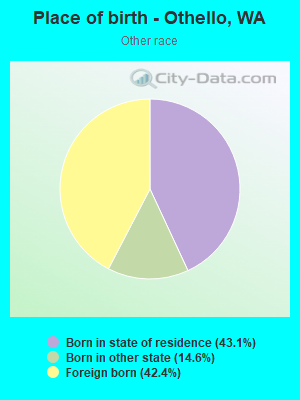
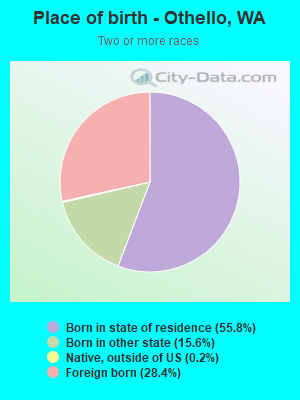
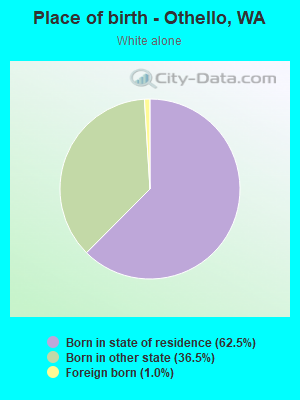
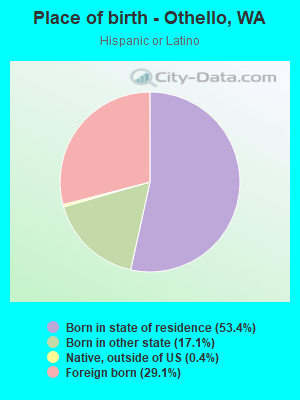
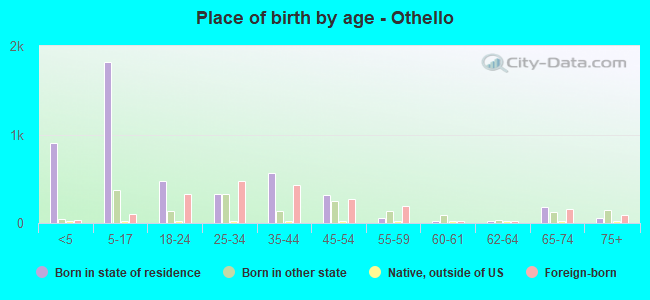
Place of birth - Born in state of residence (%)
Place of birth - Born in state of residence (%) - White
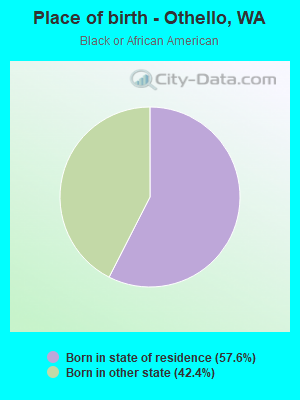
Place of birth - Born in state of residence (%) - Black or African American
Place of birth - Born in state of residence (%) - Asian
Place of birth - Born in state of residence (%) - Hispanic or Latino
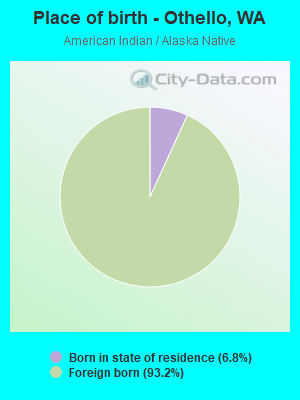
Place of birth - Born in state of residence (%) - American Indian and Alaska Native
Place of birth - Born in state of residence (%) - Multirace
Place of birth - Born in state of residence (%) - Other Race
Place of birth - Born in other state (%)
Place of birth - Born in other state (%) - White
Place of birth - Born in other state (%) - Black or African American
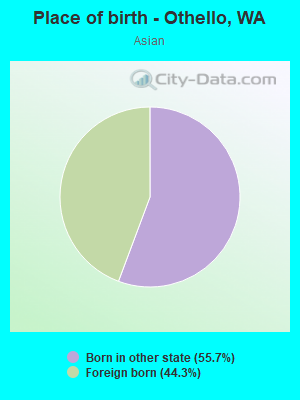
Place of birth - Born in other state (%) - Asian
Place of birth - Born in other state (%) - Hispanic or Latino
Place of birth - Born in other state (%) - American Indian and Alaska Native
Place of birth - Born in other state (%) - Multirace
Place of birth - Born in other state (%) - Other Race
Place of birth - Native, outside of US (%)
Place of birth - Native, outside of US (%) - White
Place of birth - Native, outside of US (%) - Black or African American
Place of birth - Native, outside of US (%) - Asian
Place of birth - Native, outside of US (%) - Hispanic or Latino
Place of birth - Native, outside of US (%) - American Indian and Alaska Native
Place of birth - Native, outside of US (%) - Multirace
Place of birth - Native, outside of US (%) - Other Race
Place of birth - Foreign born (%)
Place of birth - Foreign born (%) - White
Place of birth - Foreign born (%) - Black or African American
Place of birth - Foreign born (%) - Asian
Place of birth - Foreign born (%) - Hispanic or Latino
Place of birth - Foreign born (%) - American Indian and Alaska Native
Place of birth - Foreign born (%) - Multirace
Place of birth - Foreign born (%) - Other Race
Residents speaking English at home (%)
Residents speaking English at home - Born in the United States (%)
Residents speaking English at home - Native, born elsewhere (%)
Residents speaking English at home - Foreign born (%)
Residents speaking Spanish at home (%)
Residents speaking Spanish at home - Born in the United States (%)
Residents speaking Spanish at home - Native, born elsewhere (%)
Residents speaking Spanish at home - Foreign born (%)
Residents speaking other language at home (%)
Residents speaking other language at home - Born in the United States (%)
Residents speaking other language at home - Native, born elsewhere (%)
Residents speaking other language at home - Foreign born (%)
Marital status - Never married (%)
Marital status - Now married (%)
Marital status - Separated (%)
Marital status - Widowed (%)
Marital status - Divorced (%)
Ancestries Reported - Arab (%)
Ancestries Reported - Czech (%)
Ancestries Reported - Danish (%)
Ancestries Reported - Dutch (%)
Ancestries Reported - English (%)
Ancestries Reported - French (%)
Ancestries Reported - French Canadian (%)
Ancestries Reported - German (%)
Ancestries Reported - Greek (%)
Ancestries Reported - Hungarian (%)
Ancestries Reported - Irish (%)
Ancestries Reported - Italian (%)
Ancestries Reported - Lithuanian (%)
Ancestries Reported - Norwegian (%)
Ancestries Reported - Polish (%)
Ancestries Reported - Portuguese (%)
Ancestries Reported - Russian (%)
Ancestries Reported - Scotch-Irish (%)
Ancestries Reported - Scottish (%)
Ancestries Reported - Slovak (%)
Ancestries Reported - Subsaharan African (%)
Ancestries Reported - Swedish (%)
Ancestries Reported - Swiss (%)
Ancestries Reported - Ukrainian (%)
Ancestries Reported - United States (%)
Ancestries Reported - Welsh (%)
Ancestries Reported - West Indian (%)
Ancestries Reported - Other (%)
Geographical mobility - Same house 1 year ago (%)
Geographical mobility - Same house 1 year ago (%) - White
Geographical mobility - Same house 1 year ago (%) - Black or African American
Geographical mobility - Same house 1 year ago (%) - Asian
Geographical mobility - Same house 1 year ago (%) - Hispanic or Latino
Geographical mobility - Same house 1 year ago (%) - American Indian and Alaska Native
Geographical mobility - Same house 1 year ago (%) - Multirace
Geographical mobility - Same house 1 year ago (%) - Other Race
Geographical mobility - Moved within same county (%)
Geographical mobility - Moved within same county (%) - White
Geographical mobility - Moved within same county (%) - Black or African American
Geographical mobility - Moved within same county (%) - Asian
Geographical mobility - Moved within same county (%) - Hispanic or Latino
Geographical mobility - Moved within same county (%) - American Indian and Alaska Native
Geographical mobility - Moved within same county (%) - Multirace
Geographical mobility - Moved within same county (%) - Other Race
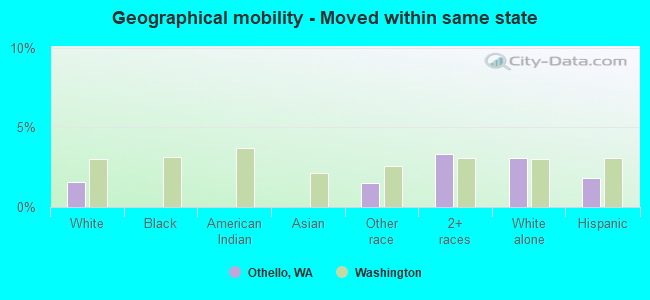
Geographical mobility - Moved from different county within same state (%)
Geographical mobility - Moved from different county within same state (%) - White
Geographical mobility - Moved from different county within same state (%) - Black or African American
Geographical mobility - Moved from different county within same state (%) - Asian
Geographical mobility - Moved from different county within same state (%) - Hispanic or Latino
Geographical mobility - Moved from different county within same state (%) - American Indian and Alaska Native
Geographical mobility - Moved from different county within same state (%) - Multirace
Geographical mobility - Moved from different county within same state (%) - Other Race
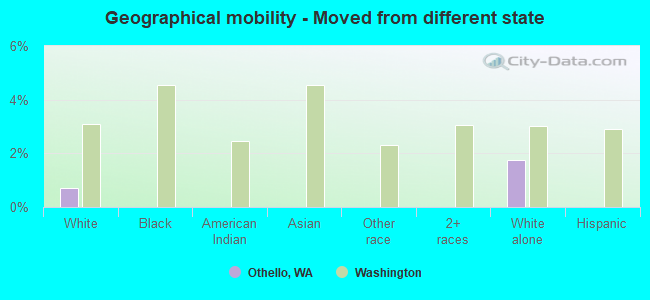
Geographical mobility - Moved from different state (%)
Geographical mobility - Moved from different state (%) - White
Geographical mobility - Moved from different state (%) - Black or African American
Geographical mobility - Moved from different state (%) - Asian
Geographical mobility - Moved from different state (%) - Hispanic or Latino
Geographical mobility - Moved from different state (%) - American Indian and Alaska Native
Geographical mobility - Moved from different state (%) - Multirace
Geographical mobility - Moved from different state (%) - Other Race
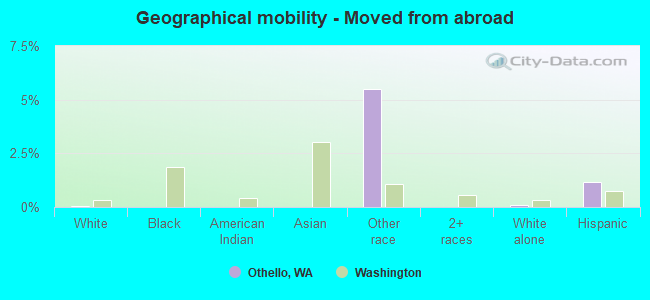
Geographical mobility - Moved from abroad (%)
Geographical mobility - Moved from abroad (%) - White
Geographical mobility - Moved from abroad (%) - Black or African American
Geographical mobility - Moved from abroad (%) - Asian
Geographical mobility - Moved from abroad (%) - Hispanic or Latino
Geographical mobility - Moved from abroad (%) - American Indian and Alaska Native
Geographical mobility - Moved from abroad (%) - Multirace
Geographical mobility - Moved from abroad (%) - Other Race
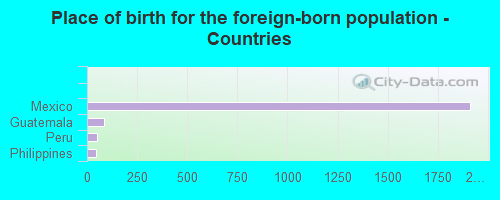
Place of birth for the foreign-born population - Ireland (%)
Place of birth for the foreign-born population - Denmark (%)
Place of birth for the foreign-born population - Norway (%)
Place of birth for the foreign-born population - Sweden (%)
Place of birth for the foreign-born population - United Kingdom (%)
Place of birth for the foreign-born population - England (%)
Place of birth for the foreign-born population - Scotland (%)
Place of birth for the foreign-born population - Other Northern Europe (%)
Place of birth for the foreign-born population - Austria (%)
Place of birth for the foreign-born population - Belgium (%)
Place of birth for the foreign-born population - France (%)
Place of birth for the foreign-born population - Germany (%)
Place of birth for the foreign-born population - Netherlands (%)
Place of birth for the foreign-born population - Switzerland (%)
Place of birth for the foreign-born population - Other Western Europe (%)
Place of birth for the foreign-born population - Greece (%)
Place of birth for the foreign-born population - Italy (%)
Place of birth for the foreign-born population - Portugal (%)
Place of birth for the foreign-born population - Spain (%)
Place of birth for the foreign-born population - Other Southern Europe (%)
Place of birth for the foreign-born population - Albania (%)
Place of birth for the foreign-born population - Belarus (%)
Place of birth for the foreign-born population - Bosnia and Herzegovina (%)
Place of birth for the foreign-born population - Bulgaria (%)
Place of birth for the foreign-born population - Croatia (%)
Place of birth for the foreign-born population - Czechoslovakia (%)
Place of birth for the foreign-born population - Hungary (%)
Place of birth for the foreign-born population - Latvia (%)
Place of birth for the foreign-born population - Lithuania (%)
Place of birth for the foreign-born population - North Macedonia (Macedonia) (%)
Place of birth for the foreign-born population - Moldova (%)
Place of birth for the foreign-born population - Poland (%)
Place of birth for the foreign-born population - Romania (%)
Place of birth for the foreign-born population - Russia (%)
Place of birth for the foreign-born population - Serbia (%)
Place of birth for the foreign-born population - Ukraine (%)
Place of birth for the foreign-born population - Other Eastern Europe (%)
Place of birth for the foreign-born population - China (%)
Place of birth for the foreign-born population - Hong Kong (%)
Place of birth for the foreign-born population - Taiwan (%)
Place of birth for the foreign-born population - Japan (%)
Place of birth for the foreign-born population - Korea (%)
Place of birth for the foreign-born population - Other Eastern Asia (%)
Place of birth for the foreign-born population - Afghanistan (%)
Place of birth for the foreign-born population - Bangladesh (%)
Place of birth for the foreign-born population - India (%)
Place of birth for the foreign-born population - Iran (%)
Place of birth for the foreign-born population - Kazakhstan (%)
Place of birth for the foreign-born population - Nepal (%)
Place of birth for the foreign-born population - Pakistan (%)
Place of birth for the foreign-born population - Sri Lanka (%)
Place of birth for the foreign-born population - Uzbekistan (%)
Place of birth for the foreign-born population - Other South Central Asia (%)
Place of birth for the foreign-born population - Burma (%)
Place of birth for the foreign-born population - Cambodia (%)
Place of birth for the foreign-born population - Indonesia (%)
Place of birth for the foreign-born population - Laos (%)
Place of birth for the foreign-born population - Malaysia (%)
Place of birth for the foreign-born population - Philippines (%)
Place of birth for the foreign-born population - Singapore (%)
Place of birth for the foreign-born population - Thailand (%)
Place of birth for the foreign-born population - Vietnam (%)
Place of birth for the foreign-born population - Other South Eastern Asia (%)
Place of birth for the foreign-born population - Armenia (%)
Place of birth for the foreign-born population - Iraq (%)
Place of birth for the foreign-born population - Israel (%)
Place of birth for the foreign-born population - Jordan (%)
Place of birth for the foreign-born population - Kuwait (%)
Place of birth for the foreign-born population - Lebanon (%)
Place of birth for the foreign-born population - Saudi Arabia (%)
Place of birth for the foreign-born population - Syria (%)
Place of birth for the foreign-born population - Turkey (%)
Place of birth for the foreign-born population - Yemen (%)
Place of birth for the foreign-born population - Other Western Asia (%)
Place of birth for the foreign-born population - Eritrea (%)
Place of birth for the foreign-born population - Ethiopia (%)
Place of birth for the foreign-born population - Kenya (%)
Place of birth for the foreign-born population - Somalia (%)
Place of birth for the foreign-born population - Uganda (%)
Place of birth for the foreign-born population - Zimbabwe (%)
Place of birth for the foreign-born population - Other Eastern Africa (%)
Place of birth for the foreign-born population - Cameroon (%)
Place of birth for the foreign-born population - Congo (%)
Place of birth for the foreign-born population - Democratic Republic of Congo (Zaire) (%)
Place of birth for the foreign-born population - Other Middle Africa (%)
Place of birth for the foreign-born population - Egypt (%)
Place of birth for the foreign-born population - Morocco (%)
Place of birth for the foreign-born population - Sudan (%)
Place of birth for the foreign-born population - Other Northern Africa (%)
Place of birth for the foreign-born population - South Africa (%)
Place of birth for the foreign-born population - Other Southern Africa (%)
Place of birth for the foreign-born population - Cabo Verde (%)
Place of birth for the foreign-born population - Ghana (%)
Place of birth for the foreign-born population - Liberia (%)
Place of birth for the foreign-born population - Nigeria (%)
Place of birth for the foreign-born population - Senegal (%)
Place of birth for the foreign-born population - Sierra Leone (%)
Place of birth for the foreign-born population - Other Western Africa (%)
Place of birth for the foreign-born population - Australia (%)
Place of birth for the foreign-born population - New Zealand (%)
Place of birth for the foreign-born population - Fiji (%)
Place of birth for the foreign-born population - Micronesia (%)
Place of birth for the foreign-born population - Bahamas (%)
Place of birth for the foreign-born population - Barbados (%)
Place of birth for the foreign-born population - Cuba (%)
Place of birth for the foreign-born population - Dominica (%)
Place of birth for the foreign-born population - Dominican Republic (%)
Place of birth for the foreign-born population - Grenada (%)
Place of birth for the foreign-born population - Haiti (%)
Place of birth for the foreign-born population - Jamaica (%)
Place of birth for the foreign-born population - St. Vincent and the Grenadines (%)
Place of birth for the foreign-born population - Trinidad and Tobago (%)
Place of birth for the foreign-born population - West Indies (%)
Place of birth for the foreign-born population - Other Caribbean (%)
Place of birth for the foreign-born population - Belize (%)
Place of birth for the foreign-born population - Costa Rica (%)
Place of birth for the foreign-born population - El Salvador (%)
Place of birth for the foreign-born population - Guatemala (%)
Place of birth for the foreign-born population - Honduras (%)
Place of birth for the foreign-born population - Mexico (%)
Place of birth for the foreign-born population - Nicaragua (%)
Place of birth for the foreign-born population - Panama (%)
Place of birth for the foreign-born population - Other Central America (%)
Place of birth for the foreign-born population - Argentina (%)
Place of birth for the foreign-born population - Bolivia (%)
Place of birth for the foreign-born population - Brazil (%)
Place of birth for the foreign-born population - Chile (%)
Place of birth for the foreign-born population - Colombia (%)
Place of birth for the foreign-born population - Ecuador (%)
Place of birth for the foreign-born population - Guyana (%)
Place of birth for the foreign-born population - Peru (%)
Place of birth for the foreign-born population - Uruguay (%)
Place of birth for the foreign-born population - Venezuela (%)
Place of birth for the foreign-born population - Other South America (%)
Place of birth for the foreign-born population - Canada (%)
Place of birth for the foreign-born population - Other Northern America (%)
Place of birth for the foreign-born population - Other (%)
Latest news about races in Othello, WA collected exclusively by city-data.com from local newspapers, TV, and radio stations
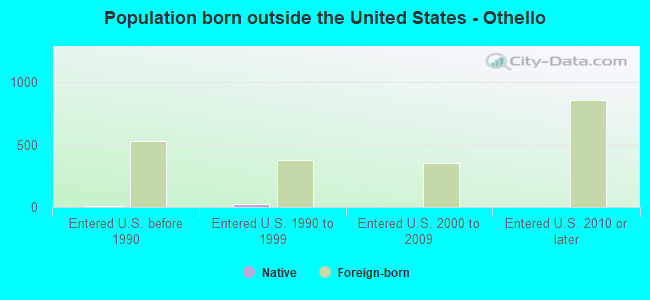
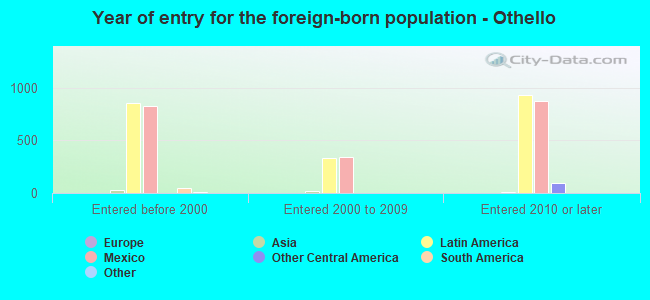
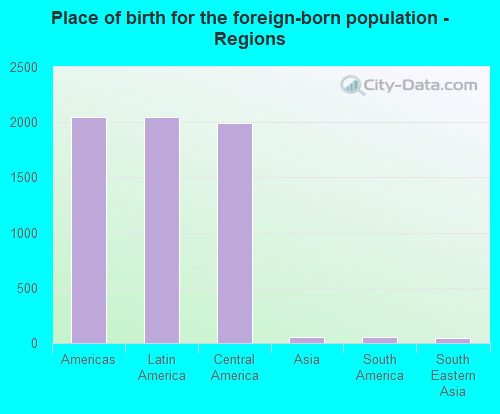
According to 2022 data, the most numerous races in Othello, WA are White alone (1,711 residents), Hispanic (6,959 residents), and Asian alone (104 residents). 42.9% of Othello residents speak English at home. 24.3% of Othello, WA residents are foreign-born (22.9% born in Latin America), which is 38.2% greater than the foreign-born rate of 15.0% across the entire state of Washington.
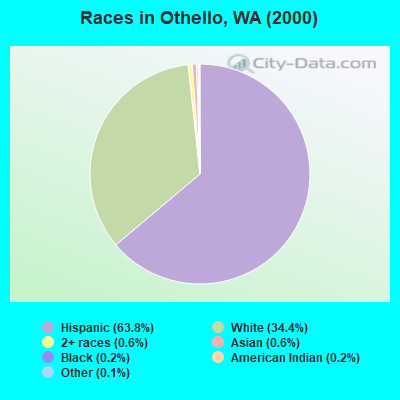
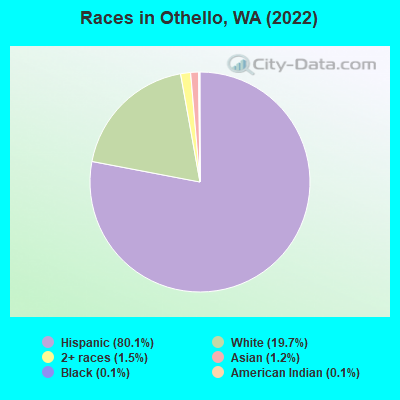
Race distribution in Othello
2000 2022
4,652,490 78.9% White alone 441,509 7.5% Hispanic 319,401 5.4% Asian alone 184,631 3.1% Black alone 175,926 3.0% Two or more races 85,396 1.4% American Indian alone 22,779 0.4% Native Hawaiian and Other 11,989 0.2% Other race alone
4,941,456 63.5% White alone 1,093,313 14.0% Hispanic 755,832 9.7% Asian alone 523,448 6.7% Two or more races 299,537 3.8% Black alone 69,024 0.9% American Indian alone 52,231 0.7% Native Hawaiian and Other 50,945 0.7% Other race alone
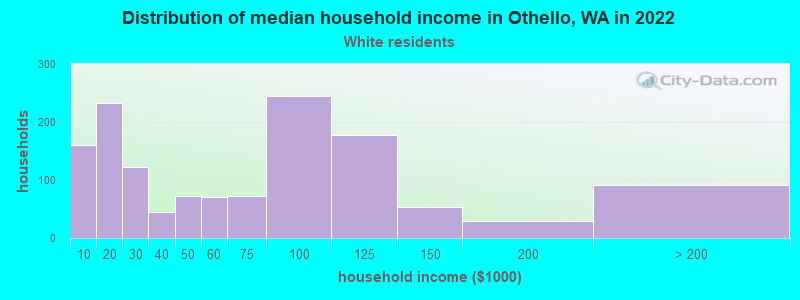
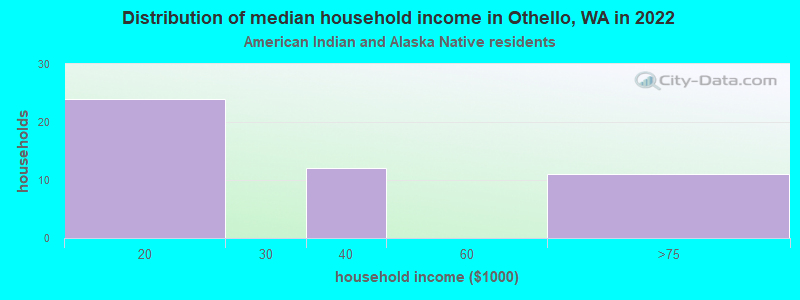
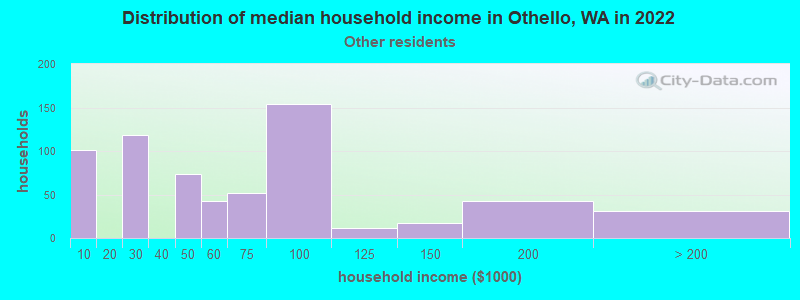
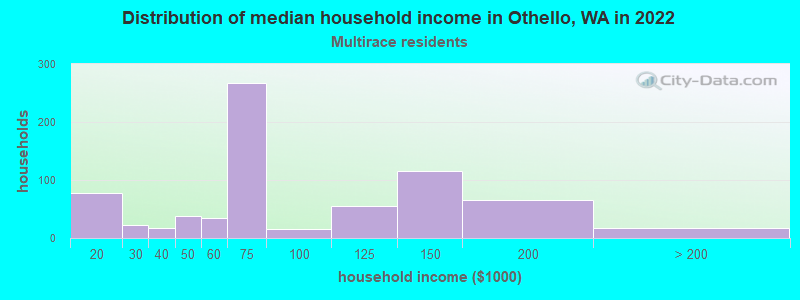
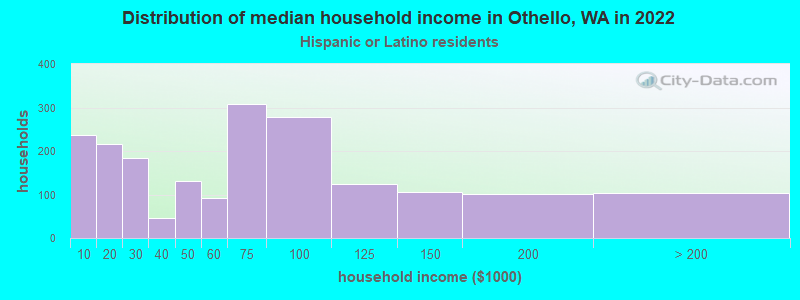
Income and house value in Othello Median household income in 2022 $82,216 White non-Hispanic householders$61,786 Some other race householders$72,351 Two or more races householders$66,795 Hispanic or Latino race householdersMedian 2022 house value $297,299 White Non-Hispanic householders$33,589 Black or African American householders $280,839 Asian householders$266,729 Some other race householders$288,565 Two or more races householders$278,487 Hispanic or Latino householders
Median age by race in Othello
26.5 Median age for White residents25.2 27.5 -694,779,115.8 Median age for Black or African American residents-684,418,145.3 -711,934,155.7 24.9 Median age for American Indian / Alaska Native residents24.3 53.6 34.0 Median age for Asian residents16.1 -673,647,468.8 -681,388,011.9 Median age for Native Hawaiian / Pacific Islander residents-696,774,192.9 -666,666,666.0 31.0 Median age for Other race residents30.7 31.7 23.1 Median age for Two or more races residents24.6 22.8 40.2 Median age for White alone residents32.8 45.8 22.7 Median age for Hispanic or Latino residents23.4 22.7
Owner/renter occupied households by race in Othello
House owners and renters - White residents 664 49.6% Owner occupied675 50.4% Renter occupiedHouse owners and renters - American Indian / Alaska Native residents 12 23.0% Owner occupied40 77.0% Renter occupiedHouse owners and renters - Asian residents 17 100.0% Owner occupiedHouse owners and renters - Other race residents 306 46.0% Owner occupied360 54.0% Renter occupiedHouse owners and renters - Two or more races residents 540 72.4% Owner occupied205 27.6% Renter occupiedHouse owners and renters - White alone residents 360 52.5% Owner occupied326 47.5% Renter occupiedHouse owners and renters - Hispanic or Latino residents 1,036 53.3% Owner occupied908 46.7% Renter occupied
Language usage in Othello
English speakers - Total 42.9% of residents of Othello speak English at home.
56.1% of residents speak Spanish at home 2,586 60.0% Speak English very well1,723 40.0% Speak English less than very well1.4% of residents speak other language at home 63 58.3% Speak English very well45 41.7% Speak English less than very well
English speakers - Born in the United States 56.5% of residents of Othello speak English at home.
46.2% of residents speak Spanish at home 746 91.2% Speak English very well72 8.8% Speak English less than very well0.3% of residents speak other language at home 6 100.0% Speak English less than very well
English speakers - Native, born elsewhere 0.0% of residents of Othello speak English at home.
100.0% of residents speak Spanish at home 5 17.9% Speak English very well23 82.1% Speak English less than very well
English speakers - Foreign-born 2.8% of residents of Othello speak English at home.
91.6% of residents speak Spanish at home 564 29.7% Speak English very well1,334 70.3% Speak English less than very well4.1% of residents speak other language at home 47 54.7% Speak English very well39 45.3% Speak English less than very well
White (Caucasian) - Speak only English Native:
66.7% (2,171)Foreign-born:
1.3% (6)
White (Caucasian) - Speak another language Native:
27.3% (890)Foreign-born:
94.7% (453)
Other race - Speak only English Native:
35.1% (354)Foreign-born:
5.8% (47)
Other race - Speak another language Native:
63.9% (646)Foreign-born:
94.2% (772)
Two or more races - Speak only English Native:
48.6% (776)Foreign-born:
1.3% (10)
Two or more races - Speak another language Native:
59.6% (952)Foreign-born:
100.0% (784)
White alone - Speak only English Native:
97.0% (1,555)Foreign-born:
38.6% (6)
White alone - Speak another language Native:
3.0% (49)Foreign-born:
61.2% (10)
Hispanic or Latino - Speak only English Native:
39.9% (1,616)Foreign-born:
2.5% (50)
Hispanic or Latino - Speak another language Native:
59.0% (2,387)Foreign-born:
97.6% (1,931)
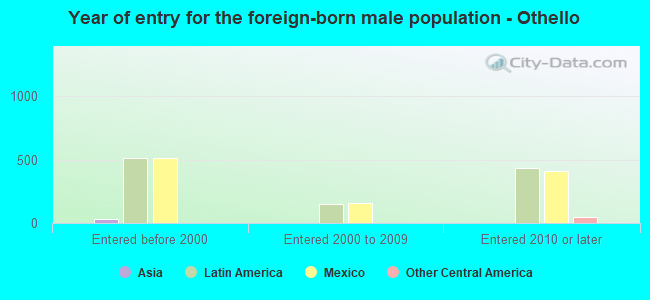
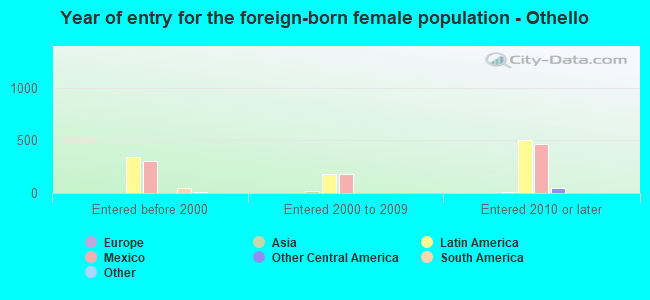
Foreign-born residents in Othello 2,108 residents are foreign born (22.9% Latin America ).
This city:
24.3%Washington:
14.9%
Marital status for residents in Othello Marital status - White (Caucasian) population 15 years and over
Males 40.3% Never married42.6% Now married2.9% Separated2.8% Widowed11.4% DivorcedFemales 20.4% Never married45.4% Now married2.6% Separated11.3% Widowed20.3% DivorcedWomen who gave birth in the past 12 months Now married:
89.4% (72)Unmarried:
10.6% (9)
Women who did not give birth in the past 12 months Now married:
52.7% (394)Unmarried:
47.3% (354)
Marital status - American Indian / Alaska Native population 15 years and over
Males 76.0% Never married24.0% Now married0.0% Separated0.0% Widowed0.0% DivorcedFemales 50.0% Never married13.2% Now married36.8% Separated0.0% Widowed0.0% DivorcedWomen who did not give birth in the past 12 months Now married:
27.0% (12)Unmarried:
73.0% (32)
Marital status - Asian population 15 years and over
Males 38.3% Never married0.0% Now married0.0% Separated0.0% Widowed61.7% DivorcedFemales 0.0% Never married46.9% Now married0.0% Separated0.0% Widowed53.1% DivorcedWomen who gave birth in the past 12 months Now married:
0.0% (0)Unmarried:
100.0% (19)
Women who did not give birth in the past 12 months Now married:
100.0% (16)Unmarried:
0.0% (0)
Marital status - Other race population 15 years and over
Males 30.6% Never married67.9% Now married0.0% Separated0.0% Widowed1.5% DivorcedFemales 27.4% Never married65.1% Now married7.4% Separated0.0% Widowed0.0% DivorcedWomen who did not give birth in the past 12 months Now married:
62.6% (364)Unmarried:
37.4% (217)
Marital status - Two or more races population 15 years and over
Males 61.2% Never married32.7% Now married1.3% Separated0.0% Widowed4.8% DivorcedFemales 46.6% Never married40.1% Now married3.6% Separated1.1% Widowed8.7% DivorcedWomen who gave birth in the past 12 months Now married:
0.0% (0)Unmarried:
100.0% (38)
Women who did not give birth in the past 12 months Now married:
38.4% (291)Unmarried:
61.6% (467)
Marital status - White alone, not Hispanic / Latino population 15 years and over
Males 44.5% Never married41.3% Now married1.3% Separated5.2% Widowed7.7% DivorcedFemales 18.8% Never married36.7% Now married2.9% Separated10.2% Widowed31.5% DivorcedWomen who gave birth in the past 12 months Now married:
52.6% (10)Unmarried:
47.4% (9)
Women who did not give birth in the past 12 months Now married:
50.4% (188)Unmarried:
49.6% (185)
Marital status - Hispanic or Latino population 15 years and over
Males 43.7% Never married46.9% Now married1.9% Separated0.3% Widowed7.1% DivorcedFemales 32.9% Never married52.5% Now married5.7% Separated4.3% Widowed4.5% DivorcedWomen who gave birth in the past 12 months Now married:
68.8% (70)Unmarried:
31.3% (32)
Women who did not give birth in the past 12 months Now married:
50.6% (808)Unmarried:
49.4% (788)
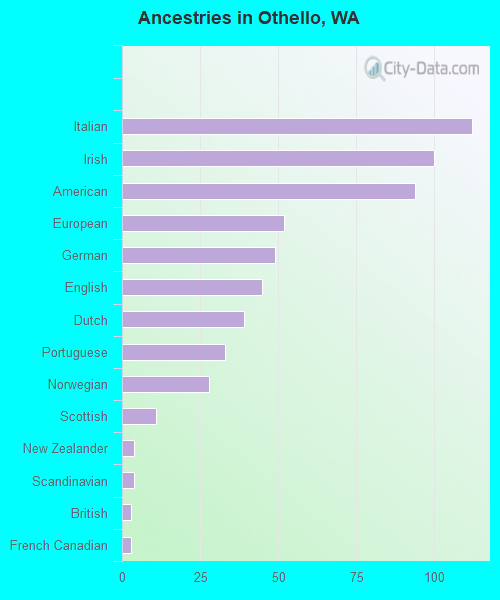
Ancestries in Othello
112 1.9% Italian100 1.7% Irish94 1.6% American52 0.9% European49 0.8% German45 0.7% English39 0.6% Dutch33 0.5% Portuguese28 0.5% Norwegian11 0.2% Scottish4 0.07% New Zealander4 0.07% Scandinavian3 0.05% British3 0.05% French Canadian
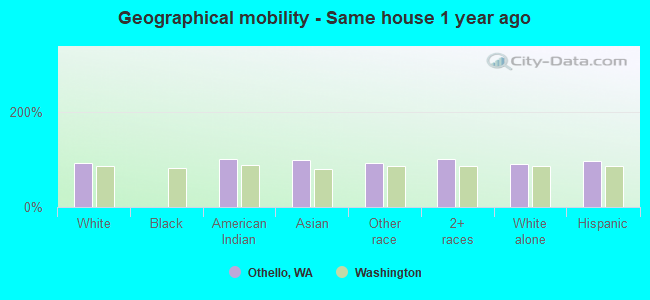
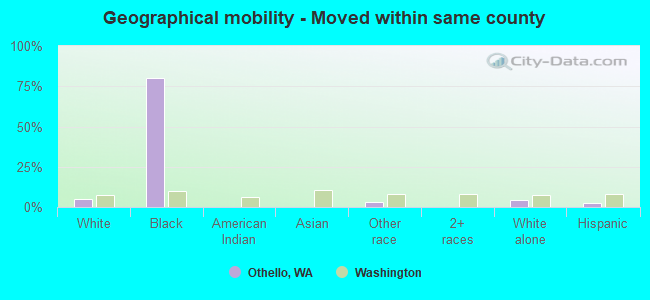
Geographical mobility in Othello Same house 1 year ago 3,903 93.3% White (Caucasian)142 100.0% American Indian / Alaska Native103 98.4% Asian1,877 92.6% Other race2,641 99.8% Two or more races1,559 91.3% White alone, not Hispanic / Latino6,618 96.8% Hispanic or LatinoMoved within same county 202 4.8% White / Caucasian9 80.1% Black or African American64 3.1% Other race72 4.2% White alone, not Hispanic / Latino186 2.7% Hispanic or LatinoMoved within same state 65 1.6% White / Caucasian31 1.5% Other race87 3.3% Two or more races53 3.1% White alone, not Hispanic / Latino122 1.8% Hispanic or LatinoMoved from different state 29 0.7% White / Caucasian30 1.8% White alone, not Hispanic / LatinoMoved from abroad 2 0.0% White111 5.5% Other race2 0.1% White alone, not Hispanic / Latino79 1.2% Hispanic or Latino
Children Nativity (place of birth) in Othello
Children under 6 years - Living with two parents Both parents native 284 100.0% NativeBoth parents foreign-born 165 100.0% NativeOne native, one foreign-born parent 180 100.0% NativeChildren under 6 years - Living with one parent Native parent 134 100.0% NativeForeign-born parent 242 83.6% Native47 16.4% Foreign-bornChildren 6 to 17 years - Living with two parents Both parents native 478 100.0% NativeBoth parents foreign-born 111 52.5% Native100 47.5% Foreign-bornOne native, one foreign-born parent 457 100.0% NativeChildren 6 to 17 years - Living with one parent Native parent 659 100.0% NativeForeign-born parent 381 50.6% Native371 49.4% Foreign-born
Grandparents responsible for own grandchildren in Othello
Grandparents (30 to 59 years) White / Caucasian 11 100.0% Not responsible for grandchildrenWhite alone, not Hispanic / Latino 13 100.0% Not responsible for grandchildrenGrandparents (60 years and over) White / Caucasian 19 94.8% Responsible for grandchildren1 5.2% Not responsible for grandchildrenWhite alone, not Hispanic / Latino 19 100.0% Responsible for grandchildren