Races in Owosso, Michigan (MI) Detailed Stats
Data:
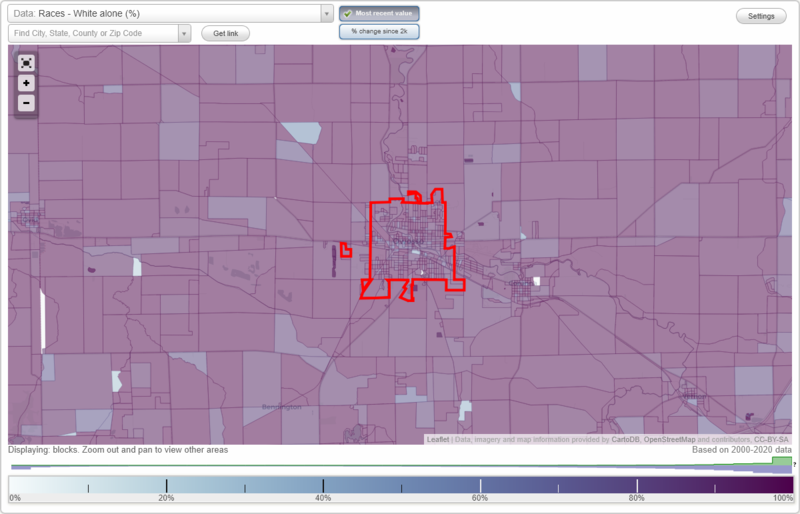
Races - White alone (%)
Races - White alone (% change since 2000)
Races - Black alone (%)
Races - Black alone (% change since 2000)
Races - American Indian alone (%)
Races - American Indian alone (% change since 2000)
Races - Asian alone (%)
Races - Asian alone (% change since 2000)
Races - Hispanic (%)
Races - Hispanic (% change since 2000)
Races - Native Hawaiian and Other Pacific Islander alone (%)
Races - Native Hawaiian and Other Pacific Islander alone (% change since 2000)
Races - Two or more races(%)
Races - Two or more races(% change since 2000)
Races - Other race alone (%)
Races - Other race alone (% change since 2000)
Racial diversity
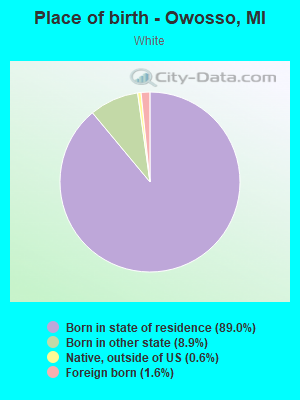
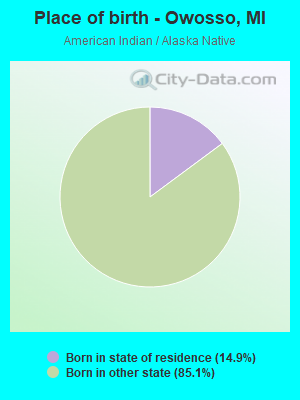
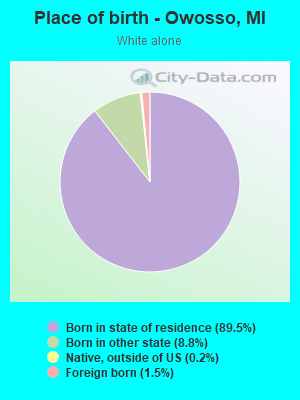
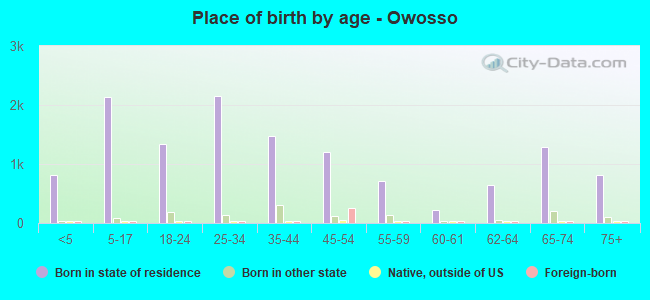
Place of birth - Born in state of residence (%)
Place of birth - Born in state of residence (%) - White
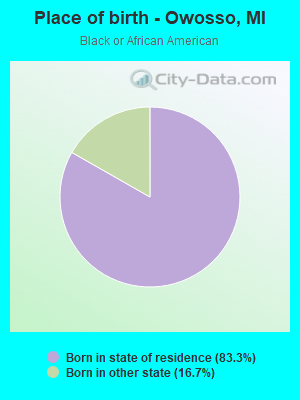
Place of birth - Born in state of residence (%) - Black or African American
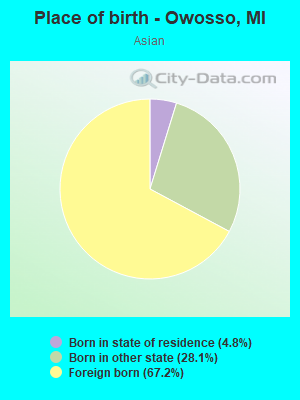
Place of birth - Born in state of residence (%) - Asian
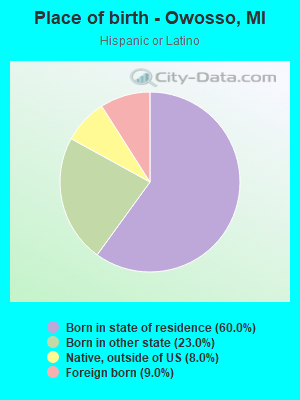
Place of birth - Born in state of residence (%) - Hispanic or Latino
Place of birth - Born in state of residence (%) - American Indian and Alaska Native
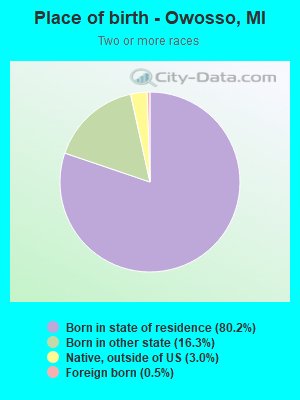
Place of birth - Born in state of residence (%) - Multirace
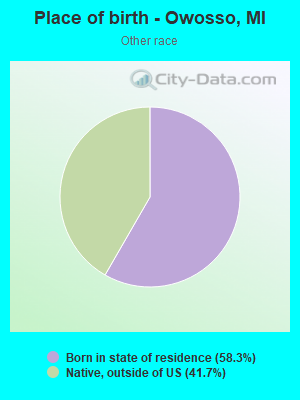
Place of birth - Born in state of residence (%) - Other Race
Place of birth - Born in other state (%)
Place of birth - Born in other state (%) - White
Place of birth - Born in other state (%) - Black or African American
Place of birth - Born in other state (%) - Asian
Place of birth - Born in other state (%) - Hispanic or Latino
Place of birth - Born in other state (%) - American Indian and Alaska Native
Place of birth - Born in other state (%) - Multirace
Place of birth - Born in other state (%) - Other Race
Place of birth - Native, outside of US (%)
Place of birth - Native, outside of US (%) - White
Place of birth - Native, outside of US (%) - Black or African American
Place of birth - Native, outside of US (%) - Asian
Place of birth - Native, outside of US (%) - Hispanic or Latino
Place of birth - Native, outside of US (%) - American Indian and Alaska Native
Place of birth - Native, outside of US (%) - Multirace
Place of birth - Native, outside of US (%) - Other Race
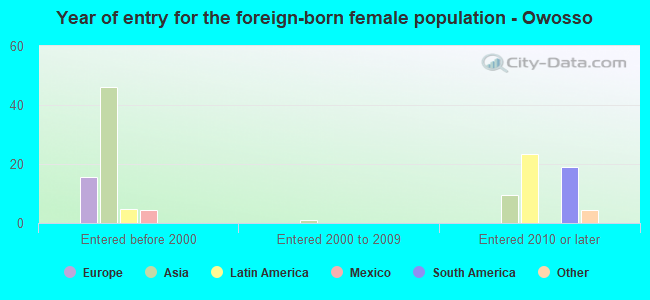
Place of birth - Foreign born (%)
Place of birth - Foreign born (%) - White
Place of birth - Foreign born (%) - Black or African American
Place of birth - Foreign born (%) - Asian
Place of birth - Foreign born (%) - Hispanic or Latino
Place of birth - Foreign born (%) - American Indian and Alaska Native
Place of birth - Foreign born (%) - Multirace
Place of birth - Foreign born (%) - Other Race
Residents speaking English at home (%)
Residents speaking English at home - Born in the United States (%)
Residents speaking English at home - Native, born elsewhere (%)
Residents speaking English at home - Foreign born (%)
Residents speaking Spanish at home (%)
Residents speaking Spanish at home - Born in the United States (%)
Residents speaking Spanish at home - Native, born elsewhere (%)
Residents speaking Spanish at home - Foreign born (%)
Residents speaking other language at home (%)
Residents speaking other language at home - Born in the United States (%)
Residents speaking other language at home - Native, born elsewhere (%)
Residents speaking other language at home - Foreign born (%)
Marital status - Never married (%)
Marital status - Now married (%)
Marital status - Separated (%)
Marital status - Widowed (%)
Marital status - Divorced (%)
Ancestries Reported - Arab (%)
Ancestries Reported - Czech (%)
Ancestries Reported - Danish (%)
Ancestries Reported - Dutch (%)
Ancestries Reported - English (%)
Ancestries Reported - French (%)
Ancestries Reported - French Canadian (%)
Ancestries Reported - German (%)
Ancestries Reported - Greek (%)
Ancestries Reported - Hungarian (%)
Ancestries Reported - Irish (%)
Ancestries Reported - Italian (%)
Ancestries Reported - Lithuanian (%)
Ancestries Reported - Norwegian (%)
Ancestries Reported - Polish (%)
Ancestries Reported - Portuguese (%)
Ancestries Reported - Russian (%)
Ancestries Reported - Scotch-Irish (%)
Ancestries Reported - Scottish (%)
Ancestries Reported - Slovak (%)
Ancestries Reported - Subsaharan African (%)
Ancestries Reported - Swedish (%)
Ancestries Reported - Swiss (%)
Ancestries Reported - Ukrainian (%)
Ancestries Reported - United States (%)
Ancestries Reported - Welsh (%)
Ancestries Reported - West Indian (%)
Ancestries Reported - Other (%)
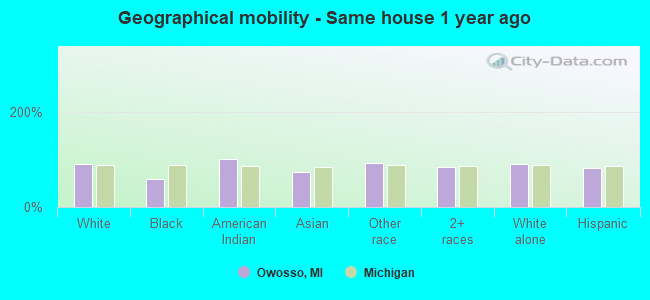
Geographical mobility - Same house 1 year ago (%)
Geographical mobility - Same house 1 year ago (%) - White
Geographical mobility - Same house 1 year ago (%) - Black or African American
Geographical mobility - Same house 1 year ago (%) - Asian
Geographical mobility - Same house 1 year ago (%) - Hispanic or Latino
Geographical mobility - Same house 1 year ago (%) - American Indian and Alaska Native
Geographical mobility - Same house 1 year ago (%) - Multirace
Geographical mobility - Same house 1 year ago (%) - Other Race
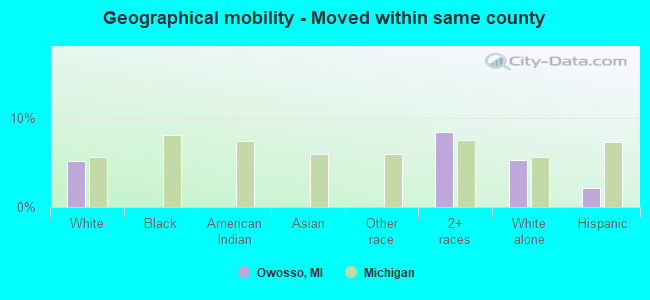
Geographical mobility - Moved within same county (%)
Geographical mobility - Moved within same county (%) - White
Geographical mobility - Moved within same county (%) - Black or African American
Geographical mobility - Moved within same county (%) - Asian
Geographical mobility - Moved within same county (%) - Hispanic or Latino
Geographical mobility - Moved within same county (%) - American Indian and Alaska Native
Geographical mobility - Moved within same county (%) - Multirace
Geographical mobility - Moved within same county (%) - Other Race
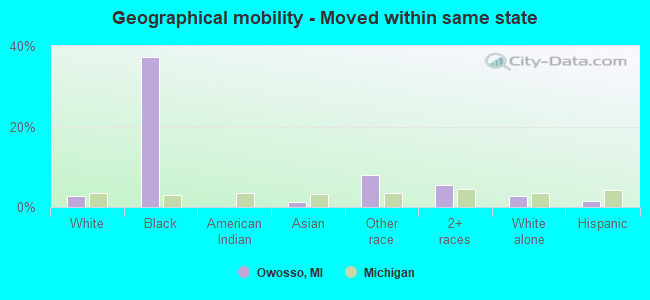
Geographical mobility - Moved from different county within same state (%)
Geographical mobility - Moved from different county within same state (%) - White
Geographical mobility - Moved from different county within same state (%) - Black or African American
Geographical mobility - Moved from different county within same state (%) - Asian
Geographical mobility - Moved from different county within same state (%) - Hispanic or Latino
Geographical mobility - Moved from different county within same state (%) - American Indian and Alaska Native
Geographical mobility - Moved from different county within same state (%) - Multirace
Geographical mobility - Moved from different county within same state (%) - Other Race
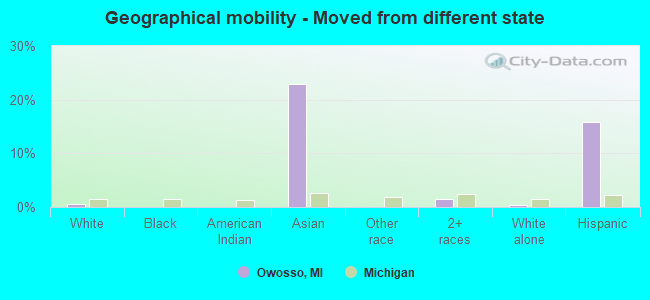
Geographical mobility - Moved from different state (%)
Geographical mobility - Moved from different state (%) - White
Geographical mobility - Moved from different state (%) - Black or African American
Geographical mobility - Moved from different state (%) - Asian
Geographical mobility - Moved from different state (%) - Hispanic or Latino
Geographical mobility - Moved from different state (%) - American Indian and Alaska Native
Geographical mobility - Moved from different state (%) - Multirace
Geographical mobility - Moved from different state (%) - Other Race
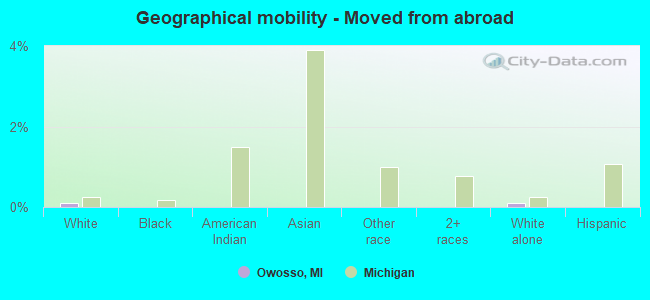
Geographical mobility - Moved from abroad (%)
Geographical mobility - Moved from abroad (%) - White
Geographical mobility - Moved from abroad (%) - Black or African American
Geographical mobility - Moved from abroad (%) - Asian
Geographical mobility - Moved from abroad (%) - Hispanic or Latino
Geographical mobility - Moved from abroad (%) - American Indian and Alaska Native
Geographical mobility - Moved from abroad (%) - Multirace
Geographical mobility - Moved from abroad (%) - Other Race
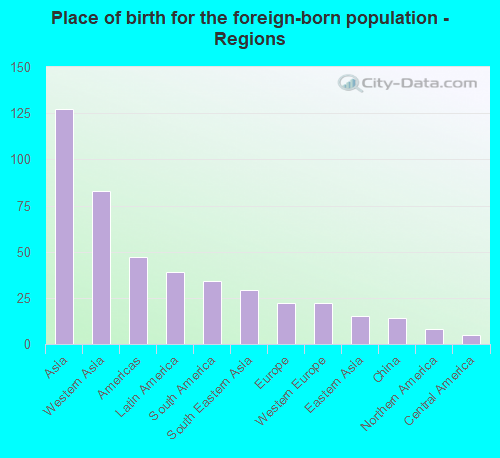
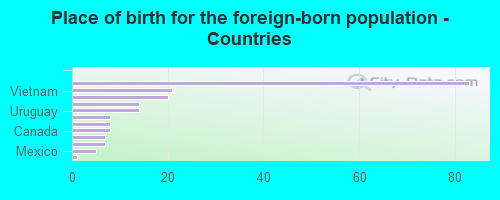
Place of birth for the foreign-born population - Ireland (%)
Place of birth for the foreign-born population - Denmark (%)
Place of birth for the foreign-born population - Norway (%)
Place of birth for the foreign-born population - Sweden (%)
Place of birth for the foreign-born population - United Kingdom (%)
Place of birth for the foreign-born population - England (%)
Place of birth for the foreign-born population - Scotland (%)
Place of birth for the foreign-born population - Other Northern Europe (%)
Place of birth for the foreign-born population - Austria (%)
Place of birth for the foreign-born population - Belgium (%)
Place of birth for the foreign-born population - France (%)
Place of birth for the foreign-born population - Germany (%)
Place of birth for the foreign-born population - Netherlands (%)
Place of birth for the foreign-born population - Switzerland (%)
Place of birth for the foreign-born population - Other Western Europe (%)
Place of birth for the foreign-born population - Greece (%)
Place of birth for the foreign-born population - Italy (%)
Place of birth for the foreign-born population - Portugal (%)
Place of birth for the foreign-born population - Spain (%)
Place of birth for the foreign-born population - Other Southern Europe (%)
Place of birth for the foreign-born population - Albania (%)
Place of birth for the foreign-born population - Belarus (%)
Place of birth for the foreign-born population - Bosnia and Herzegovina (%)
Place of birth for the foreign-born population - Bulgaria (%)
Place of birth for the foreign-born population - Croatia (%)
Place of birth for the foreign-born population - Czechoslovakia (%)
Place of birth for the foreign-born population - Hungary (%)
Place of birth for the foreign-born population - Latvia (%)
Place of birth for the foreign-born population - Lithuania (%)
Place of birth for the foreign-born population - North Macedonia (Macedonia) (%)
Place of birth for the foreign-born population - Moldova (%)
Place of birth for the foreign-born population - Poland (%)
Place of birth for the foreign-born population - Romania (%)
Place of birth for the foreign-born population - Russia (%)
Place of birth for the foreign-born population - Serbia (%)
Place of birth for the foreign-born population - Ukraine (%)
Place of birth for the foreign-born population - Other Eastern Europe (%)
Place of birth for the foreign-born population - China (%)
Place of birth for the foreign-born population - Hong Kong (%)
Place of birth for the foreign-born population - Taiwan (%)
Place of birth for the foreign-born population - Japan (%)
Place of birth for the foreign-born population - Korea (%)
Place of birth for the foreign-born population - Other Eastern Asia (%)
Place of birth for the foreign-born population - Afghanistan (%)
Place of birth for the foreign-born population - Bangladesh (%)
Place of birth for the foreign-born population - India (%)
Place of birth for the foreign-born population - Iran (%)
Place of birth for the foreign-born population - Kazakhstan (%)
Place of birth for the foreign-born population - Nepal (%)
Place of birth for the foreign-born population - Pakistan (%)
Place of birth for the foreign-born population - Sri Lanka (%)
Place of birth for the foreign-born population - Uzbekistan (%)
Place of birth for the foreign-born population - Other South Central Asia (%)
Place of birth for the foreign-born population - Burma (%)
Place of birth for the foreign-born population - Cambodia (%)
Place of birth for the foreign-born population - Indonesia (%)
Place of birth for the foreign-born population - Laos (%)
Place of birth for the foreign-born population - Malaysia (%)
Place of birth for the foreign-born population - Philippines (%)
Place of birth for the foreign-born population - Singapore (%)
Place of birth for the foreign-born population - Thailand (%)
Place of birth for the foreign-born population - Vietnam (%)
Place of birth for the foreign-born population - Other South Eastern Asia (%)
Place of birth for the foreign-born population - Armenia (%)
Place of birth for the foreign-born population - Iraq (%)
Place of birth for the foreign-born population - Israel (%)
Place of birth for the foreign-born population - Jordan (%)
Place of birth for the foreign-born population - Kuwait (%)
Place of birth for the foreign-born population - Lebanon (%)
Place of birth for the foreign-born population - Saudi Arabia (%)
Place of birth for the foreign-born population - Syria (%)
Place of birth for the foreign-born population - Turkey (%)
Place of birth for the foreign-born population - Yemen (%)
Place of birth for the foreign-born population - Other Western Asia (%)
Place of birth for the foreign-born population - Eritrea (%)
Place of birth for the foreign-born population - Ethiopia (%)
Place of birth for the foreign-born population - Kenya (%)
Place of birth for the foreign-born population - Somalia (%)
Place of birth for the foreign-born population - Uganda (%)
Place of birth for the foreign-born population - Zimbabwe (%)
Place of birth for the foreign-born population - Other Eastern Africa (%)
Place of birth for the foreign-born population - Cameroon (%)
Place of birth for the foreign-born population - Congo (%)
Place of birth for the foreign-born population - Democratic Republic of Congo (Zaire) (%)
Place of birth for the foreign-born population - Other Middle Africa (%)
Place of birth for the foreign-born population - Egypt (%)
Place of birth for the foreign-born population - Morocco (%)
Place of birth for the foreign-born population - Sudan (%)
Place of birth for the foreign-born population - Other Northern Africa (%)
Place of birth for the foreign-born population - South Africa (%)
Place of birth for the foreign-born population - Other Southern Africa (%)
Place of birth for the foreign-born population - Cabo Verde (%)
Place of birth for the foreign-born population - Ghana (%)
Place of birth for the foreign-born population - Liberia (%)
Place of birth for the foreign-born population - Nigeria (%)
Place of birth for the foreign-born population - Senegal (%)
Place of birth for the foreign-born population - Sierra Leone (%)
Place of birth for the foreign-born population - Other Western Africa (%)
Place of birth for the foreign-born population - Australia (%)
Place of birth for the foreign-born population - New Zealand (%)
Place of birth for the foreign-born population - Fiji (%)
Place of birth for the foreign-born population - Micronesia (%)
Place of birth for the foreign-born population - Bahamas (%)
Place of birth for the foreign-born population - Barbados (%)
Place of birth for the foreign-born population - Cuba (%)
Place of birth for the foreign-born population - Dominica (%)
Place of birth for the foreign-born population - Dominican Republic (%)
Place of birth for the foreign-born population - Grenada (%)
Place of birth for the foreign-born population - Haiti (%)
Place of birth for the foreign-born population - Jamaica (%)
Place of birth for the foreign-born population - St. Vincent and the Grenadines (%)
Place of birth for the foreign-born population - Trinidad and Tobago (%)
Place of birth for the foreign-born population - West Indies (%)
Place of birth for the foreign-born population - Other Caribbean (%)
Place of birth for the foreign-born population - Belize (%)
Place of birth for the foreign-born population - Costa Rica (%)
Place of birth for the foreign-born population - El Salvador (%)
Place of birth for the foreign-born population - Guatemala (%)
Place of birth for the foreign-born population - Honduras (%)
Place of birth for the foreign-born population - Mexico (%)
Place of birth for the foreign-born population - Nicaragua (%)
Place of birth for the foreign-born population - Panama (%)
Place of birth for the foreign-born population - Other Central America (%)
Place of birth for the foreign-born population - Argentina (%)
Place of birth for the foreign-born population - Bolivia (%)
Place of birth for the foreign-born population - Brazil (%)
Place of birth for the foreign-born population - Chile (%)
Place of birth for the foreign-born population - Colombia (%)
Place of birth for the foreign-born population - Ecuador (%)
Place of birth for the foreign-born population - Guyana (%)
Place of birth for the foreign-born population - Peru (%)
Place of birth for the foreign-born population - Uruguay (%)
Place of birth for the foreign-born population - Venezuela (%)
Place of birth for the foreign-born population - Other South America (%)
Place of birth for the foreign-born population - Canada (%)
Place of birth for the foreign-born population - Other Northern America (%)
Place of birth for the foreign-born population - Other (%)
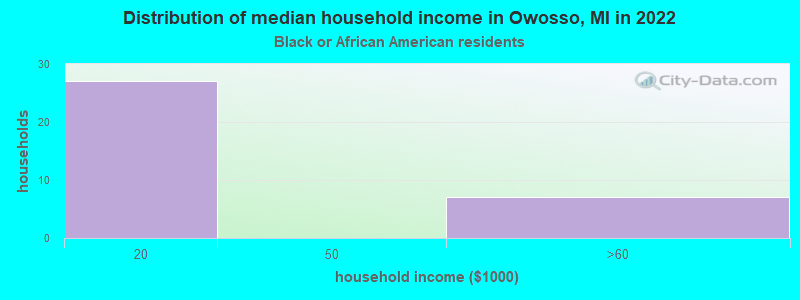
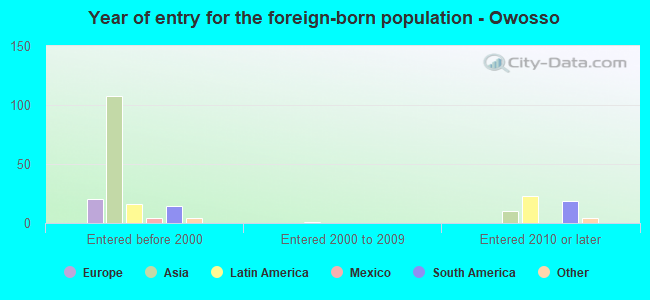
According to 2022 data, the most numerous races in Owosso, MI are White alone (13,422 residents), Black alone (99 residents), and Hispanic (538 residents). 96.0% of Owosso residents speak English at home. 1.3% of Owosso, MI residents are foreign-born , which is 348.7% less than the foreign-born rate of 6.0% across the entire state of Michigan.
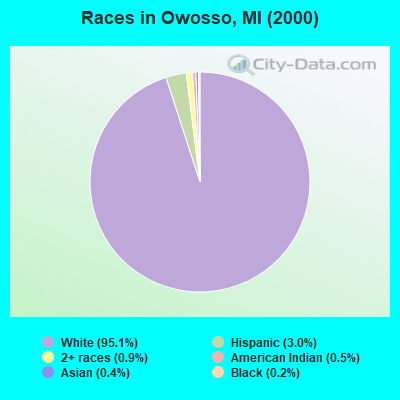
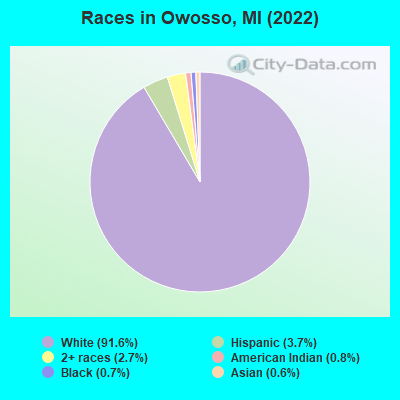
Race distribution in Owosso
2000 2022
7,806,691 78.6% White alone 1,402,047 14.1% Black alone 323,877 3.3% Hispanic 175,311 1.8% Asian alone 163,487 1.6% Two or more races 53,421 0.5% American Indian alone 11,465 0.1% Other race alone 2,145 0.02% Native Hawaiian and Other
7,289,051 72.6% White alone 1,310,464 13.1% Black alone 572,405 5.7% Hispanic 450,031 4.5% Two or more races 335,732 3.3% Asian alone 45,217 0.5% Other race alone 29,011 0.3% American Indian alone 2,207 0.02% Native Hawaiian and Other
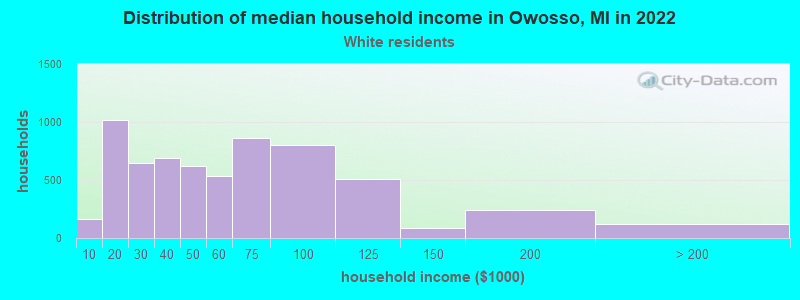
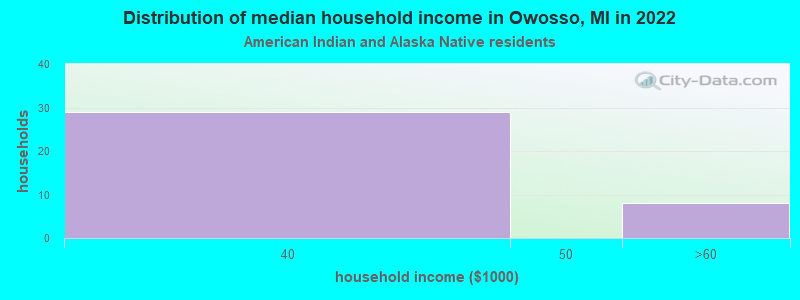
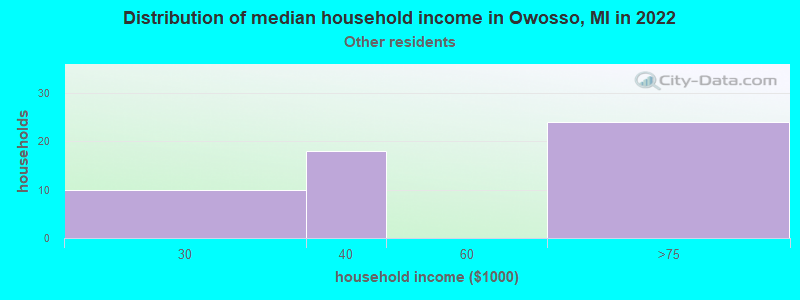
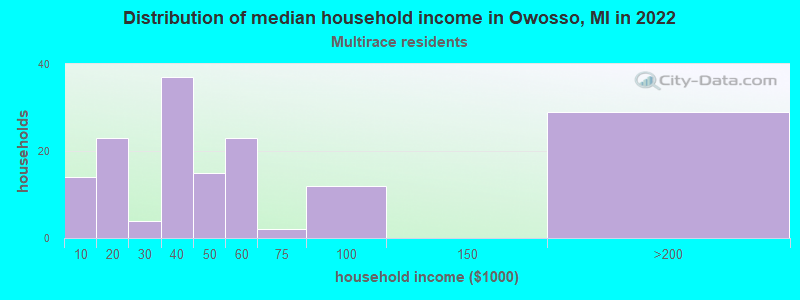
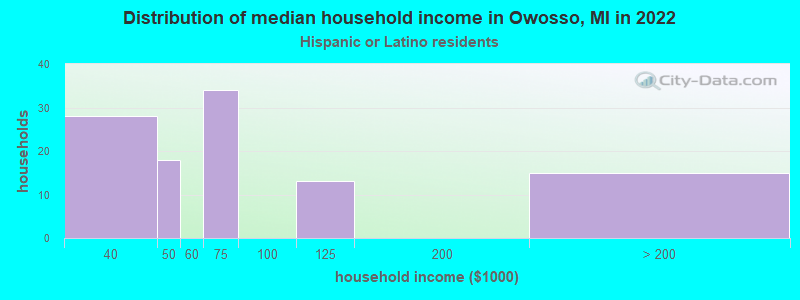
Income and house value in Owosso Median household income in 2022 $51,014 White non-Hispanic householders$42,245 Some other race householders$31,753 Two or more races householders$74,764 Hispanic or Latino race householdersMedian 2022 house value $126,117 White Non-Hispanic householders$119,488 American Indian or Alaska Native householders $133,055 Asian householders$100,215 Some other race householders$136,139 Two or more races householders$106,999 Hispanic or Latino householders
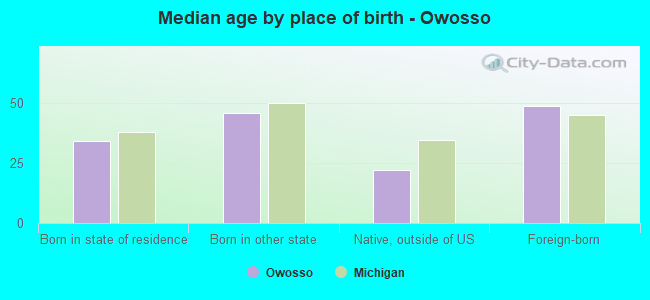
Median age by race in Owosso
37.3 Median age for White residents36.1 38.1 25.9 Median age for Black or African American residents28.2 19.9 24.0 Median age for American Indian / Alaska Native residents29.3 -673,835,124.8 48.2 Median age for Asian residents47.8 19.3 -666,666,666.0 Median age for Native Hawaiian / Pacific Islander residents-666,666,666.0 -666,666,666.0 29.3 Median age for Other race residents2.0 37.3 33.9 Median age for Two or more races residents10.7 36.0 37.8 Median age for White alone residents36.3 38.6 31.2 Median age for Hispanic or Latino residents29.5 25.2
Owner/renter occupied households by race in Owosso
House owners and renters - White residents 4,136 67.5% Owner occupied1,990 32.5% Renter occupiedHouse owners and renters - Black or African American residents 33 100.0% Renter occupiedHouse owners and renters - American Indian / Alaska Native residents 34 100.0% Renter occupiedHouse owners and renters - Asian residents 8 100.0% Owner occupiedHouse owners and renters - Other race residents 57 100.0% Renter occupiedHouse owners and renters - Two or more races residents 55 46.4% Owner occupied64 53.6% Renter occupiedHouse owners and renters - White alone residents 4,119 68.0% Owner occupied1,941 32.0% Renter occupiedHouse owners and renters - Hispanic or Latino residents 29 26.4% Owner occupied80 73.6% Renter occupied
Language usage in Owosso
English speakers - Total 96.0% of residents of Owosso speak English at home.
1.1% of residents speak Spanish at home 125 79.1% Speak English very well33 20.9% Speak English less than very well2.7% of residents speak other language at home 216 58.1% Speak English very well156 41.9% Speak English less than very well
English speakers - Born in the United States 92.0% of residents of Owosso speak English at home.
4.8% of residents speak Spanish at home 67 100.0% Speak English very well3.0% of residents speak other language at home 42 100.0% Speak English very well
English speakers - Native, born elsewhere 77.8% of residents of Owosso speak English at home.
21.4% of residents speak Spanish at home 25 100.0% Speak English very well1.7% of residents speak other language at home 2 100.0% Speak English very well
English speakers - Foreign-born 17.9% of residents of Owosso speak English at home.
20.4% of residents speak Spanish at home 15 37.5% Speak English very well25 62.5% Speak English less than very well62.2% of residents speak other language at home 20 16.4% Speak English very well102 83.6% Speak English less than very well
White (Caucasian) - Speak only English Native:
98.1% (12,584)Foreign-born:
11.4% (25)
White (Caucasian) - Speak another language Native:
2.0% (256)Foreign-born:
89.2% (195)
Asian - Speak only English Native:
4.6% (1)Foreign-born:
45.5% (21)
Asian - Speak another language Native:
98.4% (22)Foreign-born:
52.7% (24)
Two or more races - Speak another language Native:
21.8% (102)Foreign-born:
100.0% (7)
White alone - Speak only English Native:
97.9% (12,321)Foreign-born:
12.7% (25)
White alone - Speak another language Native:
2.2% (282)Foreign-born:
95.7% (188)
Hispanic or Latino - Speak another language Native:
15.5% (66)Foreign-born:
100.0% (39)
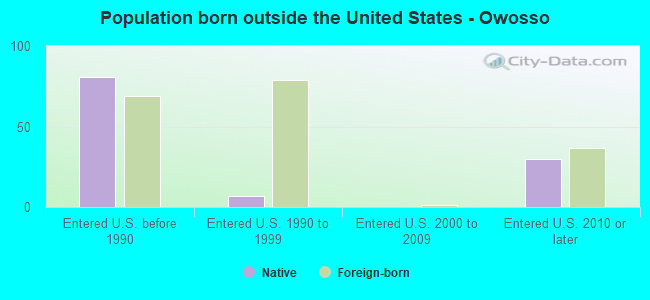
Foreign-born residents in Owosso 196 residents are foreign born
This city:
1.3%Michigan:
6.9%
Marital status for residents in Owosso Marital status - White (Caucasian) population 15 years and over
Males 38.4% Never married43.2% Now married1.1% Separated1.9% Widowed15.3% DivorcedFemales 34.9% Never married37.7% Now married0.6% Separated11.7% Widowed15.1% DivorcedWomen who gave birth in the past 12 months Now married:
61.9% (109)Unmarried:
38.1% (67)
Women who did not give birth in the past 12 months Now married:
34.8% (1,083)Unmarried:
65.2% (2,029)
Marital status - Black or African American population 15 years and over
Males 53.1% Never married17.7% Now married0.0% Separated28.1% Widowed1.0% DivorcedFemales 100.0% Never married0.0% Now married0.0% Separated0.0% Widowed0.0% DivorcedWomen who did not give birth in the past 12 months Now married:
0.0% (0)Unmarried:
100.0% (27)
Marital status - Asian population 15 years and over
Males 77.4% Never married22.6% Now married0.0% Separated0.0% Widowed0.0% DivorcedFemales 52.9% Never married47.1% Now married0.0% Separated0.0% Widowed0.0% DivorcedWomen who did not give birth in the past 12 months Now married:
33.3% (9)Unmarried:
66.7% (19)
Marital status - Other race population 15 years and over
Males 100.0% Never married0.0% Now married0.0% Separated0.0% Widowed0.0% DivorcedFemales 100.0% Never married0.0% Now married0.0% Separated0.0% Widowed0.0% DivorcedWomen who did not give birth in the past 12 months Now married:
0.0% (0)Unmarried:
100.0% (57)
Marital status - Two or more races population 15 years and over
Males 17.7% Never married51.0% Now married13.5% Separated16.7% Widowed1.0% DivorcedFemales 30.8% Never married28.0% Now married0.0% Separated0.9% Widowed40.2% DivorcedWomen who did not give birth in the past 12 months Now married:
26.1% (16)Unmarried:
73.9% (45)
Marital status - White alone, not Hispanic / Latino population 15 years and over
Males 38.7% Never married43.7% Now married1.2% Separated2.0% Widowed14.4% DivorcedFemales 34.3% Never married37.9% Now married0.6% Separated12.0% Widowed15.2% DivorcedWomen who gave birth in the past 12 months Now married:
61.9% (111)Unmarried:
38.1% (68)
Women who did not give birth in the past 12 months Now married:
35.0% (1,068)Unmarried:
65.0% (1,981)
Marital status - Hispanic or Latino population 15 years and over
Males 24.3% Never married36.0% Now married6.1% Separated0.0% Widowed33.6% DivorcedFemales 69.9% Never married24.7% Now married0.0% Separated0.0% Widowed5.4% DivorcedWomen who did not give birth in the past 12 months Now married:
22.6% (40)Unmarried:
77.4% (136)
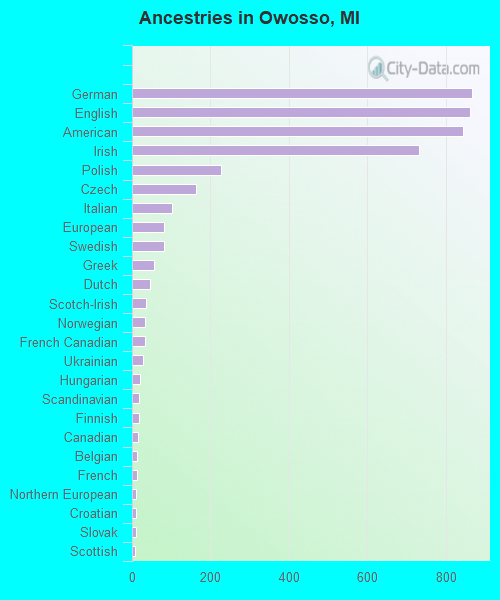
Ancestries in Owosso
867 15.3% German863 15.2% English845 14.9% American732 12.9% Irish226 4.0% Polish163 2.9% Czech101 1.8% Italian81 1.4% European81 1.4% Swedish56 1.0% Greek45 0.8% Dutch35 0.6% Scotch-Irish33 0.6% Norwegian32 0.6% French Canadian29 0.5% Ukrainian21 0.4% Hungarian19 0.3% Scandinavian18 0.3% Finnish16 0.3% Canadian14 0.2% Belgian14 0.2% French11 0.2% Northern European9 0.2% Croatian9 0.2% Slovak8 0.1% Scottish7 0.1% Eastern European4 0.07% Lebanese3 0.05% Portuguese
Children Nativity (place of birth) in Owosso
Children under 6 years - Living with two parents Both parents native 459 100.0% NativeOne native, one foreign-born parent 58 100.0% NativeChildren under 6 years - Living with one parent Native parent 454 100.0% Native
Children 6 to 17 years - Living with two parents Both parents native 914 100.0% NativeBoth parents foreign-born 41 100.0% NativeChildren 6 to 17 years - Living with one parent Native parent 966 100.0% Native
Grandparents responsible for own grandchildren in Owosso
Grandparents (30 to 59 years) White / Caucasian 25 26.8% Responsible for grandchildren68 73.2% Not responsible for grandchildrenBlack or African American 15 100.0% Not responsible for grandchildrenWhite alone, not Hispanic / Latino 25 26.9% Responsible for grandchildren68 73.1% Not responsible for grandchildrenGrandparents (60 years and over) White / Caucasian 14 35.5% Responsible for grandchildren26 64.5% Not responsible for grandchildrenWhite alone, not Hispanic / Latino 10 28.0% Responsible for grandchildren26 72.0% Not responsible for grandchildren