Races in Palmetto, Florida (FL) Detailed Stats
Data:
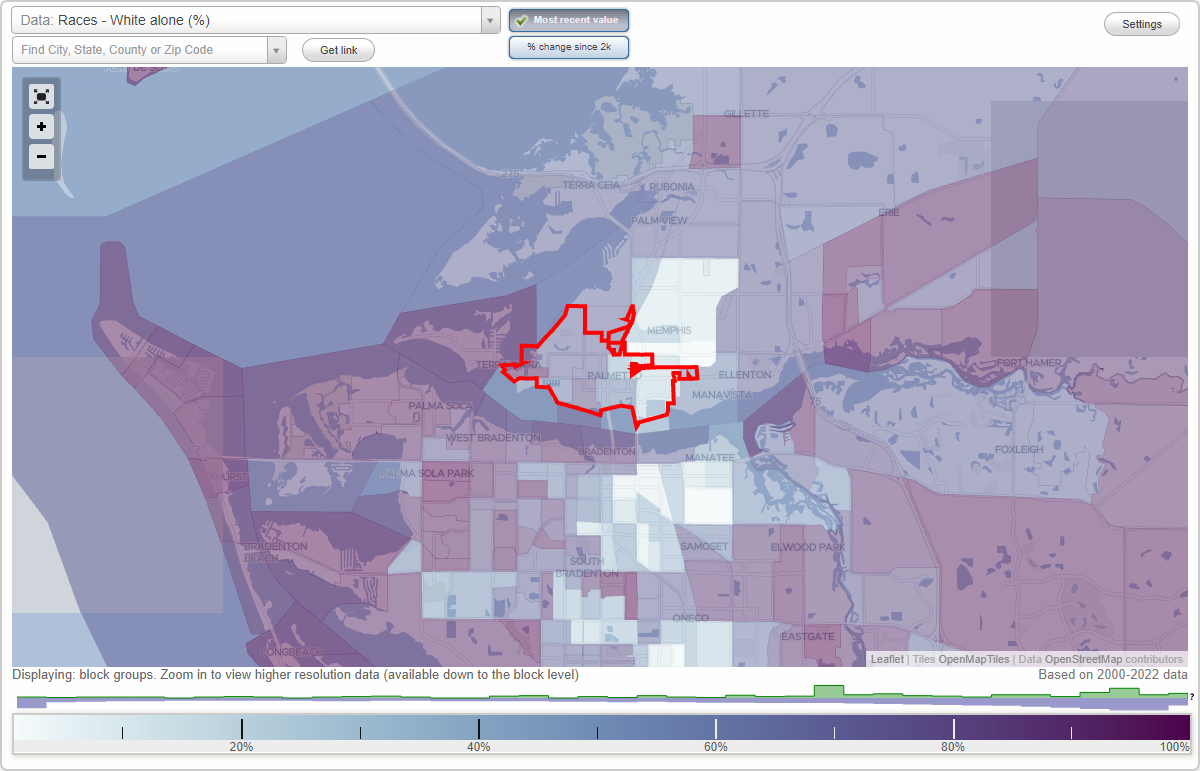
Races - White alone (%)
Races - White alone (% change since 2000)
Races - Black alone (%)
Races - Black alone (% change since 2000)
Races - American Indian alone (%)
Races - American Indian alone (% change since 2000)
Races - Asian alone (%)
Races - Asian alone (% change since 2000)
Races - Hispanic (%)
Races - Hispanic (% change since 2000)
Races - Native Hawaiian and Other Pacific Islander alone (%)
Races - Native Hawaiian and Other Pacific Islander alone (% change since 2000)
Races - Two or more races(%)
Races - Two or more races(% change since 2000)
Races - Other race alone (%)
Races - Other race alone (% change since 2000)
Racial diversity
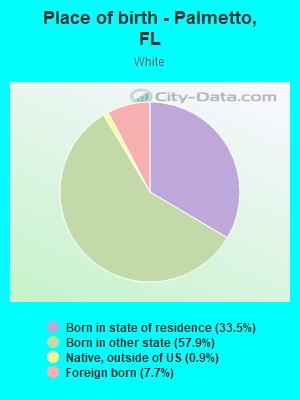
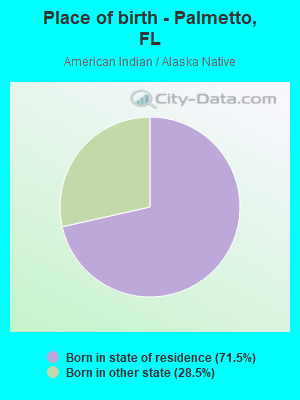
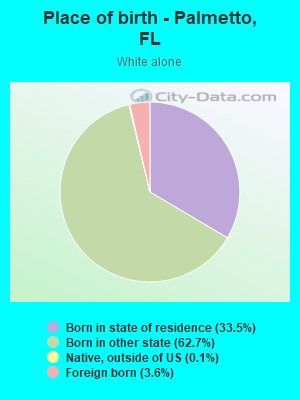
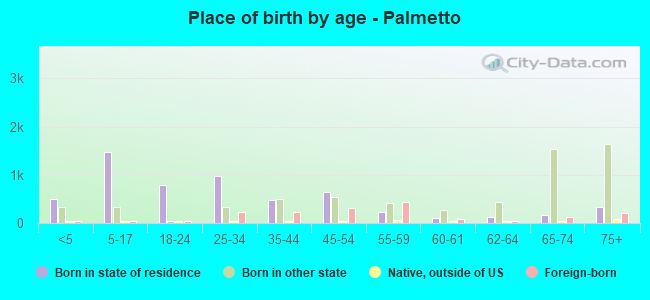
Place of birth - Born in state of residence (%)
Place of birth - Born in state of residence (%) - White
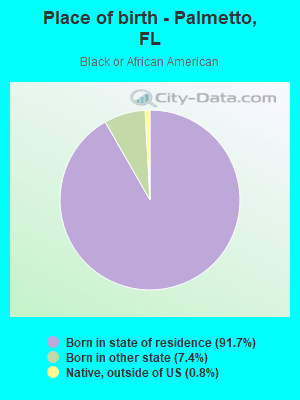
Place of birth - Born in state of residence (%) - Black or African American
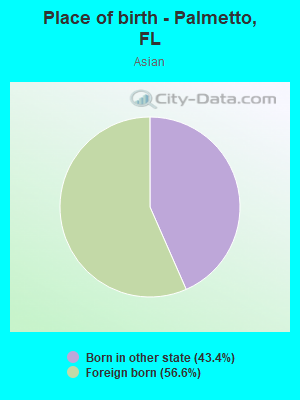
Place of birth - Born in state of residence (%) - Asian
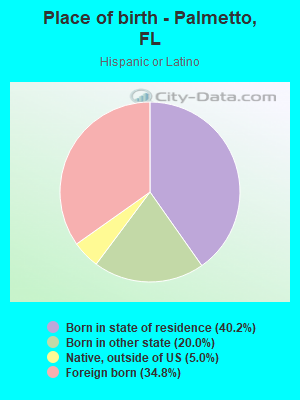
Place of birth - Born in state of residence (%) - Hispanic or Latino
Place of birth - Born in state of residence (%) - American Indian and Alaska Native
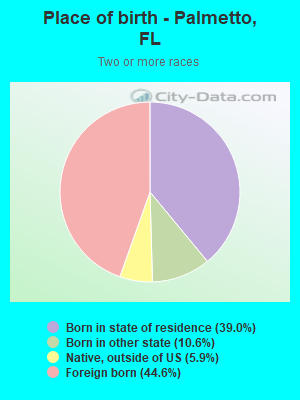
Place of birth - Born in state of residence (%) - Multirace
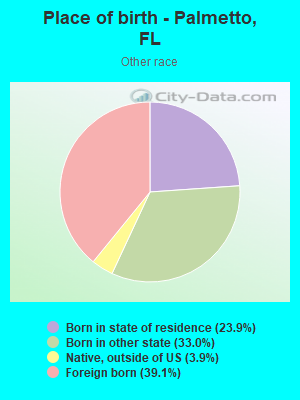
Place of birth - Born in state of residence (%) - Other Race
Place of birth - Born in other state (%)
Place of birth - Born in other state (%) - White
Place of birth - Born in other state (%) - Black or African American
Place of birth - Born in other state (%) - Asian
Place of birth - Born in other state (%) - Hispanic or Latino
Place of birth - Born in other state (%) - American Indian and Alaska Native
Place of birth - Born in other state (%) - Multirace
Place of birth - Born in other state (%) - Other Race
Place of birth - Native, outside of US (%)
Place of birth - Native, outside of US (%) - White
Place of birth - Native, outside of US (%) - Black or African American
Place of birth - Native, outside of US (%) - Asian
Place of birth - Native, outside of US (%) - Hispanic or Latino
Place of birth - Native, outside of US (%) - American Indian and Alaska Native
Place of birth - Native, outside of US (%) - Multirace
Place of birth - Native, outside of US (%) - Other Race
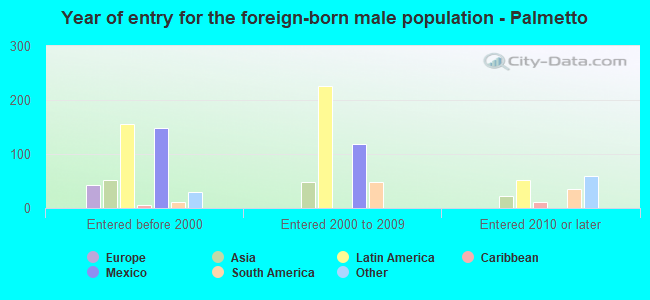
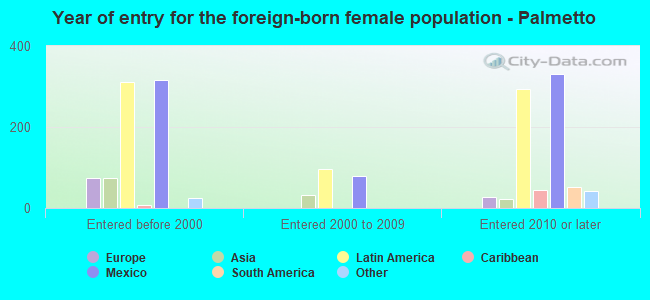
Place of birth - Foreign born (%)
Place of birth - Foreign born (%) - White
Place of birth - Foreign born (%) - Black or African American
Place of birth - Foreign born (%) - Asian
Place of birth - Foreign born (%) - Hispanic or Latino
Place of birth - Foreign born (%) - American Indian and Alaska Native
Place of birth - Foreign born (%) - Multirace
Place of birth - Foreign born (%) - Other Race
Residents speaking English at home (%)
Residents speaking English at home - Born in the United States (%)
Residents speaking English at home - Native, born elsewhere (%)
Residents speaking English at home - Foreign born (%)
Residents speaking Spanish at home (%)
Residents speaking Spanish at home - Born in the United States (%)
Residents speaking Spanish at home - Native, born elsewhere (%)
Residents speaking Spanish at home - Foreign born (%)
Residents speaking other language at home (%)
Residents speaking other language at home - Born in the United States (%)
Residents speaking other language at home - Native, born elsewhere (%)
Residents speaking other language at home - Foreign born (%)
Marital status - Never married (%)
Marital status - Now married (%)
Marital status - Separated (%)
Marital status - Widowed (%)
Marital status - Divorced (%)
Ancestries Reported - Arab (%)
Ancestries Reported - Czech (%)
Ancestries Reported - Danish (%)
Ancestries Reported - Dutch (%)
Ancestries Reported - English (%)
Ancestries Reported - French (%)
Ancestries Reported - French Canadian (%)
Ancestries Reported - German (%)
Ancestries Reported - Greek (%)
Ancestries Reported - Hungarian (%)
Ancestries Reported - Irish (%)
Ancestries Reported - Italian (%)
Ancestries Reported - Lithuanian (%)
Ancestries Reported - Norwegian (%)
Ancestries Reported - Polish (%)
Ancestries Reported - Portuguese (%)
Ancestries Reported - Russian (%)
Ancestries Reported - Scotch-Irish (%)
Ancestries Reported - Scottish (%)
Ancestries Reported - Slovak (%)
Ancestries Reported - Subsaharan African (%)
Ancestries Reported - Swedish (%)
Ancestries Reported - Swiss (%)
Ancestries Reported - Ukrainian (%)
Ancestries Reported - United States (%)
Ancestries Reported - Welsh (%)
Ancestries Reported - West Indian (%)
Ancestries Reported - Other (%)
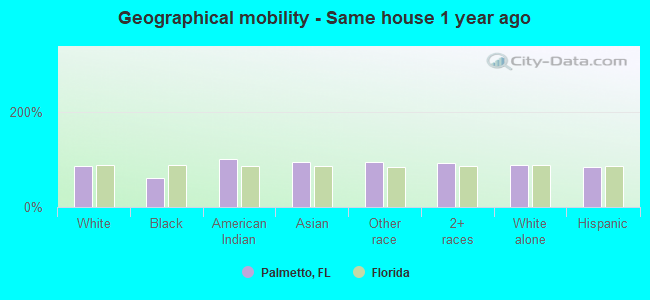
Geographical mobility - Same house 1 year ago (%)
Geographical mobility - Same house 1 year ago (%) - White
Geographical mobility - Same house 1 year ago (%) - Black or African American
Geographical mobility - Same house 1 year ago (%) - Asian
Geographical mobility - Same house 1 year ago (%) - Hispanic or Latino
Geographical mobility - Same house 1 year ago (%) - American Indian and Alaska Native
Geographical mobility - Same house 1 year ago (%) - Multirace
Geographical mobility - Same house 1 year ago (%) - Other Race
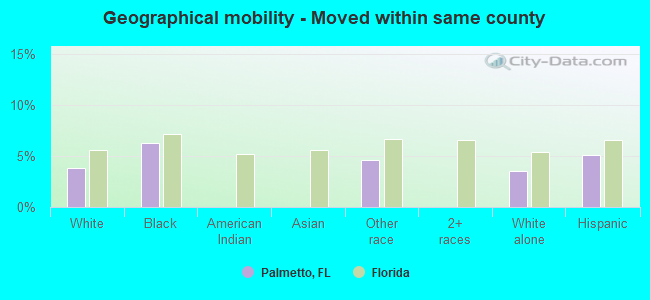
Geographical mobility - Moved within same county (%)
Geographical mobility - Moved within same county (%) - White
Geographical mobility - Moved within same county (%) - Black or African American
Geographical mobility - Moved within same county (%) - Asian
Geographical mobility - Moved within same county (%) - Hispanic or Latino
Geographical mobility - Moved within same county (%) - American Indian and Alaska Native
Geographical mobility - Moved within same county (%) - Multirace
Geographical mobility - Moved within same county (%) - Other Race
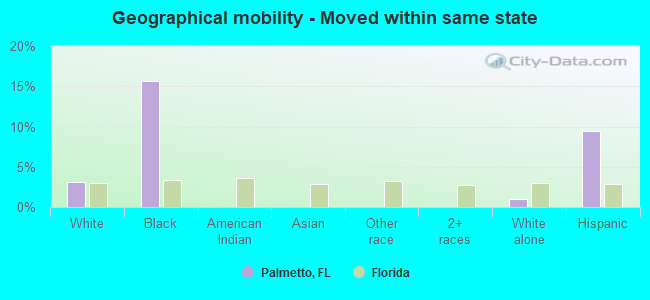
Geographical mobility - Moved from different county within same state (%)
Geographical mobility - Moved from different county within same state (%) - White
Geographical mobility - Moved from different county within same state (%) - Black or African American
Geographical mobility - Moved from different county within same state (%) - Asian
Geographical mobility - Moved from different county within same state (%) - Hispanic or Latino
Geographical mobility - Moved from different county within same state (%) - American Indian and Alaska Native
Geographical mobility - Moved from different county within same state (%) - Multirace
Geographical mobility - Moved from different county within same state (%) - Other Race
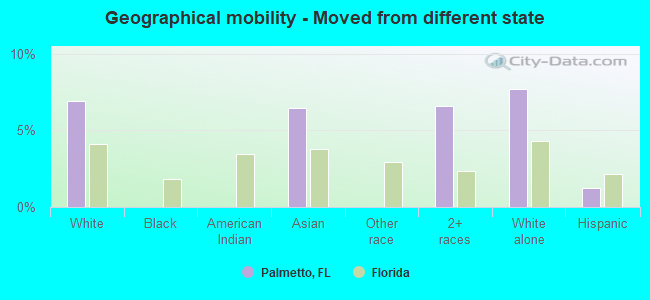
Geographical mobility - Moved from different state (%)
Geographical mobility - Moved from different state (%) - White
Geographical mobility - Moved from different state (%) - Black or African American
Geographical mobility - Moved from different state (%) - Asian
Geographical mobility - Moved from different state (%) - Hispanic or Latino
Geographical mobility - Moved from different state (%) - American Indian and Alaska Native
Geographical mobility - Moved from different state (%) - Multirace
Geographical mobility - Moved from different state (%) - Other Race
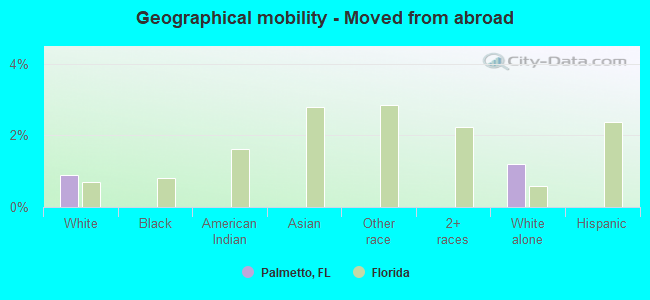
Geographical mobility - Moved from abroad (%)
Geographical mobility - Moved from abroad (%) - White
Geographical mobility - Moved from abroad (%) - Black or African American
Geographical mobility - Moved from abroad (%) - Asian
Geographical mobility - Moved from abroad (%) - Hispanic or Latino
Geographical mobility - Moved from abroad (%) - American Indian and Alaska Native
Geographical mobility - Moved from abroad (%) - Multirace
Geographical mobility - Moved from abroad (%) - Other Race
Place of birth for the foreign-born population - Ireland (%)
Place of birth for the foreign-born population - Denmark (%)
Place of birth for the foreign-born population - Norway (%)
Place of birth for the foreign-born population - Sweden (%)
Place of birth for the foreign-born population - United Kingdom (%)
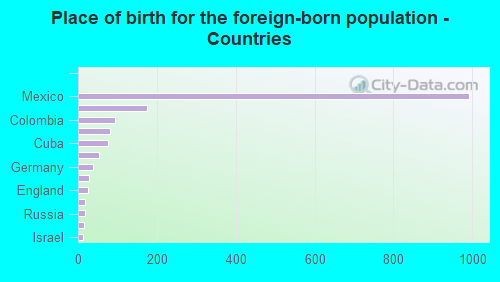
Place of birth for the foreign-born population - England (%)
Place of birth for the foreign-born population - Scotland (%)
Place of birth for the foreign-born population - Other Northern Europe (%)
Place of birth for the foreign-born population - Austria (%)
Place of birth for the foreign-born population - Belgium (%)
Place of birth for the foreign-born population - France (%)
Place of birth for the foreign-born population - Germany (%)
Place of birth for the foreign-born population - Netherlands (%)
Place of birth for the foreign-born population - Switzerland (%)
Place of birth for the foreign-born population - Other Western Europe (%)
Place of birth for the foreign-born population - Greece (%)
Place of birth for the foreign-born population - Italy (%)
Place of birth for the foreign-born population - Portugal (%)
Place of birth for the foreign-born population - Spain (%)
Place of birth for the foreign-born population - Other Southern Europe (%)
Place of birth for the foreign-born population - Albania (%)
Place of birth for the foreign-born population - Belarus (%)
Place of birth for the foreign-born population - Bosnia and Herzegovina (%)
Place of birth for the foreign-born population - Bulgaria (%)
Place of birth for the foreign-born population - Croatia (%)
Place of birth for the foreign-born population - Czechoslovakia (%)
Place of birth for the foreign-born population - Hungary (%)
Place of birth for the foreign-born population - Latvia (%)
Place of birth for the foreign-born population - Lithuania (%)
Place of birth for the foreign-born population - North Macedonia (Macedonia) (%)
Place of birth for the foreign-born population - Moldova (%)
Place of birth for the foreign-born population - Poland (%)
Place of birth for the foreign-born population - Romania (%)
Place of birth for the foreign-born population - Russia (%)
Place of birth for the foreign-born population - Serbia (%)
Place of birth for the foreign-born population - Ukraine (%)
Place of birth for the foreign-born population - Other Eastern Europe (%)
Place of birth for the foreign-born population - China (%)
Place of birth for the foreign-born population - Hong Kong (%)
Place of birth for the foreign-born population - Taiwan (%)
Place of birth for the foreign-born population - Japan (%)
Place of birth for the foreign-born population - Korea (%)
Place of birth for the foreign-born population - Other Eastern Asia (%)
Place of birth for the foreign-born population - Afghanistan (%)
Place of birth for the foreign-born population - Bangladesh (%)
Place of birth for the foreign-born population - India (%)
Place of birth for the foreign-born population - Iran (%)
Place of birth for the foreign-born population - Kazakhstan (%)
Place of birth for the foreign-born population - Nepal (%)
Place of birth for the foreign-born population - Pakistan (%)
Place of birth for the foreign-born population - Sri Lanka (%)
Place of birth for the foreign-born population - Uzbekistan (%)
Place of birth for the foreign-born population - Other South Central Asia (%)
Place of birth for the foreign-born population - Burma (%)
Place of birth for the foreign-born population - Cambodia (%)
Place of birth for the foreign-born population - Indonesia (%)
Place of birth for the foreign-born population - Laos (%)
Place of birth for the foreign-born population - Malaysia (%)
Place of birth for the foreign-born population - Philippines (%)
Place of birth for the foreign-born population - Singapore (%)
Place of birth for the foreign-born population - Thailand (%)
Place of birth for the foreign-born population - Vietnam (%)
Place of birth for the foreign-born population - Other South Eastern Asia (%)
Place of birth for the foreign-born population - Armenia (%)
Place of birth for the foreign-born population - Iraq (%)
Place of birth for the foreign-born population - Israel (%)
Place of birth for the foreign-born population - Jordan (%)
Place of birth for the foreign-born population - Kuwait (%)
Place of birth for the foreign-born population - Lebanon (%)
Place of birth for the foreign-born population - Saudi Arabia (%)
Place of birth for the foreign-born population - Syria (%)
Place of birth for the foreign-born population - Turkey (%)
Place of birth for the foreign-born population - Yemen (%)
Place of birth for the foreign-born population - Other Western Asia (%)
Place of birth for the foreign-born population - Eritrea (%)
Place of birth for the foreign-born population - Ethiopia (%)
Place of birth for the foreign-born population - Kenya (%)
Place of birth for the foreign-born population - Somalia (%)
Place of birth for the foreign-born population - Uganda (%)
Place of birth for the foreign-born population - Zimbabwe (%)
Place of birth for the foreign-born population - Other Eastern Africa (%)
Place of birth for the foreign-born population - Cameroon (%)
Place of birth for the foreign-born population - Congo (%)
Place of birth for the foreign-born population - Democratic Republic of Congo (Zaire) (%)
Place of birth for the foreign-born population - Other Middle Africa (%)
Place of birth for the foreign-born population - Egypt (%)
Place of birth for the foreign-born population - Morocco (%)
Place of birth for the foreign-born population - Sudan (%)
Place of birth for the foreign-born population - Other Northern Africa (%)
Place of birth for the foreign-born population - South Africa (%)
Place of birth for the foreign-born population - Other Southern Africa (%)
Place of birth for the foreign-born population - Cabo Verde (%)
Place of birth for the foreign-born population - Ghana (%)
Place of birth for the foreign-born population - Liberia (%)
Place of birth for the foreign-born population - Nigeria (%)
Place of birth for the foreign-born population - Senegal (%)
Place of birth for the foreign-born population - Sierra Leone (%)
Place of birth for the foreign-born population - Other Western Africa (%)
Place of birth for the foreign-born population - Australia (%)
Place of birth for the foreign-born population - New Zealand (%)
Place of birth for the foreign-born population - Fiji (%)
Place of birth for the foreign-born population - Micronesia (%)
Place of birth for the foreign-born population - Bahamas (%)
Place of birth for the foreign-born population - Barbados (%)
Place of birth for the foreign-born population - Cuba (%)
Place of birth for the foreign-born population - Dominica (%)
Place of birth for the foreign-born population - Dominican Republic (%)
Place of birth for the foreign-born population - Grenada (%)
Place of birth for the foreign-born population - Haiti (%)
Place of birth for the foreign-born population - Jamaica (%)
Place of birth for the foreign-born population - St. Vincent and the Grenadines (%)
Place of birth for the foreign-born population - Trinidad and Tobago (%)
Place of birth for the foreign-born population - West Indies (%)
Place of birth for the foreign-born population - Other Caribbean (%)
Place of birth for the foreign-born population - Belize (%)
Place of birth for the foreign-born population - Costa Rica (%)
Place of birth for the foreign-born population - El Salvador (%)
Place of birth for the foreign-born population - Guatemala (%)
Place of birth for the foreign-born population - Honduras (%)
Place of birth for the foreign-born population - Mexico (%)
Place of birth for the foreign-born population - Nicaragua (%)
Place of birth for the foreign-born population - Panama (%)
Place of birth for the foreign-born population - Other Central America (%)
Place of birth for the foreign-born population - Argentina (%)
Place of birth for the foreign-born population - Bolivia (%)
Place of birth for the foreign-born population - Brazil (%)
Place of birth for the foreign-born population - Chile (%)
Place of birth for the foreign-born population - Colombia (%)
Place of birth for the foreign-born population - Ecuador (%)
Place of birth for the foreign-born population - Guyana (%)
Place of birth for the foreign-born population - Peru (%)
Place of birth for the foreign-born population - Uruguay (%)
Place of birth for the foreign-born population - Venezuela (%)
Place of birth for the foreign-born population - Other South America (%)
Place of birth for the foreign-born population - Canada (%)
Place of birth for the foreign-born population - Other Northern America (%)
Place of birth for the foreign-born population - Other (%)
Irish Celtic Festival, Palmetto Heritage Festival, Festival of the Arts, Paul Anka & Baseball, all this weekend! (0 replies)Beertopia, Parrish Heritage Days, Art in the Park, Gamble Plantation Open House & more, all this weekend! (2 replies)Gem Jewelry & Bead Show, Special Olympics Paddle Competition, Opera Open House, Wrestling & More, all this weekend! (0 replies)Offshore Grand Prix Races, Summer Fest, Kayak Festival, Parades, Picnics & lots of Fireworks, all this weekend! (1 reply)DeSoto Heritage Grand Parade, SRQ Comic-Con, Rowing Championships, BIG Car Show, Tattoo Expo & more, all this weekend! (1 reply)Sarasota & Manatee Counties news thread (4375 replies)
Latest news about races in Palmetto, FL collected exclusively by city-data.com from local newspapers, TV, and radio stations
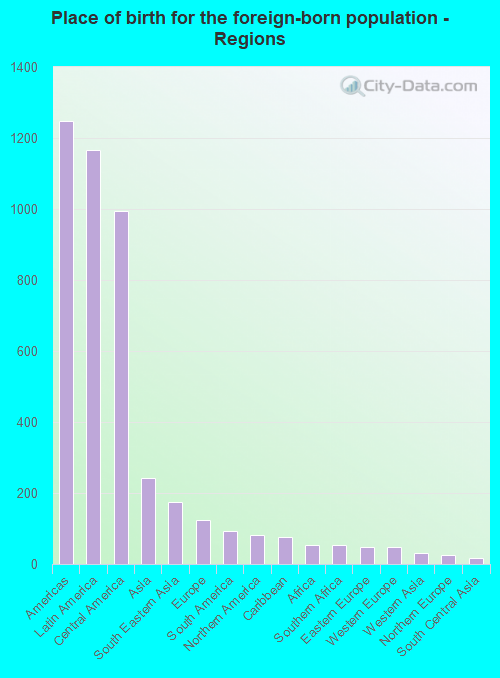
According to 2022 data, the most numerous races in Palmetto, FL are White alone (8,520 residents), Hispanic (3,137 residents), and Black alone (2,051 residents). 82.8% of Palmetto residents speak English at home. 11.8% of Palmetto, FL residents are foreign-born (8.3% born in Latin America, 1.7% born in Asia), which is 78.5% less than the foreign-born rate of 21.0% across the entire state of Florida.
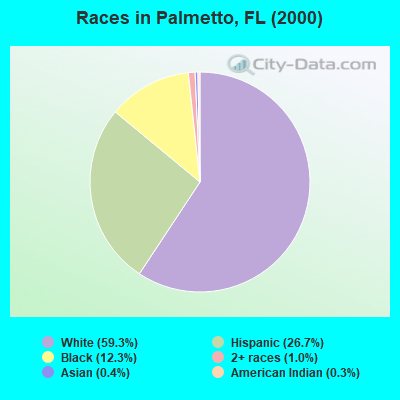
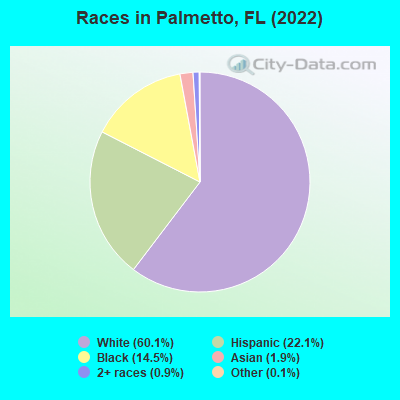
Race distribution in Palmetto
2000 2022
10,458,509 65.4% White alone 2,682,715 16.8% Hispanic 2,264,268 14.2% Black alone 261,693 1.6% Asian alone 236,954 1.5% Two or more races 42,358 0.3% American Indian alone 28,994 0.2% Other race alone 6,887 0.04% Native Hawaiian and Other
11,309,403 50.8% White alone 6,025,039 27.1% Hispanic 3,241,015 14.6% Black alone 861,630 3.9% Two or more races 623,692 2.8% Asian alone 152,054 0.7% Other race alone 22,504 0.1% American Indian alone 9,486 0.04% Native Hawaiian and Other
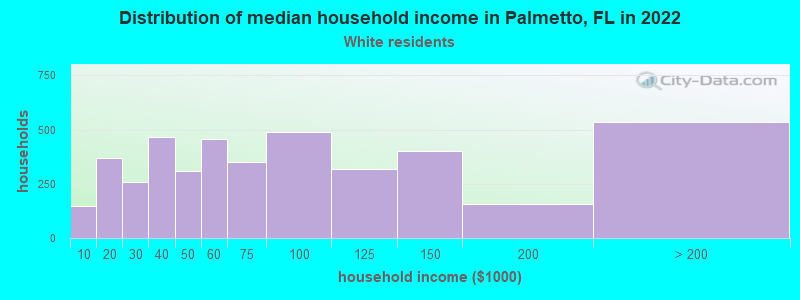
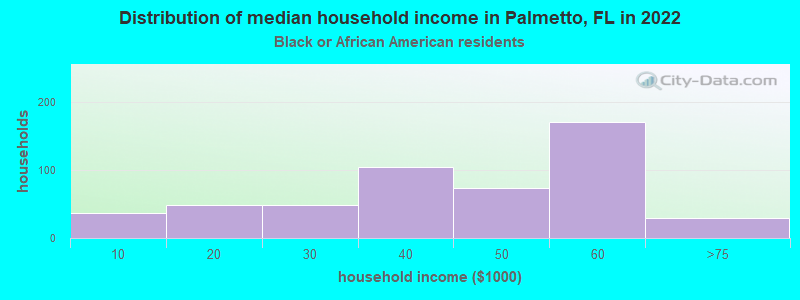
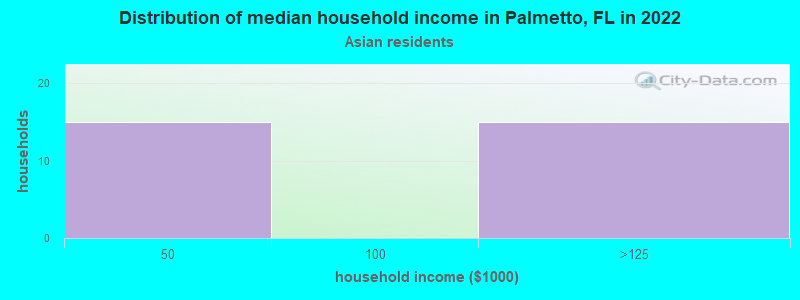
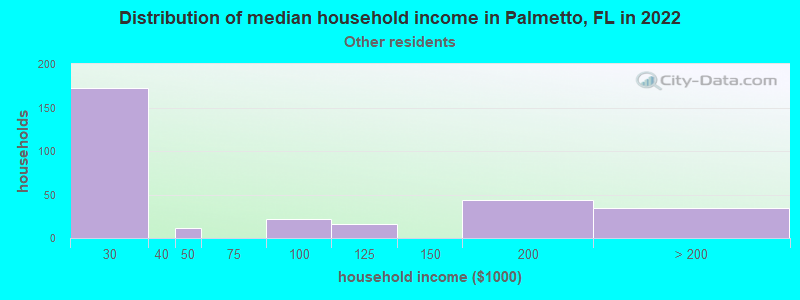
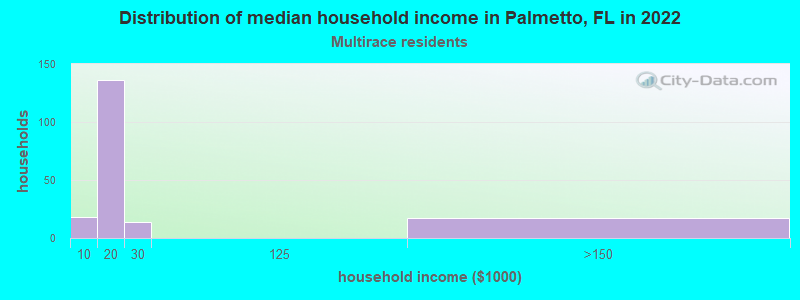
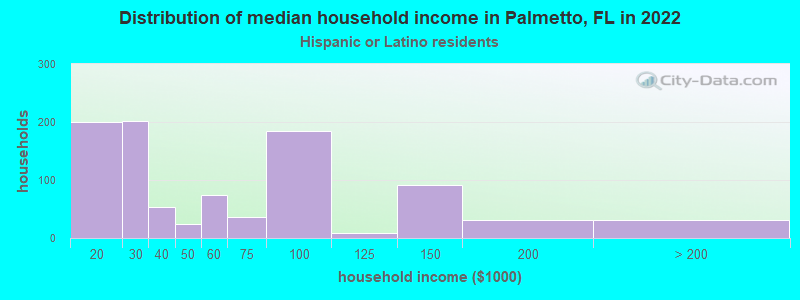
Income and house value in Palmetto Median household income in 2022 $63,664 White non-Hispanic householders$49,988 Black householders$11,263 Two or more races householdersMedian 2022 house value $328,829 White Non-Hispanic householders$230,942 Black or African American householders$276,985 Some other race householders$392,638 Two or more races householders$264,296 Hispanic or Latino householders
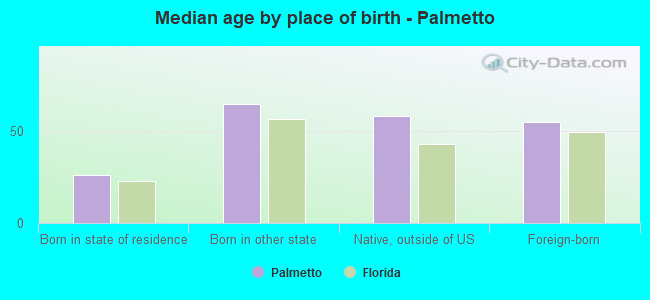
Median age by race in Palmetto
56.4 Median age for White residents52.1 62.0 29.2 Median age for Black or African American residents26.6 35.9 27.7 Median age for American Indian / Alaska Native residents-611,418,047.3 27.5 51.3 Median age for Asian residents60.5 42.1 -679,849,340.2 Median age for Native Hawaiian / Pacific Islander residents-858,307,848.3 -443,298,968.6 31.2 Median age for Other race residents32.4 30.4 60.2 Median age for Two or more races residents35.4 68.2 60.0 Median age for White alone residents54.0 63.7 30.9 Median age for Hispanic or Latino residents30.5 31.8
Owner/renter occupied households by race in Palmetto
House owners and renters - White residents 3,028 71.9% Owner occupied1,183 28.1% Renter occupiedHouse owners and renters - Black or African American residents 200 35.2% Owner occupied368 64.8% Renter occupiedHouse owners and renters - American Indian / Alaska Native residents 4 23.9% Owner occupied12 76.1% Renter occupiedHouse owners and renters - Asian residents 17 54.6% Owner occupied14 45.4% Renter occupiedHouse owners and renters - Other race residents 100 28.4% Owner occupied253 71.6% Renter occupiedHouse owners and renters - Two or more races residents 41 19.3% Owner occupied173 80.7% Renter occupiedHouse owners and renters - White alone residents 2,859 73.1% Owner occupied1,050 26.9% Renter occupiedHouse owners and renters - Hispanic or Latino residents 333 37.8% Owner occupied549 62.2% Renter occupied
Language usage in Palmetto
English speakers - Total 82.8% of residents of Palmetto speak English at home.
12.9% of residents speak Spanish at home 1,047 60.5% Speak English very well684 39.5% Speak English less than very well4.0% of residents speak other language at home 302 56.6% Speak English very well232 43.4% Speak English less than very well
English speakers - Born in the United States 95.9% of residents of Palmetto speak English at home.
2.1% of residents speak Spanish at home 117 92.1% Speak English very well10 7.9% Speak English less than very well2.4% of residents speak other language at home 147 100.0% Speak English very well
English speakers - Native, born elsewhere 11.0% of residents of Palmetto speak English at home.
81.8% of residents speak Spanish at home 61 41.2% Speak English very well87 58.8% Speak English less than very well2.8% of residents speak other language at home 5 100.0% Speak English very well
English speakers - Foreign-born 19.5% of residents of Palmetto speak English at home.
55.6% of residents speak Spanish at home 310 33.7% Speak English very well611 66.3% Speak English less than very well22.9% of residents speak other language at home 127 33.5% Speak English very well252 66.5% Speak English less than very well
White (Caucasian) - Speak only English Native:
96.0% (8,352)Foreign-born:
17.3% (129)
White (Caucasian) - Speak another language Native:
4.1% (353)Foreign-born:
72.1% (536)
Asian - Speak another language Native:
100.0% (77)Foreign-born:
81.0% (142)
Other race - Speak only English Native:
14.6% (52)Foreign-born:
20.2% (69)
Other race - Speak another language Native:
81.1% (292)Foreign-born:
80.9% (278)
Two or more races - Speak only English Native:
88.1% (375)Foreign-born:
67.7% (218)
Two or more races - Speak another language Native:
6.4% (27)Foreign-born:
49.2% (158)
White alone - Speak only English Native:
98.5% (7,836)Foreign-born:
36.6% (112)
White alone - Speak another language Native:
1.4% (114)Foreign-born:
64.6% (198)
Hispanic or Latino - Speak only English Native:
62.6% (1,102)Foreign-born:
19.9% (217)
Hispanic or Latino - Speak another language Native:
42.5% (748)Foreign-born:
83.9% (916)
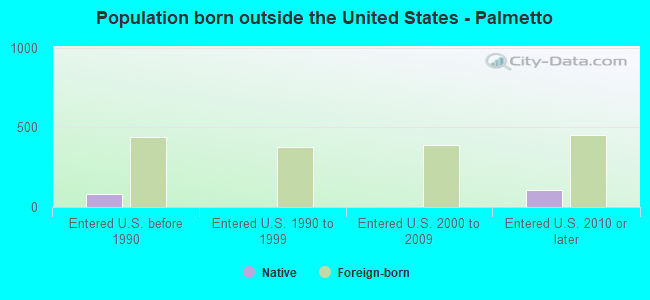
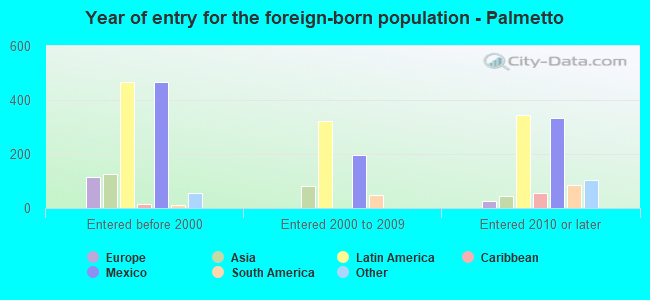
Foreign-born residents in Palmetto 1,668 residents are foreign born (8.3% Latin America , 1.7% Asia ).
This city:
11.8%Florida:
21.1%
Marital status for residents in Palmetto Marital status - White (Caucasian) population 15 years and over
Males 34.7% Never married51.1% Now married1.1% Separated1.9% Widowed11.2% DivorcedFemales 18.2% Never married51.3% Now married1.6% Separated13.5% Widowed15.3% DivorcedWomen who gave birth in the past 12 months Now married:
23.6% (12)Unmarried:
76.4% (40)
Women who did not give birth in the past 12 months Now married:
42.6% (496)Unmarried:
57.4% (668)
Marital status - Black or African American population 15 years and over
Males 52.6% Never married35.4% Now married2.6% Separated8.2% Widowed1.2% DivorcedFemales 54.5% Never married13.0% Now married14.2% Separated12.3% Widowed6.0% DivorcedWomen who gave birth in the past 12 months Now married:
45.9% (62)Unmarried:
54.1% (73)
Women who did not give birth in the past 12 months Now married:
0.0% (0)Unmarried:
100.0% (334)
Marital status - American Indian / Alaska Native population 15 years and over
Males 0.0% Never married100.0% Now married0.0% Separated0.0% Widowed0.0% DivorcedFemales 0.0% Never married27.3% Now married0.0% Separated0.0% Widowed72.7% DivorcedWomen who did not give birth in the past 12 months Now married:
100.0% (5)Unmarried:
0.0% (0)
Marital status - Asian population 15 years and over
Males 0.0% Never married100.0% Now married0.0% Separated0.0% Widowed0.0% DivorcedFemales 4.2% Never married35.8% Now married0.0% Separated37.5% Widowed22.5% DivorcedWomen who gave birth in the past 12 months Now married:
0.0% (0)Unmarried:
100.0% (28)
Women who did not give birth in the past 12 months Now married:
73.7% (14)Unmarried:
26.3% (5)
Marital status - Other race population 15 years and over
Males 77.3% Never married22.7% Now married0.0% Separated0.0% Widowed0.0% DivorcedFemales 23.9% Never married73.0% Now married3.1% Separated0.0% Widowed0.0% DivorcedWomen who did not give birth in the past 12 months Now married:
24.7% (29)Unmarried:
75.3% (88)
Marital status - Two or more races population 15 years and over
Males 41.3% Never married58.7% Now married0.0% Separated0.0% Widowed0.0% DivorcedFemales 5.0% Never married82.7% Now married0.0% Separated0.0% Widowed12.2% DivorcedWomen who did not give birth in the past 12 months Now married:
0.0% (0)Unmarried:
100.0% (10)
Marital status - White alone, not Hispanic / Latino population 15 years and over
Males 31.2% Never married52.1% Now married1.3% Separated2.3% Widowed13.1% DivorcedFemales 13.8% Never married53.9% Now married1.2% Separated13.8% Widowed17.3% DivorcedWomen who gave birth in the past 12 months Now married:
39.4% (13)Unmarried:
60.6% (21)
Women who did not give birth in the past 12 months Now married:
42.9% (380)Unmarried:
57.1% (507)
Marital status - Hispanic or Latino population 15 years and over
Males 56.3% Never married43.7% Now married0.0% Separated0.0% Widowed0.0% DivorcedFemales 38.4% Never married48.9% Now married4.7% Separated6.6% Widowed1.3% DivorcedWomen who gave birth in the past 12 months Now married:
0.0% (0)Unmarried:
100.0% (88)
Women who did not give birth in the past 12 months Now married:
38.7% (187)Unmarried:
61.3% (297)
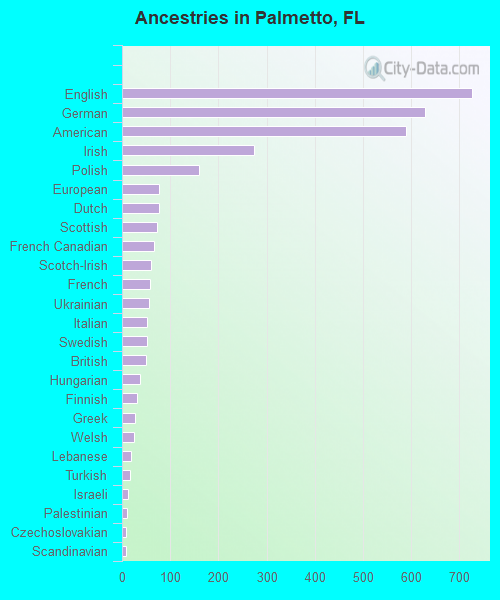
Ancestries in Palmetto
725 11.1% English628 9.6% German589 9.0% American273 4.2% Irish159 2.4% Polish77 1.2% European76 1.2% Dutch72 1.1% Scottish66 1.0% French Canadian61 0.9% Scotch-Irish59 0.9% French55 0.8% Ukrainian51 0.8% Italian51 0.8% Swedish49 0.7% British37 0.6% Hungarian32 0.5% Finnish28 0.4% Greek25 0.4% Welsh18 0.3% Lebanese17 0.3% Turkish13 0.2% Israeli10 0.2% Palestinian9 0.1% Czechoslovakian9 0.1% Scandinavian7 0.1% Slavic6 0.09% Belgian6 0.09% Russian
Children Nativity (place of birth) in Palmetto
Children under 6 years - Living with two parents Both parents native 222 100.0% NativeBoth parents foreign-born 76 85.4% Native13 14.6% Foreign-bornOne native, one foreign-born parent 18 100.0% NativeChildren under 6 years - Living with one parent Native parent 226 100.0% NativeForeign-born parent 114 100.0% NativeChildren 6 to 17 years - Living with two parents Both parents native 545 97.8% Native12 2.2% Foreign-bornBoth parents foreign-born 108 90.8% Native11 9.2% Foreign-bornOne native, one foreign-born parent 161 100.0% NativeChildren 6 to 17 years - Living with one parent Native parent 438 100.0% NativeForeign-born parent 159 53.0% Native141 47.0% Foreign-born
Grandparents responsible for own grandchildren in Palmetto
Grandparents (30 to 59 years) White / Caucasian 20 100.0% Responsible for grandchildrenBlack or African American 45 100.0% Responsible for grandchildrenOther race 211 100.0% Not responsible for grandchildrenWhite alone, not Hispanic / Latino 26 100.0% Responsible for grandchildrenHispanic or Latino 155 100.0% Not responsible for grandchildren
Grandparents (60 years and over) White / Caucasian 6 100.0% Not responsible for grandchildrenBlack or African American 34 100.0% Not responsible for grandchildrenWhite alone, not Hispanic / Latino 6 100.0% Not responsible for grandchildren