Races in Paris, Texas (TX) Detailed Stats
Data:
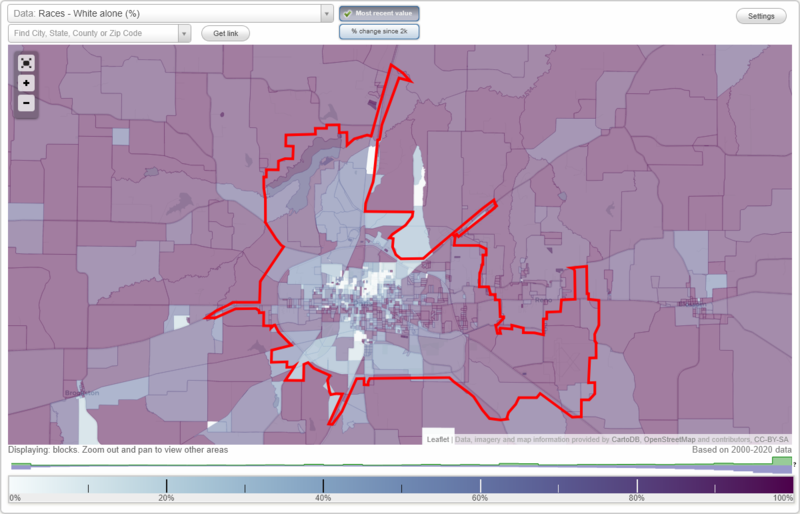
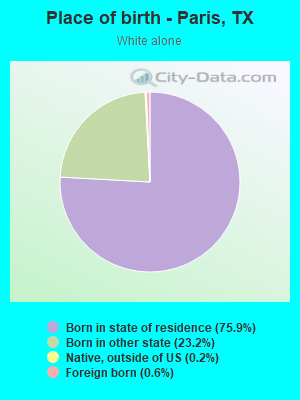
Races - White alone (%)
Races - White alone (% change since 2000)
Races - Black alone (%)
Races - Black alone (% change since 2000)
Races - American Indian alone (%)
Races - American Indian alone (% change since 2000)
Races - Asian alone (%)
Races - Asian alone (% change since 2000)
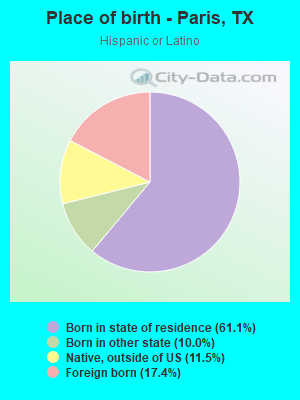
Races - Hispanic (%)
Races - Hispanic (% change since 2000)
Races - Native Hawaiian and Other Pacific Islander alone (%)
Races - Native Hawaiian and Other Pacific Islander alone (% change since 2000)
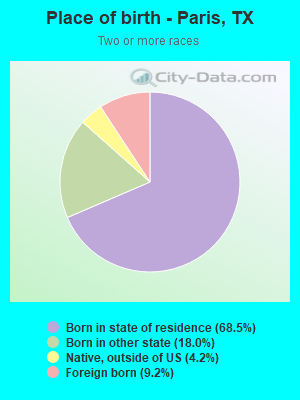
Races - Two or more races(%)
Races - Two or more races(% change since 2000)
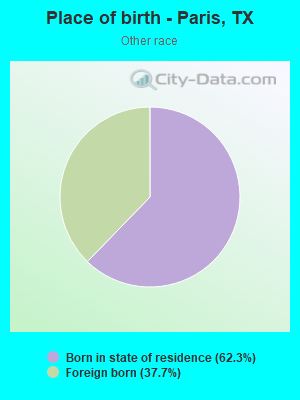
Races - Other race alone (%)
Races - Other race alone (% change since 2000)
Racial diversity
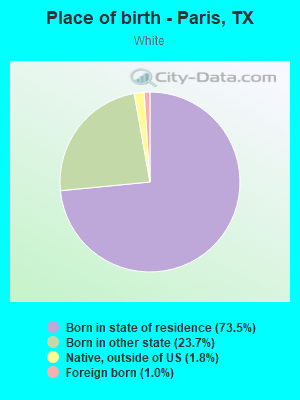
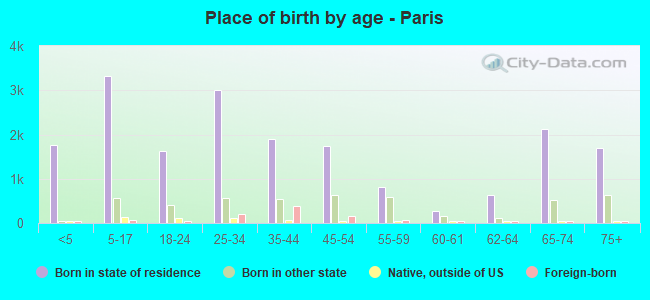
Place of birth - Born in state of residence (%)
Place of birth - Born in state of residence (%) - White
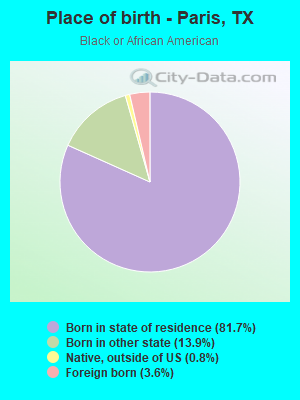
Place of birth - Born in state of residence (%) - Black or African American
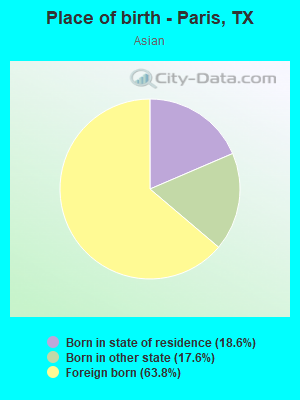
Place of birth - Born in state of residence (%) - Asian
Place of birth - Born in state of residence (%) - Hispanic or Latino
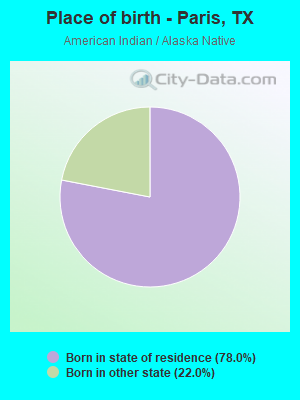
Place of birth - Born in state of residence (%) - American Indian and Alaska Native
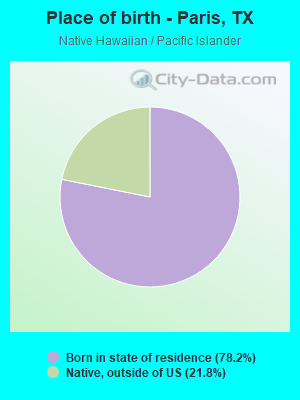
Place of birth - Born in state of residence (%) - Multirace
Place of birth - Born in state of residence (%) - Other Race
Place of birth - Born in other state (%)
Place of birth - Born in other state (%) - White
Place of birth - Born in other state (%) - Black or African American
Place of birth - Born in other state (%) - Asian
Place of birth - Born in other state (%) - Hispanic or Latino
Place of birth - Born in other state (%) - American Indian and Alaska Native
Place of birth - Born in other state (%) - Multirace
Place of birth - Born in other state (%) - Other Race
Place of birth - Native, outside of US (%)
Place of birth - Native, outside of US (%) - White
Place of birth - Native, outside of US (%) - Black or African American
Place of birth - Native, outside of US (%) - Asian
Place of birth - Native, outside of US (%) - Hispanic or Latino
Place of birth - Native, outside of US (%) - American Indian and Alaska Native
Place of birth - Native, outside of US (%) - Multirace
Place of birth - Native, outside of US (%) - Other Race
Place of birth - Foreign born (%)
Place of birth - Foreign born (%) - White
Place of birth - Foreign born (%) - Black or African American
Place of birth - Foreign born (%) - Asian
Place of birth - Foreign born (%) - Hispanic or Latino
Place of birth - Foreign born (%) - American Indian and Alaska Native
Place of birth - Foreign born (%) - Multirace
Place of birth - Foreign born (%) - Other Race
Residents speaking English at home (%)
Residents speaking English at home - Born in the United States (%)
Residents speaking English at home - Native, born elsewhere (%)
Residents speaking English at home - Foreign born (%)
Residents speaking Spanish at home (%)
Residents speaking Spanish at home - Born in the United States (%)
Residents speaking Spanish at home - Native, born elsewhere (%)
Residents speaking Spanish at home - Foreign born (%)
Residents speaking other language at home (%)
Residents speaking other language at home - Born in the United States (%)
Residents speaking other language at home - Native, born elsewhere (%)
Residents speaking other language at home - Foreign born (%)
Marital status - Never married (%)
Marital status - Now married (%)
Marital status - Separated (%)
Marital status - Widowed (%)
Marital status - Divorced (%)
Ancestries Reported - Arab (%)
Ancestries Reported - Czech (%)
Ancestries Reported - Danish (%)
Ancestries Reported - Dutch (%)
Ancestries Reported - English (%)
Ancestries Reported - French (%)
Ancestries Reported - French Canadian (%)
Ancestries Reported - German (%)
Ancestries Reported - Greek (%)
Ancestries Reported - Hungarian (%)
Ancestries Reported - Irish (%)
Ancestries Reported - Italian (%)
Ancestries Reported - Lithuanian (%)
Ancestries Reported - Norwegian (%)
Ancestries Reported - Polish (%)
Ancestries Reported - Portuguese (%)
Ancestries Reported - Russian (%)
Ancestries Reported - Scotch-Irish (%)
Ancestries Reported - Scottish (%)
Ancestries Reported - Slovak (%)
Ancestries Reported - Subsaharan African (%)
Ancestries Reported - Swedish (%)
Ancestries Reported - Swiss (%)
Ancestries Reported - Ukrainian (%)
Ancestries Reported - United States (%)
Ancestries Reported - Welsh (%)
Ancestries Reported - West Indian (%)
Ancestries Reported - Other (%)
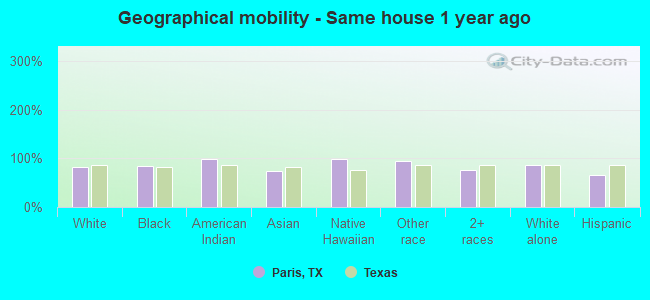
Geographical mobility - Same house 1 year ago (%)
Geographical mobility - Same house 1 year ago (%) - White
Geographical mobility - Same house 1 year ago (%) - Black or African American
Geographical mobility - Same house 1 year ago (%) - Asian
Geographical mobility - Same house 1 year ago (%) - Hispanic or Latino
Geographical mobility - Same house 1 year ago (%) - American Indian and Alaska Native
Geographical mobility - Same house 1 year ago (%) - Multirace
Geographical mobility - Same house 1 year ago (%) - Other Race
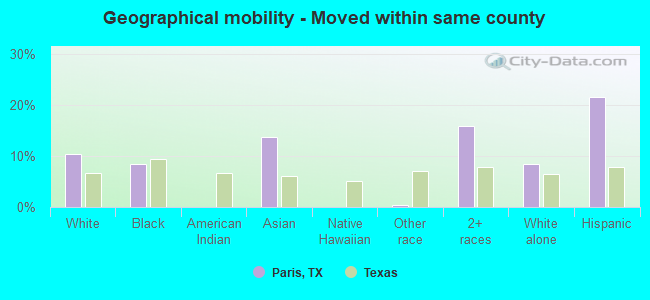
Geographical mobility - Moved within same county (%)
Geographical mobility - Moved within same county (%) - White
Geographical mobility - Moved within same county (%) - Black or African American
Geographical mobility - Moved within same county (%) - Asian
Geographical mobility - Moved within same county (%) - Hispanic or Latino
Geographical mobility - Moved within same county (%) - American Indian and Alaska Native
Geographical mobility - Moved within same county (%) - Multirace
Geographical mobility - Moved within same county (%) - Other Race
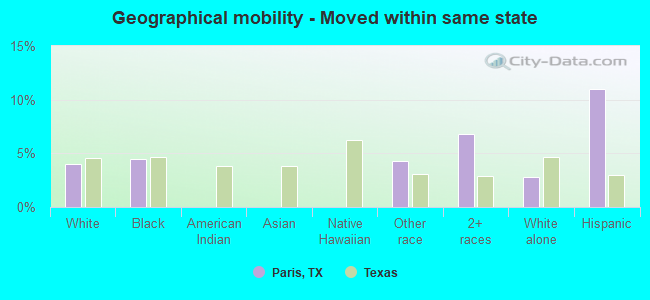
Geographical mobility - Moved from different county within same state (%)
Geographical mobility - Moved from different county within same state (%) - White
Geographical mobility - Moved from different county within same state (%) - Black or African American
Geographical mobility - Moved from different county within same state (%) - Asian
Geographical mobility - Moved from different county within same state (%) - Hispanic or Latino
Geographical mobility - Moved from different county within same state (%) - American Indian and Alaska Native
Geographical mobility - Moved from different county within same state (%) - Multirace
Geographical mobility - Moved from different county within same state (%) - Other Race
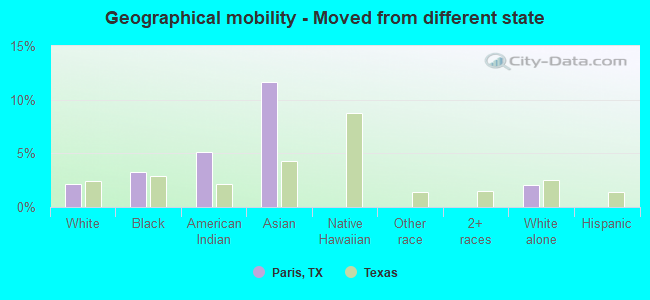
Geographical mobility - Moved from different state (%)
Geographical mobility - Moved from different state (%) - White
Geographical mobility - Moved from different state (%) - Black or African American
Geographical mobility - Moved from different state (%) - Asian
Geographical mobility - Moved from different state (%) - Hispanic or Latino
Geographical mobility - Moved from different state (%) - American Indian and Alaska Native
Geographical mobility - Moved from different state (%) - Multirace
Geographical mobility - Moved from different state (%) - Other Race
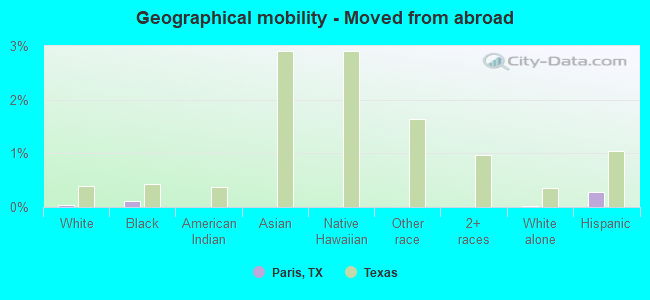
Geographical mobility - Moved from abroad (%)
Geographical mobility - Moved from abroad (%) - White
Geographical mobility - Moved from abroad (%) - Black or African American
Geographical mobility - Moved from abroad (%) - Asian
Geographical mobility - Moved from abroad (%) - Hispanic or Latino
Geographical mobility - Moved from abroad (%) - American Indian and Alaska Native
Geographical mobility - Moved from abroad (%) - Multirace
Geographical mobility - Moved from abroad (%) - Other Race
Place of birth for the foreign-born population - Ireland (%)
Place of birth for the foreign-born population - Denmark (%)
Place of birth for the foreign-born population - Norway (%)
Place of birth for the foreign-born population - Sweden (%)
Place of birth for the foreign-born population - United Kingdom (%)
Place of birth for the foreign-born population - England (%)
Place of birth for the foreign-born population - Scotland (%)
Place of birth for the foreign-born population - Other Northern Europe (%)
Place of birth for the foreign-born population - Austria (%)
Place of birth for the foreign-born population - Belgium (%)
Place of birth for the foreign-born population - France (%)
Place of birth for the foreign-born population - Germany (%)
Place of birth for the foreign-born population - Netherlands (%)
Place of birth for the foreign-born population - Switzerland (%)
Place of birth for the foreign-born population - Other Western Europe (%)
Place of birth for the foreign-born population - Greece (%)
Place of birth for the foreign-born population - Italy (%)
Place of birth for the foreign-born population - Portugal (%)
Place of birth for the foreign-born population - Spain (%)
Place of birth for the foreign-born population - Other Southern Europe (%)
Place of birth for the foreign-born population - Albania (%)
Place of birth for the foreign-born population - Belarus (%)
Place of birth for the foreign-born population - Bosnia and Herzegovina (%)
Place of birth for the foreign-born population - Bulgaria (%)
Place of birth for the foreign-born population - Croatia (%)
Place of birth for the foreign-born population - Czechoslovakia (%)
Place of birth for the foreign-born population - Hungary (%)
Place of birth for the foreign-born population - Latvia (%)
Place of birth for the foreign-born population - Lithuania (%)
Place of birth for the foreign-born population - North Macedonia (Macedonia) (%)
Place of birth for the foreign-born population - Moldova (%)
Place of birth for the foreign-born population - Poland (%)
Place of birth for the foreign-born population - Romania (%)
Place of birth for the foreign-born population - Russia (%)
Place of birth for the foreign-born population - Serbia (%)
Place of birth for the foreign-born population - Ukraine (%)
Place of birth for the foreign-born population - Other Eastern Europe (%)
Place of birth for the foreign-born population - China (%)
Place of birth for the foreign-born population - Hong Kong (%)
Place of birth for the foreign-born population - Taiwan (%)
Place of birth for the foreign-born population - Japan (%)
Place of birth for the foreign-born population - Korea (%)
Place of birth for the foreign-born population - Other Eastern Asia (%)
Place of birth for the foreign-born population - Afghanistan (%)
Place of birth for the foreign-born population - Bangladesh (%)
Place of birth for the foreign-born population - India (%)
Place of birth for the foreign-born population - Iran (%)
Place of birth for the foreign-born population - Kazakhstan (%)
Place of birth for the foreign-born population - Nepal (%)
Place of birth for the foreign-born population - Pakistan (%)
Place of birth for the foreign-born population - Sri Lanka (%)
Place of birth for the foreign-born population - Uzbekistan (%)
Place of birth for the foreign-born population - Other South Central Asia (%)
Place of birth for the foreign-born population - Burma (%)
Place of birth for the foreign-born population - Cambodia (%)
Place of birth for the foreign-born population - Indonesia (%)
Place of birth for the foreign-born population - Laos (%)
Place of birth for the foreign-born population - Malaysia (%)
Place of birth for the foreign-born population - Philippines (%)
Place of birth for the foreign-born population - Singapore (%)
Place of birth for the foreign-born population - Thailand (%)
Place of birth for the foreign-born population - Vietnam (%)
Place of birth for the foreign-born population - Other South Eastern Asia (%)
Place of birth for the foreign-born population - Armenia (%)
Place of birth for the foreign-born population - Iraq (%)
Place of birth for the foreign-born population - Israel (%)
Place of birth for the foreign-born population - Jordan (%)
Place of birth for the foreign-born population - Kuwait (%)
Place of birth for the foreign-born population - Lebanon (%)
Place of birth for the foreign-born population - Saudi Arabia (%)
Place of birth for the foreign-born population - Syria (%)
Place of birth for the foreign-born population - Turkey (%)
Place of birth for the foreign-born population - Yemen (%)
Place of birth for the foreign-born population - Other Western Asia (%)
Place of birth for the foreign-born population - Eritrea (%)
Place of birth for the foreign-born population - Ethiopia (%)
Place of birth for the foreign-born population - Kenya (%)
Place of birth for the foreign-born population - Somalia (%)
Place of birth for the foreign-born population - Uganda (%)
Place of birth for the foreign-born population - Zimbabwe (%)
Place of birth for the foreign-born population - Other Eastern Africa (%)
Place of birth for the foreign-born population - Cameroon (%)
Place of birth for the foreign-born population - Congo (%)
Place of birth for the foreign-born population - Democratic Republic of Congo (Zaire) (%)
Place of birth for the foreign-born population - Other Middle Africa (%)
Place of birth for the foreign-born population - Egypt (%)
Place of birth for the foreign-born population - Morocco (%)
Place of birth for the foreign-born population - Sudan (%)
Place of birth for the foreign-born population - Other Northern Africa (%)
Place of birth for the foreign-born population - South Africa (%)
Place of birth for the foreign-born population - Other Southern Africa (%)
Place of birth for the foreign-born population - Cabo Verde (%)
Place of birth for the foreign-born population - Ghana (%)
Place of birth for the foreign-born population - Liberia (%)
Place of birth for the foreign-born population - Nigeria (%)
Place of birth for the foreign-born population - Senegal (%)
Place of birth for the foreign-born population - Sierra Leone (%)
Place of birth for the foreign-born population - Other Western Africa (%)
Place of birth for the foreign-born population - Australia (%)
Place of birth for the foreign-born population - New Zealand (%)
Place of birth for the foreign-born population - Fiji (%)
Place of birth for the foreign-born population - Micronesia (%)
Place of birth for the foreign-born population - Bahamas (%)
Place of birth for the foreign-born population - Barbados (%)
Place of birth for the foreign-born population - Cuba (%)
Place of birth for the foreign-born population - Dominica (%)
Place of birth for the foreign-born population - Dominican Republic (%)
Place of birth for the foreign-born population - Grenada (%)
Place of birth for the foreign-born population - Haiti (%)
Place of birth for the foreign-born population - Jamaica (%)
Place of birth for the foreign-born population - St. Vincent and the Grenadines (%)
Place of birth for the foreign-born population - Trinidad and Tobago (%)
Place of birth for the foreign-born population - West Indies (%)
Place of birth for the foreign-born population - Other Caribbean (%)
Place of birth for the foreign-born population - Belize (%)
Place of birth for the foreign-born population - Costa Rica (%)
Place of birth for the foreign-born population - El Salvador (%)
Place of birth for the foreign-born population - Guatemala (%)
Place of birth for the foreign-born population - Honduras (%)
Place of birth for the foreign-born population - Mexico (%)
Place of birth for the foreign-born population - Nicaragua (%)
Place of birth for the foreign-born population - Panama (%)
Place of birth for the foreign-born population - Other Central America (%)
Place of birth for the foreign-born population - Argentina (%)
Place of birth for the foreign-born population - Bolivia (%)
Place of birth for the foreign-born population - Brazil (%)
Place of birth for the foreign-born population - Chile (%)
Place of birth for the foreign-born population - Colombia (%)
Place of birth for the foreign-born population - Ecuador (%)
Place of birth for the foreign-born population - Guyana (%)
Place of birth for the foreign-born population - Peru (%)
Place of birth for the foreign-born population - Uruguay (%)
Place of birth for the foreign-born population - Venezuela (%)
Place of birth for the foreign-born population - Other South America (%)
Place of birth for the foreign-born population - Canada (%)
Place of birth for the foreign-born population - Other Northern America (%)
Place of birth for the foreign-born population - Other (%)
Latest news about races in Paris, TX collected exclusively by city-data.com from local newspapers, TV, and radio stations
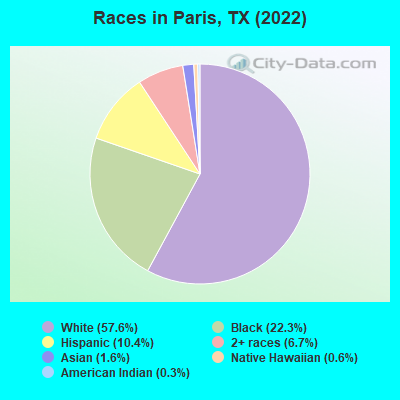
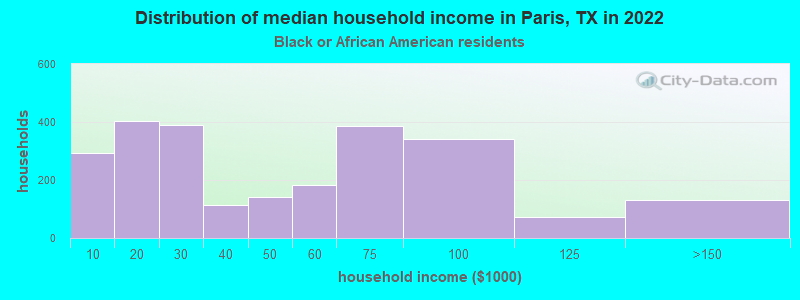
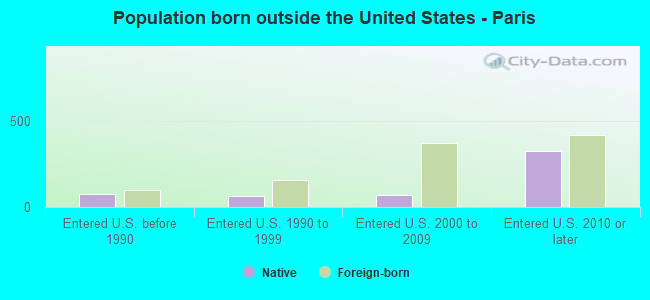
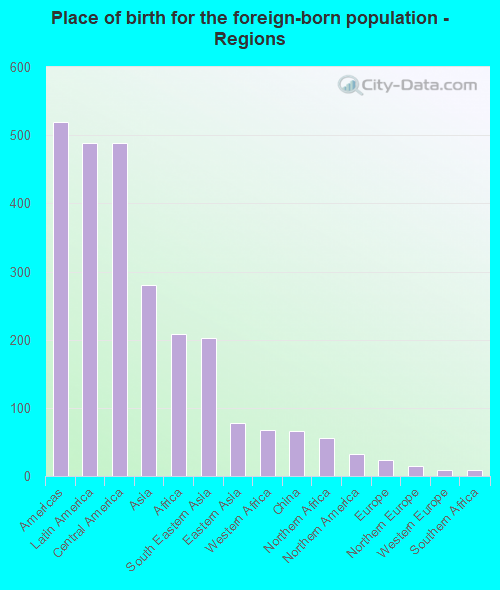
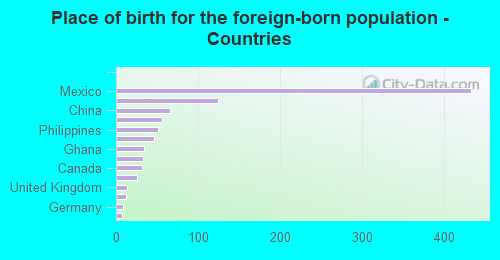
According to 2022 data, the most numerous races in Paris, TX are Hispanic (2,615 residents), White alone (14,535 residents), and Black alone (5,620 residents). 90.9% of Paris residents speak English at home. 4.1% of Paris, TX residents are foreign-born (1.9% born in Latin America, 1.1% born in Asia, 0.8% born in Africa), which is 314.9% less than the foreign-born rate of 17.0% across the entire state of Texas.
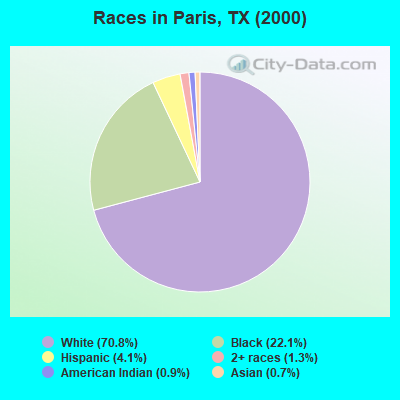
Race distribution in Paris
2000 2022
10,933,313 52.4% White alone 6,669,666 32.0% Hispanic 2,364,255 11.3% Black alone 554,445 2.7% Asian alone 230,567 1.1% Two or more races 68,859 0.3% American Indian alone 19,958 0.10% Other race alone 10,757 0.05% Native Hawaiian and Other
12,070,642 40.2% Hispanic 11,683,430 38.9% White alone 3,508,706 11.7% Black alone 1,608,173 5.4% Asian alone 956,560 3.2% Two or more races 125,763 0.4% Other race alone 47,023 0.2% American Indian alone 29,275 0.10% Native Hawaiian and Other
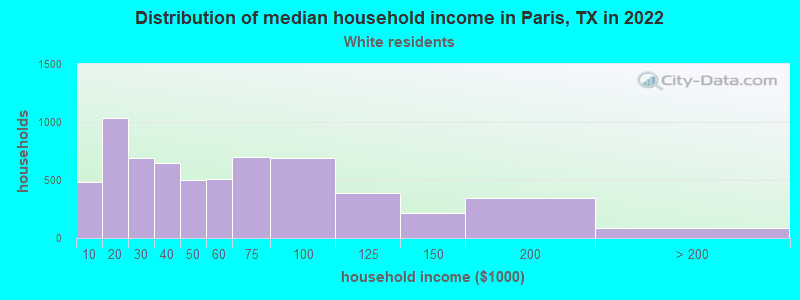
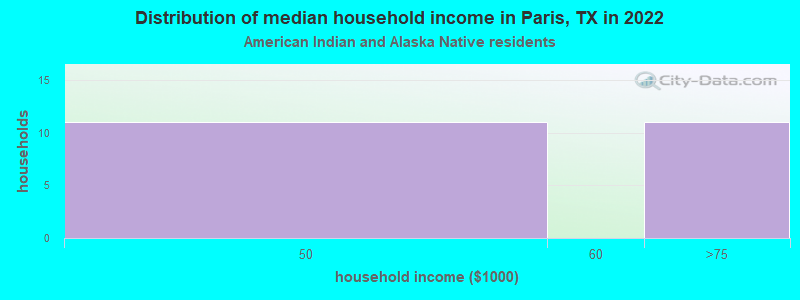
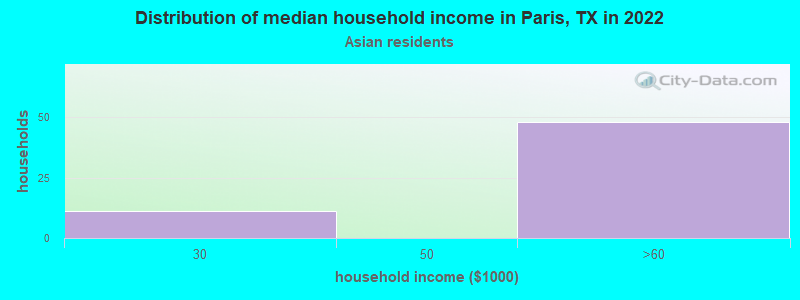
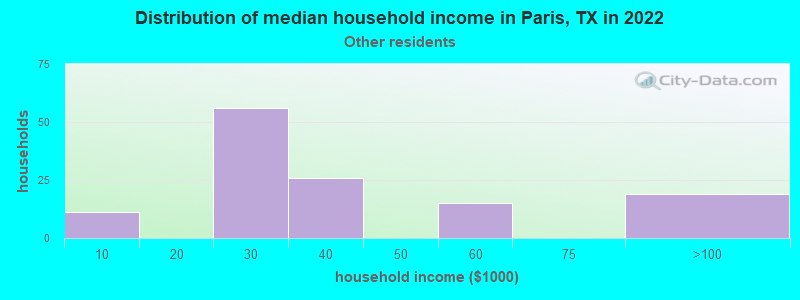
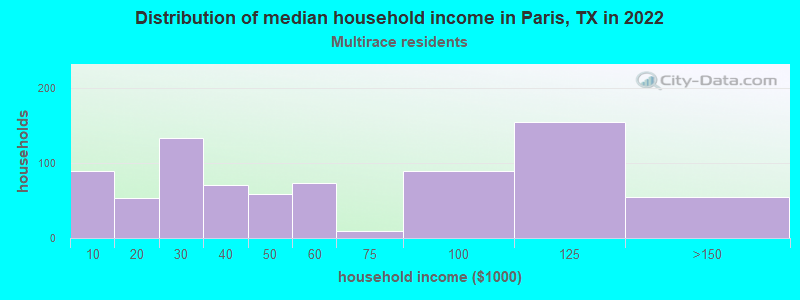
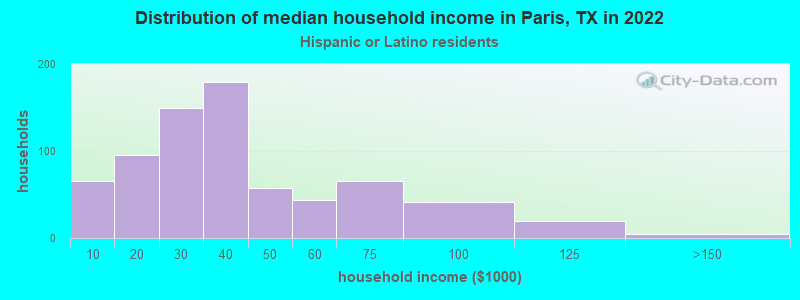
Income and house value in Paris Median household income in 2022 $44,657 White non-Hispanic householders$41,473 Black householders$28,582 Some other race householders$41,288 Two or more races householders$31,802 Hispanic or Latino race householdersMedian 2022 house value $144,384 White Non-Hispanic householders$95,744 Black or African American householders$121,600 American Indian or Alaska Native householders $140,800 Asian householders$70,400 Some other race householders$113,408 Two or more races householders$81,664 Hispanic or Latino householders
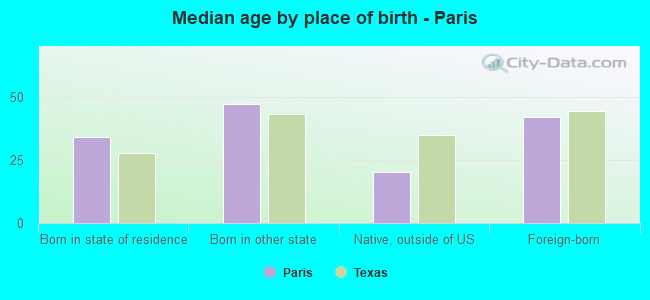
Median age by race in Paris
41.9 Median age for White residents39.3 44.3 35.3 Median age for Black or African American residents29.8 38.2 32.3 Median age for American Indian / Alaska Native residents29.3 -684,418,145.3 38.9 Median age for Asian residents20.0 39.1 7.6 Median age for Native Hawaiian / Pacific Islander residents-612,729,233.5 7.4 46.9 Median age for Other race residents46.6 47.1 22.7 Median age for Two or more races residents22.2 23.8 43.6 Median age for White alone residents41.7 45.4 20.3 Median age for Hispanic or Latino residents20.9 19.7
Owner/renter occupied households by race in Paris
House owners and renters - White residents 3,609 56.5% Owner occupied2,777 43.5% Renter occupiedHouse owners and renters - Black or African American residents 922 37.4% Owner occupied1,546 62.6% Renter occupiedHouse owners and renters - American Indian / Alaska Native residents 24 100.0% Owner occupiedHouse owners and renters - Asian residents 61 100.0% Renter occupiedHouse owners and renters - Native Hawaiian / Pacific Islander residents 20 100.0% Renter occupiedHouse owners and renters - Other race residents 75 60.6% Owner occupied49 39.4% Renter occupiedHouse owners and renters - Two or more races residents 288 36.4% Owner occupied502 63.6% Renter occupiedHouse owners and renters - White alone residents 3,950 56.7% Owner occupied3,012 43.3% Renter occupiedHouse owners and renters - Hispanic or Latino residents 228 31.4% Owner occupied498 68.6% Renter occupied
Language usage in Paris
English speakers - Total 90.9% of residents of Paris speak English at home.
6.6% of residents speak Spanish at home 1,123 72.7% Speak English very well422 27.3% Speak English less than very well2.4% of residents speak other language at home 365 63.9% Speak English very well206 36.1% Speak English less than very well
English speakers - Born in the United States 95.0% of residents of Paris speak English at home.
3.9% of residents speak Spanish at home 186 100.0% Speak English very well0.9% of residents speak other language at home 40 90.9% Speak English very well4 9.1% Speak English less than very well
English speakers - Native, born elsewhere 51.8% of residents of Paris speak English at home.
37.6% of residents speak Spanish at home 118 67.8% Speak English very well56 32.2% Speak English less than very well10.4% of residents speak other language at home 48 100.0% Speak English very well
English speakers - Foreign-born 20.4% of residents of Paris speak English at home.
39.8% of residents speak Spanish at home 122 29.8% Speak English very well287 70.2% Speak English less than very well39.8% of residents speak other language at home 222 54.3% Speak English very well187 45.7% Speak English less than very well
White (Caucasian) - Speak only English Native:
100.0% (13,101)Foreign-born:
64.4% (91)
White (Caucasian) - Speak another language Native:
3.8% (497)Foreign-born:
56.3% (79)
Black or African American - Speak only English Native:
99.5% (5,018)Foreign-born:
12.1% (25)
Black or African American - Speak another language Native:
0.5% (25)Foreign-born:
91.1% (186)
Asian - Speak only English Native:
55.8% (87)Foreign-born:
26.3% (71)
Asian - Speak another language Native:
44.4% (69)Foreign-born:
74.2% (199)
Other race - Speak another language Native:
38.4% (66)Foreign-born:
99.5% (102)
Two or more races - Speak another language Native:
12.2% (261)Foreign-born:
100.0% (264)
White alone - Speak only English Native:
99.2% (13,567)Foreign-born:
79.2% (73)
White alone - Speak another language Native:
0.9% (123)Foreign-born:
21.0% (19)
Hispanic or Latino - Speak only English Native:
42.0% (742)Foreign-born:
8.9% (40)
Hispanic or Latino - Speak another language Native:
58.0% (1,026)Foreign-born:
91.4% (411)
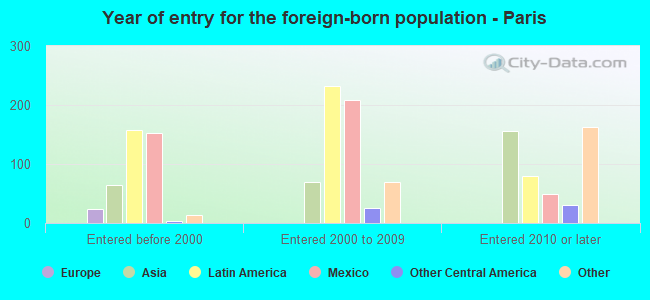
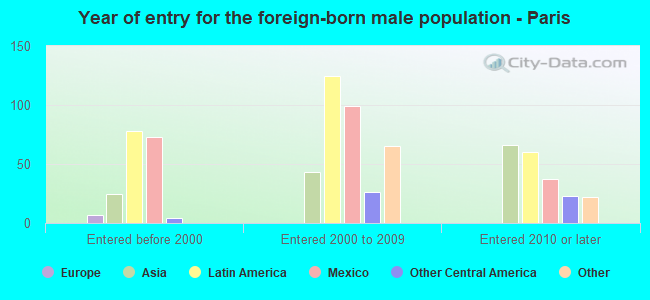
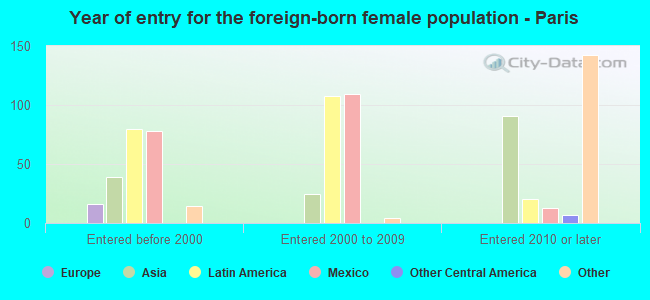
Foreign-born residents in Paris 1,034 residents are foreign born (1.9% Latin America , 1.1% Asia , 0.8% Africa ).
This city:
4.1%Texas:
17.1%
Marital status for residents in Paris Marital status - White (Caucasian) population 15 years and over
Males 30.8% Never married41.9% Now married2.8% Separated6.6% Widowed17.9% DivorcedFemales 25.1% Never married37.8% Now married1.4% Separated16.4% Widowed19.3% DivorcedWomen who gave birth in the past 12 months Now married:
56.2% (139)Unmarried:
43.8% (108)
Women who did not give birth in the past 12 months Now married:
36.3% (973)Unmarried:
63.7% (1,705)
Marital status - Black or African American population 15 years and over
Males 50.8% Never married32.3% Now married0.6% Separated3.9% Widowed12.3% DivorcedFemales 42.8% Never married25.8% Now married2.0% Separated14.3% Widowed15.2% DivorcedWomen who gave birth in the past 12 months Now married:
0.0% (0)Unmarried:
100.0% (9)
Women who did not give birth in the past 12 months Now married:
24.9% (342)Unmarried:
75.1% (1,028)
Marital status - American Indian / Alaska Native population 15 years and over
Males 14.9% Never married85.1% Now married0.0% Separated0.0% Widowed0.0% DivorcedFemales 0.0% Never married56.2% Now married0.0% Separated0.0% Widowed43.8% DivorcedWomen who did not give birth in the past 12 months Now married:
56.2% (13)Unmarried:
43.8% (10)
Marital status - Asian population 15 years and over
Males 37.1% Never married62.9% Now married0.0% Separated0.0% Widowed0.0% DivorcedFemales 40.7% Never married54.4% Now married0.0% Separated5.0% Widowed0.0% DivorcedWomen who did not give birth in the past 12 months Now married:
53.8% (123)Unmarried:
46.2% (105)
Marital status - Native Hawaiian / Pacific Islander population 15 years and over
Males 0.0% Never married100.0% Now married0.0% Separated0.0% Widowed0.0% DivorcedFemales 0.0% Never married100.0% Now married0.0% Separated0.0% Widowed0.0% DivorcedWomen who did not give birth in the past 12 months Now married:
100.0% (23)Unmarried:
0.0% (0)
Marital status - Other race population 15 years and over
Males 27.2% Never married36.8% Now married0.0% Separated0.0% Widowed36.0% DivorcedFemales 2.3% Never married31.8% Now married0.0% Separated25.0% Widowed40.9% DivorcedWomen who did not give birth in the past 12 months Now married:
43.8% (19)Unmarried:
56.2% (25)
Marital status - Two or more races population 15 years and over
Males 50.2% Never married35.9% Now married5.1% Separated3.7% Widowed5.1% DivorcedFemales 49.5% Never married38.1% Now married1.0% Separated9.1% Widowed2.2% DivorcedWomen who gave birth in the past 12 months Now married:
43.2% (67)Unmarried:
56.8% (88)
Women who did not give birth in the past 12 months Now married:
36.2% (227)Unmarried:
63.8% (399)
Marital status - White alone, not Hispanic / Latino population 15 years and over
Males 27.9% Never married43.6% Now married3.0% Separated7.1% Widowed18.4% DivorcedFemales 21.9% Never married38.1% Now married1.5% Separated17.7% Widowed20.8% DivorcedWomen who gave birth in the past 12 months Now married:
56.2% (171)Unmarried:
43.8% (133)
Women who did not give birth in the past 12 months Now married:
37.4% (1,031)Unmarried:
62.6% (1,724)
Marital status - Hispanic or Latino population 15 years and over
Males 60.0% Never married25.3% Now married0.0% Separated2.2% Widowed12.4% DivorcedFemales 54.1% Never married38.6% Now married0.0% Separated2.6% Widowed4.7% DivorcedWomen who did not give birth in the past 12 months Now married:
36.0% (239)Unmarried:
64.0% (425)
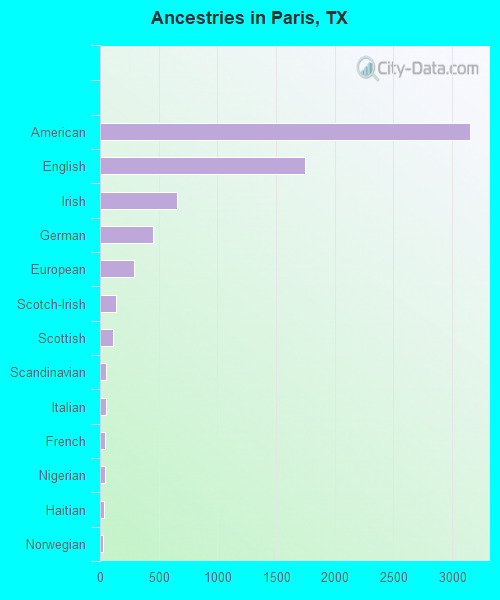
Ancestries in Paris
3,157 23.9% American1,750 13.2% English656 5.0% Irish448 3.4% German292 2.2% European136 1.0% Scotch-Irish114 0.9% Scottish55 0.4% Scandinavian50 0.4% Italian44 0.3% French42 0.3% Nigerian34 0.3% Haitian29 0.2% Norwegian24 0.2% African9 0.07% Croatian8 0.06% Polish7 0.05% Welsh6 0.05% Australian6 0.05% British3 0.02% French Canadian3 0.02% Dutch West Indian2 0.02% Greek
Geographical mobility in Paris Same house 1 year ago 11,056 82.8% White (Caucasian)4,759 84.0% Black or African American122 97.8% American Indian / Alaska Native313 74.4% Asian146 98.2% Native Hawaiian / Pacific Islander261 95.4% Other race2,232 76.5% Two or more races12,377 86.3% White alone, not Hispanic / Latino1,721 65.9% Hispanic or LatinoMoved within same county 1,396 10.5% White / Caucasian472 8.3% Black or African American57 13.6% Asian1 0.4% Other race462 15.8% Two or more races1,217 8.5% White alone, not Hispanic / Latino564 21.6% Hispanic or LatinoMoved within same state 537 4.0% White / Caucasian256 4.5% Black or African American12 4.3% Other race199 6.8% Two or more races403 2.8% White alone, not Hispanic / Latino286 11.0% Hispanic or LatinoMoved from different state 287 2.1% White / Caucasian184 3.3% Black or African American6 5.1% American Indian / Alaska Native49 11.7% Asian297 2.1% White alone, not Hispanic / LatinoMoved from abroad 6 0.0% White7 0.1% Black or African American3 0.0% White alone, not Hispanic / Latino7 0.3% Hispanic or Latino
Children Nativity (place of birth) in Paris
Children under 6 years - Living with two parents Both parents native 871 100.0% NativeBoth parents foreign-born 19 100.0% NativeOne native, one foreign-born parent 107 100.0% NativeChildren under 6 years - Living with one parent Native parent 1,314 100.0% NativeForeign-born parent 71 100.0% NativeChildren 6 to 17 years - Living with two parents Both parents native 1,019 100.0% NativeBoth parents foreign-born 84 100.0% NativeOne native, one foreign-born parent 61 48.6% Native65 51.4% Foreign-bornChildren 6 to 17 years - Living with one parent Native parent 1,887 100.0% NativeForeign-born parent 307 50.5% Native302 49.5% Foreign-born
Grandparents responsible for own grandchildren in Paris
Grandparents (30 to 59 years) White / Caucasian 99 50.6% Responsible for grandchildren96 49.4% Not responsible for grandchildrenBlack or African American 39 72.6% Responsible for grandchildren15 27.4% Not responsible for grandchildrenTwo or more races 44 100.0% Responsible for grandchildrenWhite alone, not Hispanic / Latino 129 46.1% Responsible for grandchildren151 53.9% Not responsible for grandchildrenHispanic or Latino 9 100.0% Responsible for grandchildrenGrandparents (60 years and over) White / Caucasian 27 30.8% Responsible for grandchildren61 69.2% Not responsible for grandchildrenBlack or African American 38 33.9% Responsible for grandchildren74 66.1% Not responsible for grandchildrenWhite alone, not Hispanic / Latino 26 23.6% Responsible for grandchildren83 76.4% Not responsible for grandchildrenHispanic or Latino 7 100.0% Responsible for grandchildren