Races in Pataskala, Ohio (OH) Detailed Stats
Data:
Races - White alone (%)
Races - White alone (% change since 2000)
Races - Black alone (%)
Races - Black alone (% change since 2000)
Races - American Indian alone (%)
Races - American Indian alone (% change since 2000)
Races - Asian alone (%)
Races - Asian alone (% change since 2000)
Races - Hispanic (%)
Races - Hispanic (% change since 2000)
Races - Native Hawaiian and Other Pacific Islander alone (%)
Races - Native Hawaiian and Other Pacific Islander alone (% change since 2000)
Races - Two or more races(%)
Races - Two or more races(% change since 2000)
Races - Other race alone (%)
Races - Other race alone (% change since 2000)
Racial diversity
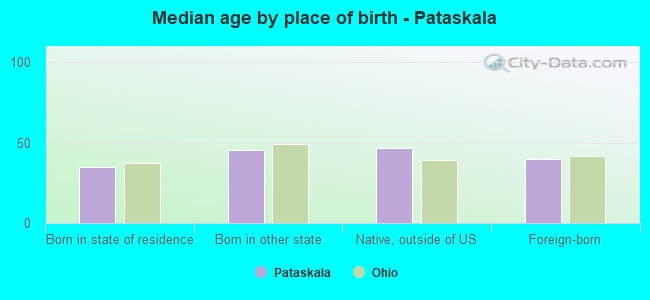
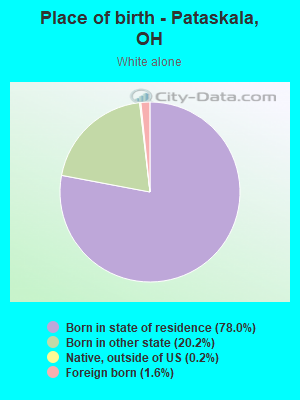
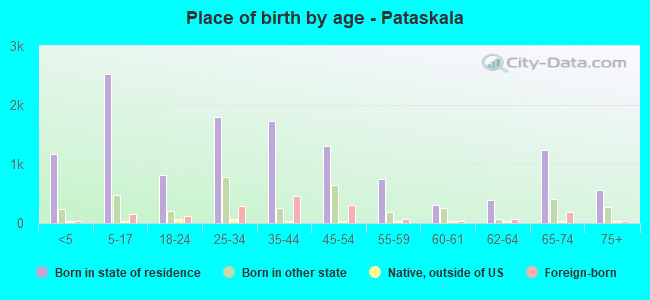
Place of birth - Born in state of residence (%)
Place of birth - Born in state of residence (%) - White
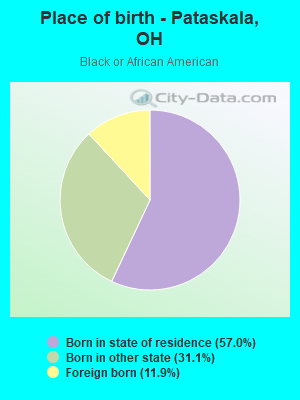
Place of birth - Born in state of residence (%) - Black or African American
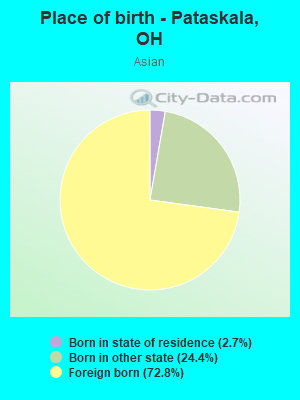
Place of birth - Born in state of residence (%) - Asian
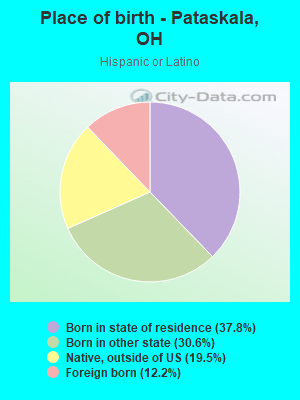
Place of birth - Born in state of residence (%) - Hispanic or Latino
Place of birth - Born in state of residence (%) - American Indian and Alaska Native
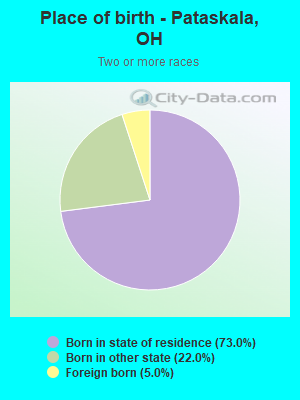
Place of birth - Born in state of residence (%) - Multirace
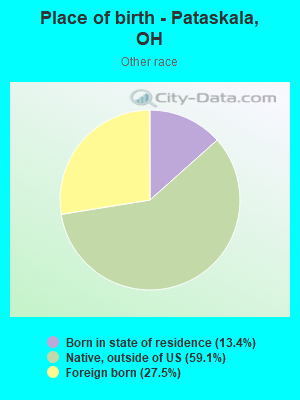
Place of birth - Born in state of residence (%) - Other Race
Place of birth - Born in other state (%)
Place of birth - Born in other state (%) - White
Place of birth - Born in other state (%) - Black or African American
Place of birth - Born in other state (%) - Asian
Place of birth - Born in other state (%) - Hispanic or Latino
Place of birth - Born in other state (%) - American Indian and Alaska Native
Place of birth - Born in other state (%) - Multirace
Place of birth - Born in other state (%) - Other Race
Place of birth - Native, outside of US (%)
Place of birth - Native, outside of US (%) - White
Place of birth - Native, outside of US (%) - Black or African American
Place of birth - Native, outside of US (%) - Asian
Place of birth - Native, outside of US (%) - Hispanic or Latino
Place of birth - Native, outside of US (%) - American Indian and Alaska Native
Place of birth - Native, outside of US (%) - Multirace
Place of birth - Native, outside of US (%) - Other Race
Place of birth - Foreign born (%)
Place of birth - Foreign born (%) - White
Place of birth - Foreign born (%) - Black or African American
Place of birth - Foreign born (%) - Asian
Place of birth - Foreign born (%) - Hispanic or Latino
Place of birth - Foreign born (%) - American Indian and Alaska Native
Place of birth - Foreign born (%) - Multirace
Place of birth - Foreign born (%) - Other Race
Residents speaking English at home (%)
Residents speaking English at home - Born in the United States (%)
Residents speaking English at home - Native, born elsewhere (%)
Residents speaking English at home - Foreign born (%)
Residents speaking Spanish at home (%)
Residents speaking Spanish at home - Born in the United States (%)
Residents speaking Spanish at home - Native, born elsewhere (%)
Residents speaking Spanish at home - Foreign born (%)
Residents speaking other language at home (%)
Residents speaking other language at home - Born in the United States (%)
Residents speaking other language at home - Native, born elsewhere (%)
Residents speaking other language at home - Foreign born (%)
Marital status - Never married (%)
Marital status - Now married (%)
Marital status - Separated (%)
Marital status - Widowed (%)
Marital status - Divorced (%)
Ancestries Reported - Arab (%)
Ancestries Reported - Czech (%)
Ancestries Reported - Danish (%)
Ancestries Reported - Dutch (%)
Ancestries Reported - English (%)
Ancestries Reported - French (%)
Ancestries Reported - French Canadian (%)
Ancestries Reported - German (%)
Ancestries Reported - Greek (%)
Ancestries Reported - Hungarian (%)
Ancestries Reported - Irish (%)
Ancestries Reported - Italian (%)
Ancestries Reported - Lithuanian (%)
Ancestries Reported - Norwegian (%)
Ancestries Reported - Polish (%)
Ancestries Reported - Portuguese (%)
Ancestries Reported - Russian (%)
Ancestries Reported - Scotch-Irish (%)
Ancestries Reported - Scottish (%)
Ancestries Reported - Slovak (%)
Ancestries Reported - Subsaharan African (%)
Ancestries Reported - Swedish (%)
Ancestries Reported - Swiss (%)
Ancestries Reported - Ukrainian (%)
Ancestries Reported - United States (%)
Ancestries Reported - Welsh (%)
Ancestries Reported - West Indian (%)
Ancestries Reported - Other (%)
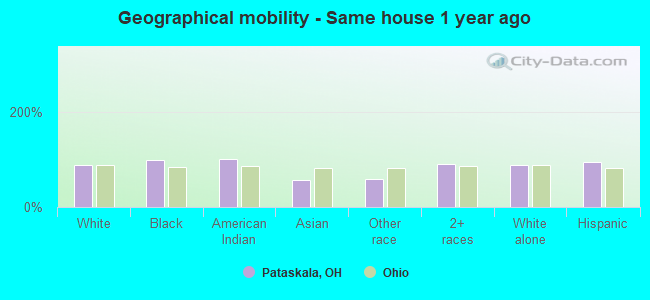
Geographical mobility - Same house 1 year ago (%)
Geographical mobility - Same house 1 year ago (%) - White
Geographical mobility - Same house 1 year ago (%) - Black or African American
Geographical mobility - Same house 1 year ago (%) - Asian
Geographical mobility - Same house 1 year ago (%) - Hispanic or Latino
Geographical mobility - Same house 1 year ago (%) - American Indian and Alaska Native
Geographical mobility - Same house 1 year ago (%) - Multirace
Geographical mobility - Same house 1 year ago (%) - Other Race
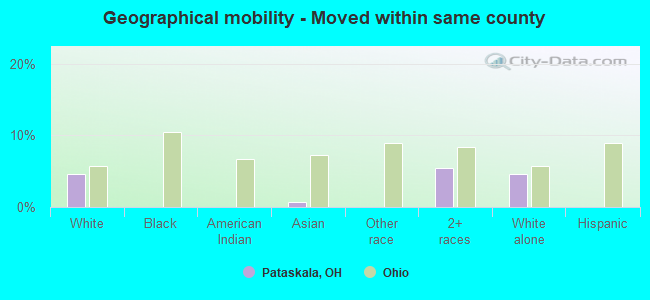
Geographical mobility - Moved within same county (%)
Geographical mobility - Moved within same county (%) - White
Geographical mobility - Moved within same county (%) - Black or African American
Geographical mobility - Moved within same county (%) - Asian
Geographical mobility - Moved within same county (%) - Hispanic or Latino
Geographical mobility - Moved within same county (%) - American Indian and Alaska Native
Geographical mobility - Moved within same county (%) - Multirace
Geographical mobility - Moved within same county (%) - Other Race
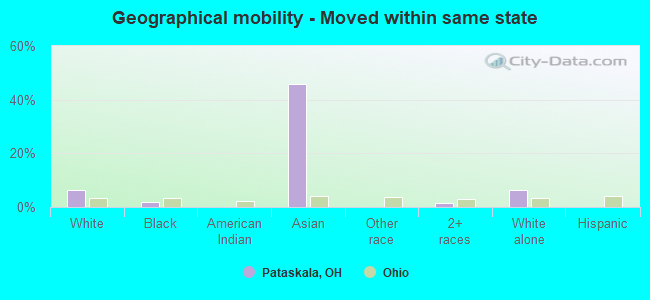
Geographical mobility - Moved from different county within same state (%)
Geographical mobility - Moved from different county within same state (%) - White
Geographical mobility - Moved from different county within same state (%) - Black or African American
Geographical mobility - Moved from different county within same state (%) - Asian
Geographical mobility - Moved from different county within same state (%) - Hispanic or Latino
Geographical mobility - Moved from different county within same state (%) - American Indian and Alaska Native
Geographical mobility - Moved from different county within same state (%) - Multirace
Geographical mobility - Moved from different county within same state (%) - Other Race
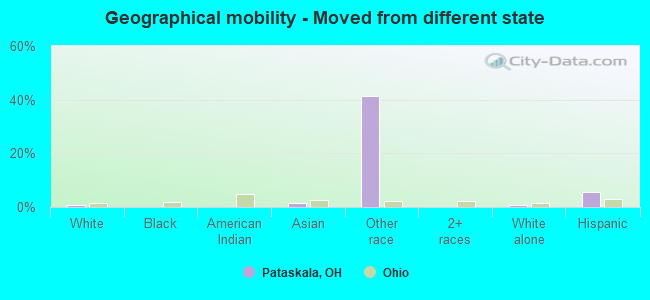
Geographical mobility - Moved from different state (%)
Geographical mobility - Moved from different state (%) - White
Geographical mobility - Moved from different state (%) - Black or African American
Geographical mobility - Moved from different state (%) - Asian
Geographical mobility - Moved from different state (%) - Hispanic or Latino
Geographical mobility - Moved from different state (%) - American Indian and Alaska Native
Geographical mobility - Moved from different state (%) - Multirace
Geographical mobility - Moved from different state (%) - Other Race
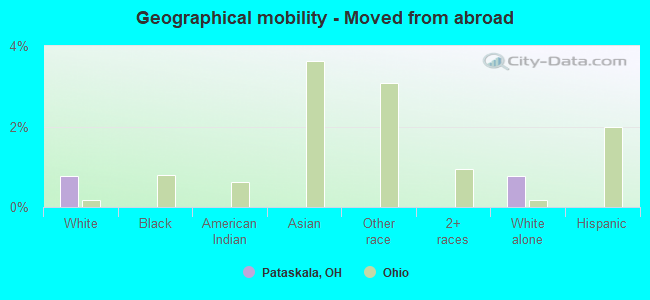
Geographical mobility - Moved from abroad (%)
Geographical mobility - Moved from abroad (%) - White
Geographical mobility - Moved from abroad (%) - Black or African American
Geographical mobility - Moved from abroad (%) - Asian
Geographical mobility - Moved from abroad (%) - Hispanic or Latino
Geographical mobility - Moved from abroad (%) - American Indian and Alaska Native
Geographical mobility - Moved from abroad (%) - Multirace
Geographical mobility - Moved from abroad (%) - Other Race
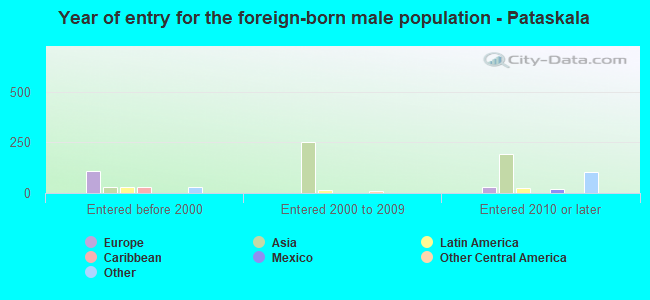
Place of birth for the foreign-born population - Ireland (%)
Place of birth for the foreign-born population - Denmark (%)
Place of birth for the foreign-born population - Norway (%)
Place of birth for the foreign-born population - Sweden (%)
Place of birth for the foreign-born population - United Kingdom (%)
Place of birth for the foreign-born population - England (%)
Place of birth for the foreign-born population - Scotland (%)
Place of birth for the foreign-born population - Other Northern Europe (%)
Place of birth for the foreign-born population - Austria (%)
Place of birth for the foreign-born population - Belgium (%)
Place of birth for the foreign-born population - France (%)
Place of birth for the foreign-born population - Germany (%)
Place of birth for the foreign-born population - Netherlands (%)
Place of birth for the foreign-born population - Switzerland (%)
Place of birth for the foreign-born population - Other Western Europe (%)
Place of birth for the foreign-born population - Greece (%)
Place of birth for the foreign-born population - Italy (%)
Place of birth for the foreign-born population - Portugal (%)
Place of birth for the foreign-born population - Spain (%)
Place of birth for the foreign-born population - Other Southern Europe (%)
Place of birth for the foreign-born population - Albania (%)
Place of birth for the foreign-born population - Belarus (%)
Place of birth for the foreign-born population - Bosnia and Herzegovina (%)
Place of birth for the foreign-born population - Bulgaria (%)
Place of birth for the foreign-born population - Croatia (%)
Place of birth for the foreign-born population - Czechoslovakia (%)
Place of birth for the foreign-born population - Hungary (%)
Place of birth for the foreign-born population - Latvia (%)
Place of birth for the foreign-born population - Lithuania (%)
Place of birth for the foreign-born population - North Macedonia (Macedonia) (%)
Place of birth for the foreign-born population - Moldova (%)
Place of birth for the foreign-born population - Poland (%)
Place of birth for the foreign-born population - Romania (%)
Place of birth for the foreign-born population - Russia (%)
Place of birth for the foreign-born population - Serbia (%)
Place of birth for the foreign-born population - Ukraine (%)
Place of birth for the foreign-born population - Other Eastern Europe (%)
Place of birth for the foreign-born population - China (%)
Place of birth for the foreign-born population - Hong Kong (%)
Place of birth for the foreign-born population - Taiwan (%)
Place of birth for the foreign-born population - Japan (%)
Place of birth for the foreign-born population - Korea (%)
Place of birth for the foreign-born population - Other Eastern Asia (%)
Place of birth for the foreign-born population - Afghanistan (%)
Place of birth for the foreign-born population - Bangladesh (%)
Place of birth for the foreign-born population - India (%)
Place of birth for the foreign-born population - Iran (%)
Place of birth for the foreign-born population - Kazakhstan (%)
Place of birth for the foreign-born population - Nepal (%)
Place of birth for the foreign-born population - Pakistan (%)
Place of birth for the foreign-born population - Sri Lanka (%)
Place of birth for the foreign-born population - Uzbekistan (%)
Place of birth for the foreign-born population - Other South Central Asia (%)
Place of birth for the foreign-born population - Burma (%)
Place of birth for the foreign-born population - Cambodia (%)
Place of birth for the foreign-born population - Indonesia (%)
Place of birth for the foreign-born population - Laos (%)
Place of birth for the foreign-born population - Malaysia (%)
Place of birth for the foreign-born population - Philippines (%)
Place of birth for the foreign-born population - Singapore (%)
Place of birth for the foreign-born population - Thailand (%)
Place of birth for the foreign-born population - Vietnam (%)
Place of birth for the foreign-born population - Other South Eastern Asia (%)
Place of birth for the foreign-born population - Armenia (%)
Place of birth for the foreign-born population - Iraq (%)
Place of birth for the foreign-born population - Israel (%)
Place of birth for the foreign-born population - Jordan (%)
Place of birth for the foreign-born population - Kuwait (%)
Place of birth for the foreign-born population - Lebanon (%)
Place of birth for the foreign-born population - Saudi Arabia (%)
Place of birth for the foreign-born population - Syria (%)
Place of birth for the foreign-born population - Turkey (%)
Place of birth for the foreign-born population - Yemen (%)
Place of birth for the foreign-born population - Other Western Asia (%)
Place of birth for the foreign-born population - Eritrea (%)
Place of birth for the foreign-born population - Ethiopia (%)
Place of birth for the foreign-born population - Kenya (%)
Place of birth for the foreign-born population - Somalia (%)
Place of birth for the foreign-born population - Uganda (%)
Place of birth for the foreign-born population - Zimbabwe (%)
Place of birth for the foreign-born population - Other Eastern Africa (%)
Place of birth for the foreign-born population - Cameroon (%)
Place of birth for the foreign-born population - Congo (%)
Place of birth for the foreign-born population - Democratic Republic of Congo (Zaire) (%)
Place of birth for the foreign-born population - Other Middle Africa (%)
Place of birth for the foreign-born population - Egypt (%)
Place of birth for the foreign-born population - Morocco (%)
Place of birth for the foreign-born population - Sudan (%)
Place of birth for the foreign-born population - Other Northern Africa (%)
Place of birth for the foreign-born population - South Africa (%)
Place of birth for the foreign-born population - Other Southern Africa (%)
Place of birth for the foreign-born population - Cabo Verde (%)
Place of birth for the foreign-born population - Ghana (%)
Place of birth for the foreign-born population - Liberia (%)
Place of birth for the foreign-born population - Nigeria (%)
Place of birth for the foreign-born population - Senegal (%)
Place of birth for the foreign-born population - Sierra Leone (%)
Place of birth for the foreign-born population - Other Western Africa (%)
Place of birth for the foreign-born population - Australia (%)
Place of birth for the foreign-born population - New Zealand (%)
Place of birth for the foreign-born population - Fiji (%)
Place of birth for the foreign-born population - Micronesia (%)
Place of birth for the foreign-born population - Bahamas (%)
Place of birth for the foreign-born population - Barbados (%)
Place of birth for the foreign-born population - Cuba (%)
Place of birth for the foreign-born population - Dominica (%)
Place of birth for the foreign-born population - Dominican Republic (%)
Place of birth for the foreign-born population - Grenada (%)
Place of birth for the foreign-born population - Haiti (%)
Place of birth for the foreign-born population - Jamaica (%)
Place of birth for the foreign-born population - St. Vincent and the Grenadines (%)
Place of birth for the foreign-born population - Trinidad and Tobago (%)
Place of birth for the foreign-born population - West Indies (%)
Place of birth for the foreign-born population - Other Caribbean (%)
Place of birth for the foreign-born population - Belize (%)
Place of birth for the foreign-born population - Costa Rica (%)
Place of birth for the foreign-born population - El Salvador (%)
Place of birth for the foreign-born population - Guatemala (%)
Place of birth for the foreign-born population - Honduras (%)
Place of birth for the foreign-born population - Mexico (%)
Place of birth for the foreign-born population - Nicaragua (%)
Place of birth for the foreign-born population - Panama (%)
Place of birth for the foreign-born population - Other Central America (%)
Place of birth for the foreign-born population - Argentina (%)
Place of birth for the foreign-born population - Bolivia (%)
Place of birth for the foreign-born population - Brazil (%)
Place of birth for the foreign-born population - Chile (%)
Place of birth for the foreign-born population - Colombia (%)
Place of birth for the foreign-born population - Ecuador (%)
Place of birth for the foreign-born population - Guyana (%)
Place of birth for the foreign-born population - Peru (%)
Place of birth for the foreign-born population - Uruguay (%)
Place of birth for the foreign-born population - Venezuela (%)
Place of birth for the foreign-born population - Other South America (%)
Place of birth for the foreign-born population - Canada (%)
Place of birth for the foreign-born population - Other Northern America (%)
Place of birth for the foreign-born population - Other (%)
Latest news about races in Pataskala, OH collected exclusively by city-data.com from local newspapers, TV, and radio stations
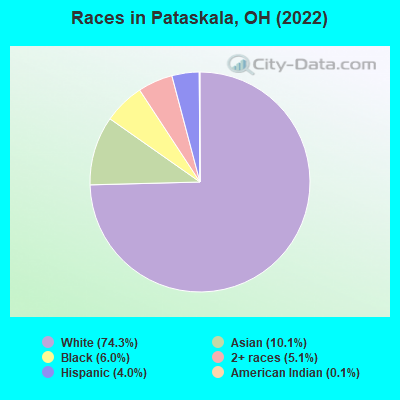
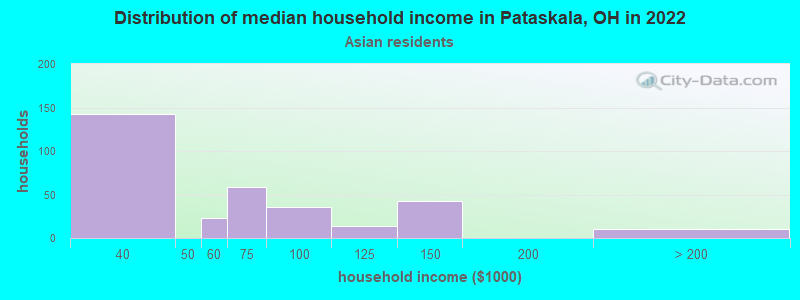
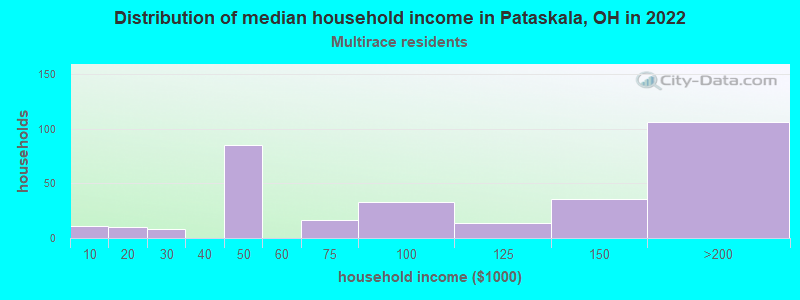
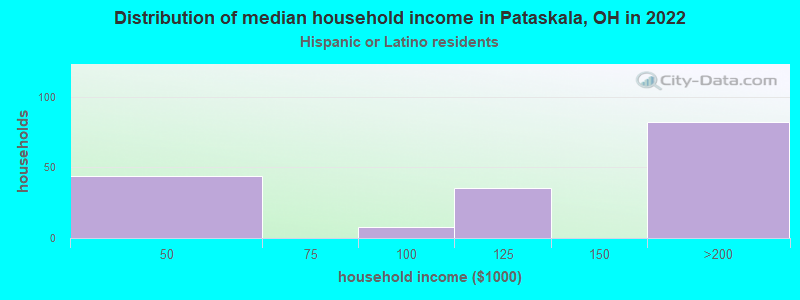
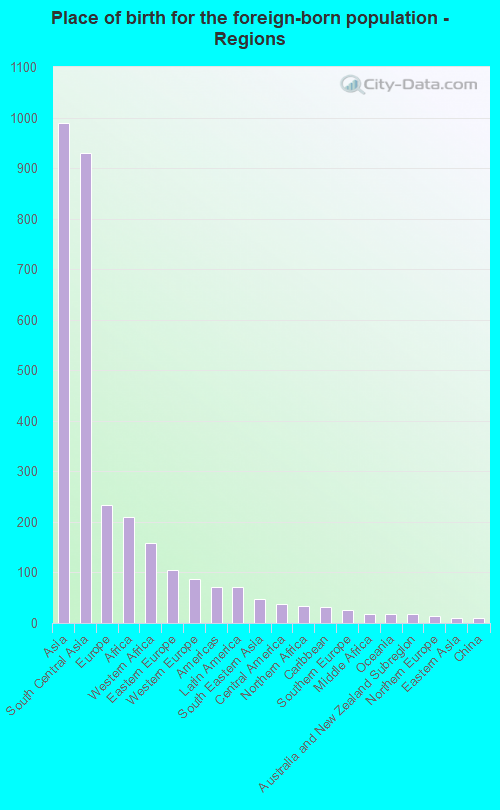
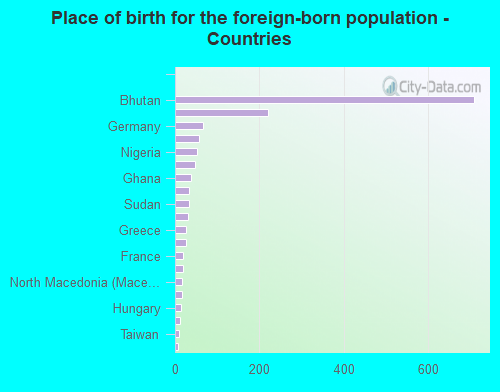
According to 2022 data, the most numerous races in Pataskala, OH are White alone (13,449 residents), Black alone (1,093 residents), and Two or more races (914 residents). 88.4% of Pataskala residents speak English at home. 8.4% of Pataskala, OH residents are foreign-born (5.4% born in Asia, 1.3% born in Europe, 1.1% born in Africa), which is 52.4% greater than the foreign-born rate of 4.0% across the entire state of Ohio.
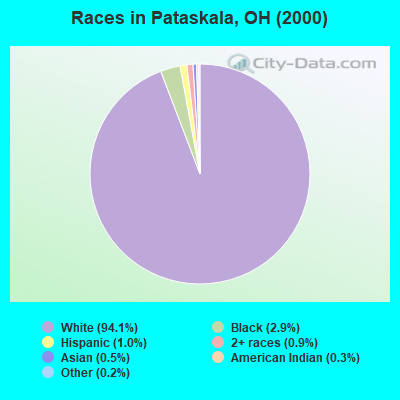
Race distribution in Pataskala
2000 2022
9,538,111 84.0% White alone 1,290,662 11.4% Black alone 217,123 1.9% Hispanic 137,770 1.2% Two or more races 131,670 1.2% Asian alone 21,985 0.2% American Indian alone 13,483 0.1% Other race alone 2,336 0.02% Native Hawaiian and Other
8,948,793 76.1% White alone 1,401,403 11.9% Black alone 529,291 4.5% Two or more races 517,232 4.4% Hispanic 293,387 2.5% Asian alone 52,805 0.4% Other race alone 9,785 0.08% American Indian alone 3,362 0.03% Native Hawaiian and Other
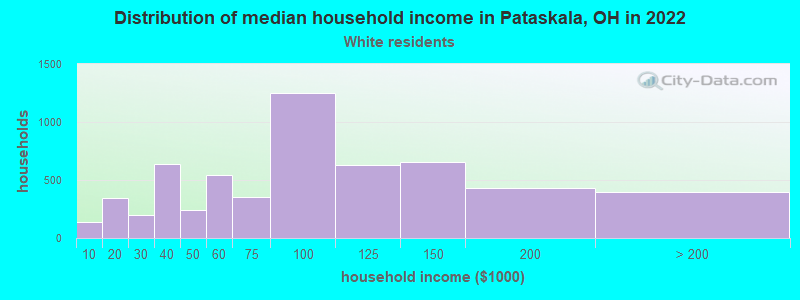
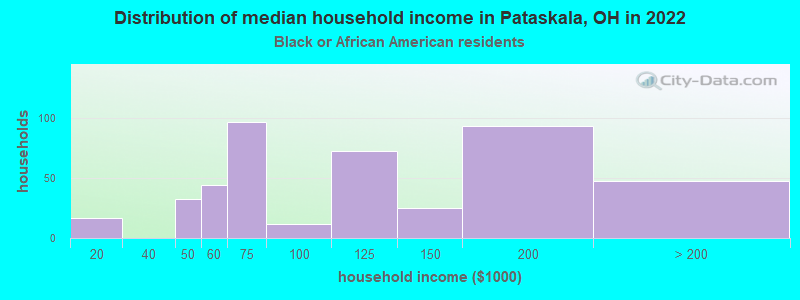
Income and house value in Pataskala Median household income in 2022 $84,513 White non-Hispanic householders$104,187 Black householders$51,158 Asian householders$107,472 Hispanic or Latino race householdersMedian 2022 house value $279,795 White Non-Hispanic householders$247,374 Black or African American householders$245,689 American Indian or Alaska Native householders $267,585 Asian householders$372,850 Two or more races householders
Median age by race in Pataskala
40.1 Median age for White residents38.4 41.4 22.4 Median age for Black or African American residents22.8 25.6 -1,223,844,281.0 Median age for American Indian / Alaska Native residents-1,464,337,698.7 -658,163,264.6 36.9 Median age for Asian residents40.4 27.7 -666,666,666.0 Median age for Native Hawaiian / Pacific Islander residents-666,666,666.0 -666,666,666.0 28.3 Median age for Other race residents-368,368,368.0 29.7 22.6 Median age for Two or more races residents21.2 26.4 40.3 Median age for White alone residents39.4 41.3 22.0 Median age for Hispanic or Latino residents16.2 18.4
Owner/renter occupied households by race in Pataskala
House owners and renters - White residents 4,187 72.5% Owner occupied1,585 27.5% Renter occupiedHouse owners and renters - Black or African American residents 214 65.0% Owner occupied115 35.0% Renter occupiedHouse owners and renters - Asian residents 499 100.0% Owner occupiedHouse owners and renters - Other race residents 11 100.0% Owner occupiedHouse owners and renters - Two or more races residents 319 88.1% Owner occupied43 11.9% Renter occupiedHouse owners and renters - White alone residents 4,160 72.6% Owner occupied1,568 27.4% Renter occupiedHouse owners and renters - Hispanic or Latino residents 211 100.0% Owner occupied
Language usage in Pataskala
English speakers - Total 88.4% of residents of Pataskala speak English at home.
1.3% of residents speak Spanish at home 90 42.1% Speak English very well124 57.9% Speak English less than very well12.3% of residents speak other language at home 1,104 53.9% Speak English very well945 46.1% Speak English less than very well
English speakers - Born in the United States 95.8% of residents of Pataskala speak English at home.
0.3% of residents speak Spanish at home 10 100.0% Speak English very well2.7% of residents speak other language at home 47 49.5% Speak English very well48 50.5% Speak English less than very well
English speakers - Native, born elsewhere 46.6% of residents of Pataskala speak English at home.
76.3% of residents speak Spanish at home 35 38.9% Speak English very well55 61.1% Speak English less than very well
English speakers - Foreign-born 13.9% of residents of Pataskala speak English at home.
4.2% of residents speak Spanish at home 44 58.7% Speak English very well31 41.3% Speak English less than very well77.7% of residents speak other language at home 583 42.2% Speak English very well799 57.8% Speak English less than very well
White (Caucasian) - Speak only English Native:
98.6% (12,165)Foreign-born:
67.3% (135)
White (Caucasian) - Speak another language Native:
1.4% (175)Foreign-born:
36.3% (73)
Black or African American - Speak another language Native:
12.3% (106)Foreign-born:
100.0% (157)
Asian - Speak only English Native:
40.7% (88)Foreign-born:
10.0% (132)
Asian - Speak another language Native:
36.9% (80)Foreign-born:
88.3% (1,163)
Other race - Speak another language Native:
100.0% (84)Foreign-born:
100.0% (30)
Two or more races - Speak only English Native:
99.0% (1,105)Foreign-born:
24.5% (16)
White alone - Speak only English Native:
98.8% (12,152)Foreign-born:
62.2% (135)
White alone - Speak another language Native:
1.2% (148)Foreign-born:
36.6% (79)
Hispanic or Latino - Speak only English Native:
76.4% (409)Foreign-born:
12.8% (13)
Hispanic or Latino - Speak another language Native:
22.0% (118)Foreign-born:
77.4% (80)
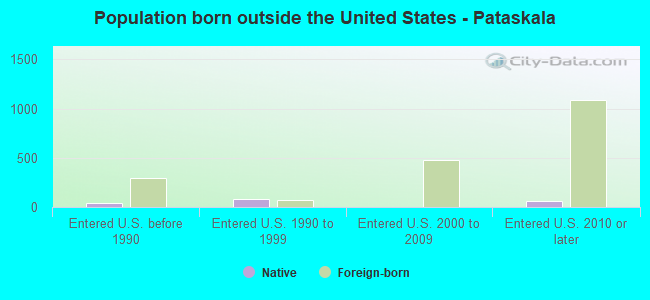
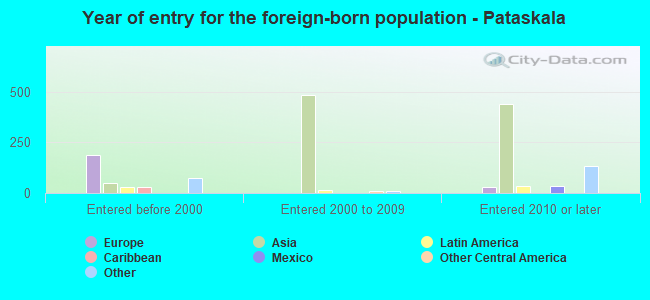
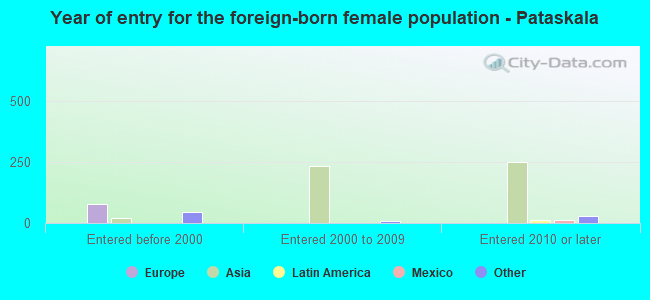
Foreign-born residents in Pataskala 1,522 residents are foreign born (5.4% Asia , 1.3% Europe , 1.1% Africa ).
Marital status for residents in Pataskala Marital status - White (Caucasian) population 15 years and over
Males 24.6% Never married60.4% Now married1.2% Separated3.5% Widowed10.3% DivorcedFemales 22.2% Never married52.9% Now married3.5% Separated6.5% Widowed14.9% DivorcedWomen who gave birth in the past 12 months Now married:
75.1% (244)Unmarried:
24.9% (81)
Women who did not give birth in the past 12 months Now married:
53.8% (1,430)Unmarried:
46.2% (1,226)
Marital status - Black or African American population 15 years and over
Males 37.0% Never married52.4% Now married0.0% Separated7.3% Widowed3.3% DivorcedFemales 43.4% Never married47.2% Now married0.0% Separated2.8% Widowed6.6% DivorcedWomen who gave birth in the past 12 months Now married:
76.5% (25)Unmarried:
23.5% (8)
Women who did not give birth in the past 12 months Now married:
33.2% (129)Unmarried:
66.8% (259)
Marital status - Asian population 15 years and over
Males 38.0% Never married62.0% Now married0.0% Separated0.0% Widowed0.0% DivorcedFemales 13.1% Never married76.4% Now married0.0% Separated7.8% Widowed2.7% DivorcedWomen who gave birth in the past 12 months Now married:
3.4% (1)Unmarried:
96.6% (38)
Women who did not give birth in the past 12 months Now married:
89.8% (371)Unmarried:
10.2% (42)
Marital status - Other race population 15 years and over
Males 0.0% Never married100.0% Now married0.0% Separated0.0% Widowed0.0% DivorcedFemales 87.3% Never married12.7% Now married0.0% Separated0.0% Widowed0.0% DivorcedWomen who did not give birth in the past 12 months Now married:
12.7% (11)Unmarried:
87.3% (73)
Marital status - Two or more races population 15 years and over
Males 37.2% Never married57.2% Now married0.0% Separated0.0% Widowed5.6% DivorcedFemales 32.5% Never married46.3% Now married0.0% Separated3.1% Widowed18.0% DivorcedWomen who gave birth in the past 12 months Now married:
31.6% (8)Unmarried:
68.4% (17)
Women who did not give birth in the past 12 months Now married:
55.4% (136)Unmarried:
44.6% (110)
Marital status - White alone, not Hispanic / Latino population 15 years and over
Males 24.2% Never married60.7% Now married1.2% Separated3.5% Widowed10.4% DivorcedFemales 22.0% Never married53.1% Now married3.5% Separated6.5% Widowed14.9% DivorcedWomen who gave birth in the past 12 months Now married:
75.1% (247)Unmarried:
24.9% (82)
Women who did not give birth in the past 12 months Now married:
54.2% (1,447)Unmarried:
45.8% (1,222)
Marital status - Hispanic or Latino population 15 years and over
Males 43.0% Never married49.5% Now married0.0% Separated0.0% Widowed7.5% DivorcedFemales 55.2% Never married44.8% Now married0.0% Separated0.0% Widowed0.0% DivorcedWomen who did not give birth in the past 12 months Now married:
44.8% (82)Unmarried:
55.2% (101)
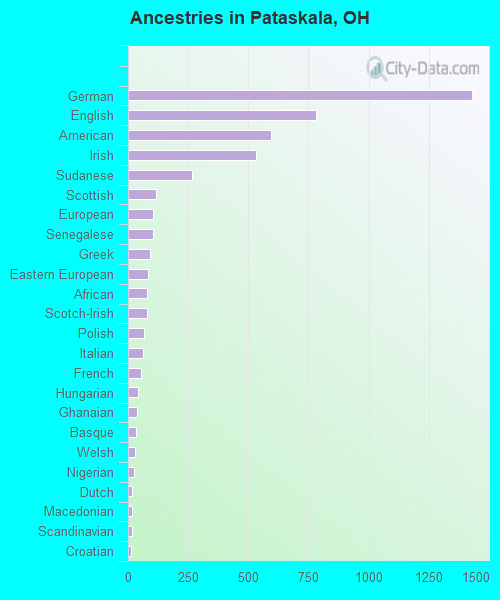
Ancestries in Pataskala
1,429 20.1% German783 11.0% English596 8.4% American534 7.5% Irish268 3.8% Sudanese116 1.6% Scottish104 1.5% European102 1.4% Senegalese90 1.3% Greek83 1.2% Eastern European78 1.1% African77 1.1% Scotch-Irish67 0.9% Polish63 0.9% Italian55 0.8% French40 0.6% Hungarian37 0.5% Ghanaian33 0.5% Basque31 0.4% Welsh23 0.3% Nigerian18 0.3% Dutch18 0.3% Macedonian15 0.2% Scandinavian13 0.2% Croatian8 0.1% Pennsylvania German8 0.1% Swiss6 0.08% Norwegian6 0.08% Slovak6 0.08% Ukrainian4 0.06% Austrian
Children Nativity (place of birth) in Pataskala
Children under 6 years - Living with two parents Both parents native 744 100.0% NativeBoth parents foreign-born 189 100.0% NativeOne native, one foreign-born parent 9 100.0% NativeChildren under 6 years - Living with one parent Native parent 486 100.0% NativeForeign-born parent 17 100.0% NativeChildren 6 to 17 years - Living with two parents Both parents native 2,023 99.7% Native6 0.3% Foreign-bornBoth parents foreign-born 262 79.6% Native67 20.4% Foreign-bornOne native, one foreign-born parent 49 100.0% NativeChildren 6 to 17 years - Living with one parent Native parent 382 100.0% Native
Grandparents responsible for own grandchildren in Pataskala
Grandparents (30 to 59 years) White / Caucasian 53 77.2% Responsible for grandchildren15 22.8% Not responsible for grandchildrenBlack or African American 7 100.0% Responsible for grandchildrenAsian 4 100.0% Not responsible for grandchildrenWhite alone, not Hispanic / Latino 53 77.2% Responsible for grandchildren15 22.8% Not responsible for grandchildrenGrandparents (60 years and over) White / Caucasian 28 33.4% Responsible for grandchildren55 66.6% Not responsible for grandchildrenBlack or African American 17 100.0% Responsible for grandchildrenAsian 87 100.0% Not responsible for grandchildrenWhite alone, not Hispanic / Latino 28 33.4% Responsible for grandchildren55 66.6% Not responsible for grandchildren