Races in Pembroke Park, Florida (FL) Detailed Stats
Data:
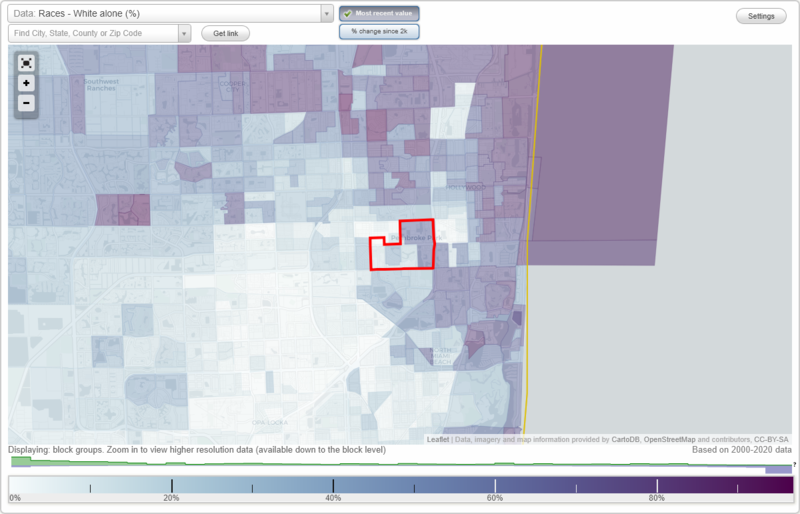
Races - White alone (%)
Races - White alone (% change since 2000)
Races - Black alone (%)
Races - Black alone (% change since 2000)
Races - American Indian alone (%)
Races - American Indian alone (% change since 2000)
Races - Asian alone (%)
Races - Asian alone (% change since 2000)
Races - Hispanic (%)
Races - Hispanic (% change since 2000)
Races - Native Hawaiian and Other Pacific Islander alone (%)
Races - Native Hawaiian and Other Pacific Islander alone (% change since 2000)
Races - Two or more races(%)
Races - Two or more races(% change since 2000)
Races - Other race alone (%)
Races - Other race alone (% change since 2000)
Racial diversity
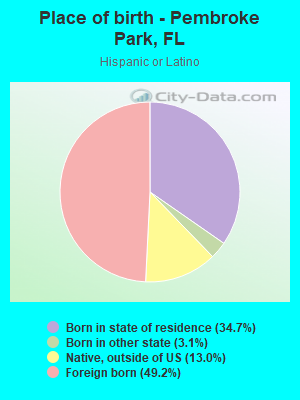
Place of birth - Born in state of residence (%)
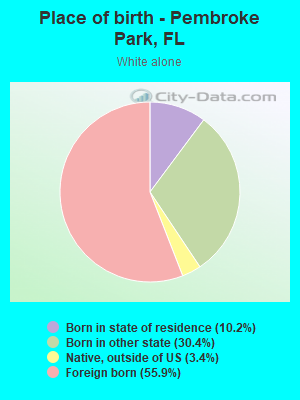
Place of birth - Born in state of residence (%) - White
Place of birth - Born in state of residence (%) - Black or African American
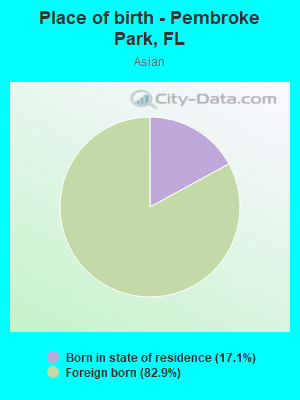
Place of birth - Born in state of residence (%) - Asian
Place of birth - Born in state of residence (%) - Hispanic or Latino
Place of birth - Born in state of residence (%) - American Indian and Alaska Native
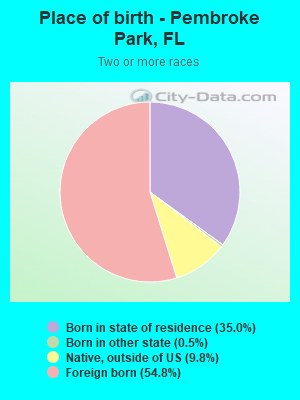
Place of birth - Born in state of residence (%) - Multirace
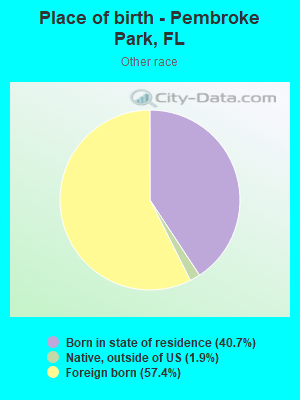
Place of birth - Born in state of residence (%) - Other Race
Place of birth - Born in other state (%)
Place of birth - Born in other state (%) - White
Place of birth - Born in other state (%) - Black or African American
Place of birth - Born in other state (%) - Asian
Place of birth - Born in other state (%) - Hispanic or Latino
Place of birth - Born in other state (%) - American Indian and Alaska Native
Place of birth - Born in other state (%) - Multirace
Place of birth - Born in other state (%) - Other Race
Place of birth - Native, outside of US (%)
Place of birth - Native, outside of US (%) - White
Place of birth - Native, outside of US (%) - Black or African American
Place of birth - Native, outside of US (%) - Asian
Place of birth - Native, outside of US (%) - Hispanic or Latino
Place of birth - Native, outside of US (%) - American Indian and Alaska Native
Place of birth - Native, outside of US (%) - Multirace
Place of birth - Native, outside of US (%) - Other Race
Place of birth - Foreign born (%)
Place of birth - Foreign born (%) - White
Place of birth - Foreign born (%) - Black or African American
Place of birth - Foreign born (%) - Asian
Place of birth - Foreign born (%) - Hispanic or Latino
Place of birth - Foreign born (%) - American Indian and Alaska Native
Place of birth - Foreign born (%) - Multirace
Place of birth - Foreign born (%) - Other Race
Residents speaking English at home (%)
Residents speaking English at home - Born in the United States (%)
Residents speaking English at home - Native, born elsewhere (%)
Residents speaking English at home - Foreign born (%)
Residents speaking Spanish at home (%)
Residents speaking Spanish at home - Born in the United States (%)
Residents speaking Spanish at home - Native, born elsewhere (%)
Residents speaking Spanish at home - Foreign born (%)
Residents speaking other language at home (%)
Residents speaking other language at home - Born in the United States (%)
Residents speaking other language at home - Native, born elsewhere (%)
Residents speaking other language at home - Foreign born (%)
Marital status - Never married (%)
Marital status - Now married (%)
Marital status - Separated (%)
Marital status - Widowed (%)
Marital status - Divorced (%)
Ancestries Reported - Arab (%)
Ancestries Reported - Czech (%)
Ancestries Reported - Danish (%)
Ancestries Reported - Dutch (%)
Ancestries Reported - English (%)
Ancestries Reported - French (%)
Ancestries Reported - French Canadian (%)
Ancestries Reported - German (%)
Ancestries Reported - Greek (%)
Ancestries Reported - Hungarian (%)
Ancestries Reported - Irish (%)
Ancestries Reported - Italian (%)
Ancestries Reported - Lithuanian (%)
Ancestries Reported - Norwegian (%)
Ancestries Reported - Polish (%)
Ancestries Reported - Portuguese (%)
Ancestries Reported - Russian (%)
Ancestries Reported - Scotch-Irish (%)
Ancestries Reported - Scottish (%)
Ancestries Reported - Slovak (%)
Ancestries Reported - Subsaharan African (%)
Ancestries Reported - Swedish (%)
Ancestries Reported - Swiss (%)
Ancestries Reported - Ukrainian (%)
Ancestries Reported - United States (%)
Ancestries Reported - Welsh (%)
Ancestries Reported - West Indian (%)
Ancestries Reported - Other (%)
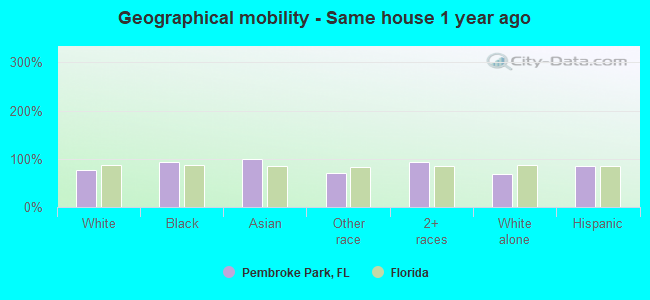
Geographical mobility - Same house 1 year ago (%)
Geographical mobility - Same house 1 year ago (%) - White
Geographical mobility - Same house 1 year ago (%) - Black or African American
Geographical mobility - Same house 1 year ago (%) - Asian
Geographical mobility - Same house 1 year ago (%) - Hispanic or Latino
Geographical mobility - Same house 1 year ago (%) - American Indian and Alaska Native
Geographical mobility - Same house 1 year ago (%) - Multirace
Geographical mobility - Same house 1 year ago (%) - Other Race
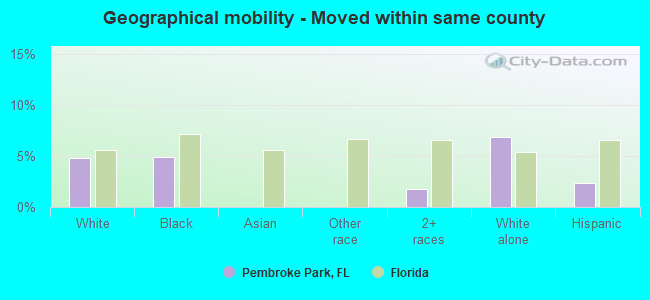
Geographical mobility - Moved within same county (%)
Geographical mobility - Moved within same county (%) - White
Geographical mobility - Moved within same county (%) - Black or African American
Geographical mobility - Moved within same county (%) - Asian
Geographical mobility - Moved within same county (%) - Hispanic or Latino
Geographical mobility - Moved within same county (%) - American Indian and Alaska Native
Geographical mobility - Moved within same county (%) - Multirace
Geographical mobility - Moved within same county (%) - Other Race
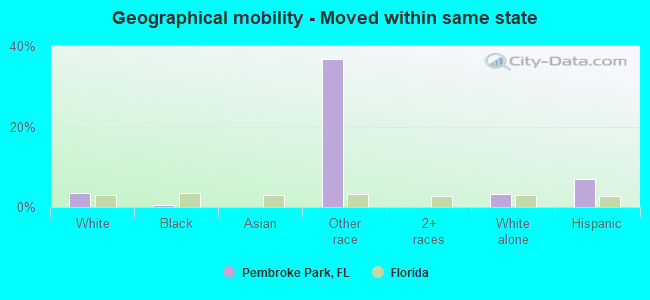
Geographical mobility - Moved from different county within same state (%)
Geographical mobility - Moved from different county within same state (%) - White
Geographical mobility - Moved from different county within same state (%) - Black or African American
Geographical mobility - Moved from different county within same state (%) - Asian
Geographical mobility - Moved from different county within same state (%) - Hispanic or Latino
Geographical mobility - Moved from different county within same state (%) - American Indian and Alaska Native
Geographical mobility - Moved from different county within same state (%) - Multirace
Geographical mobility - Moved from different county within same state (%) - Other Race
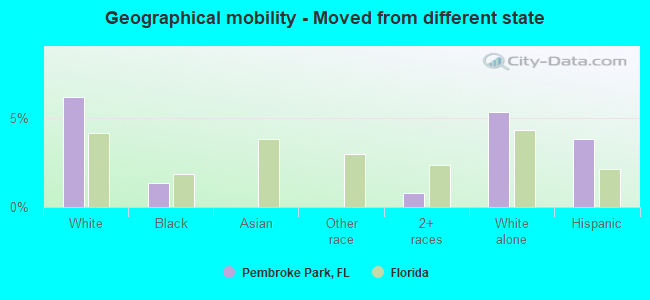
Geographical mobility - Moved from different state (%)
Geographical mobility - Moved from different state (%) - White
Geographical mobility - Moved from different state (%) - Black or African American
Geographical mobility - Moved from different state (%) - Asian
Geographical mobility - Moved from different state (%) - Hispanic or Latino
Geographical mobility - Moved from different state (%) - American Indian and Alaska Native
Geographical mobility - Moved from different state (%) - Multirace
Geographical mobility - Moved from different state (%) - Other Race
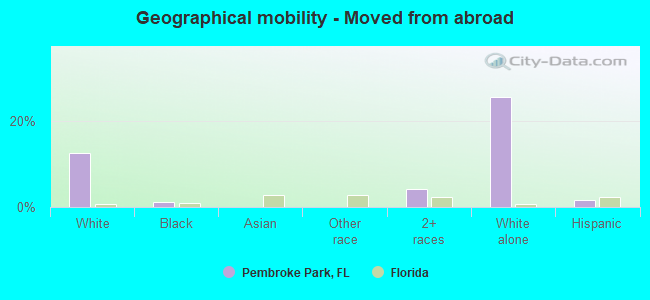
Geographical mobility - Moved from abroad (%)
Geographical mobility - Moved from abroad (%) - White
Geographical mobility - Moved from abroad (%) - Black or African American
Geographical mobility - Moved from abroad (%) - Asian
Geographical mobility - Moved from abroad (%) - Hispanic or Latino
Geographical mobility - Moved from abroad (%) - American Indian and Alaska Native
Geographical mobility - Moved from abroad (%) - Multirace
Geographical mobility - Moved from abroad (%) - Other Race
Place of birth for the foreign-born population - Ireland (%)
Place of birth for the foreign-born population - Denmark (%)
Place of birth for the foreign-born population - Norway (%)
Place of birth for the foreign-born population - Sweden (%)
Place of birth for the foreign-born population - United Kingdom (%)
Place of birth for the foreign-born population - England (%)
Place of birth for the foreign-born population - Scotland (%)
Place of birth for the foreign-born population - Other Northern Europe (%)
Place of birth for the foreign-born population - Austria (%)
Place of birth for the foreign-born population - Belgium (%)
Place of birth for the foreign-born population - France (%)
Place of birth for the foreign-born population - Germany (%)
Place of birth for the foreign-born population - Netherlands (%)
Place of birth for the foreign-born population - Switzerland (%)
Place of birth for the foreign-born population - Other Western Europe (%)
Place of birth for the foreign-born population - Greece (%)
Place of birth for the foreign-born population - Italy (%)
Place of birth for the foreign-born population - Portugal (%)
Place of birth for the foreign-born population - Spain (%)
Place of birth for the foreign-born population - Other Southern Europe (%)
Place of birth for the foreign-born population - Albania (%)
Place of birth for the foreign-born population - Belarus (%)
Place of birth for the foreign-born population - Bosnia and Herzegovina (%)
Place of birth for the foreign-born population - Bulgaria (%)
Place of birth for the foreign-born population - Croatia (%)
Place of birth for the foreign-born population - Czechoslovakia (%)
Place of birth for the foreign-born population - Hungary (%)
Place of birth for the foreign-born population - Latvia (%)
Place of birth for the foreign-born population - Lithuania (%)
Place of birth for the foreign-born population - North Macedonia (Macedonia) (%)
Place of birth for the foreign-born population - Moldova (%)
Place of birth for the foreign-born population - Poland (%)
Place of birth for the foreign-born population - Romania (%)
Place of birth for the foreign-born population - Russia (%)
Place of birth for the foreign-born population - Serbia (%)
Place of birth for the foreign-born population - Ukraine (%)
Place of birth for the foreign-born population - Other Eastern Europe (%)
Place of birth for the foreign-born population - China (%)
Place of birth for the foreign-born population - Hong Kong (%)
Place of birth for the foreign-born population - Taiwan (%)
Place of birth for the foreign-born population - Japan (%)
Place of birth for the foreign-born population - Korea (%)
Place of birth for the foreign-born population - Other Eastern Asia (%)
Place of birth for the foreign-born population - Afghanistan (%)
Place of birth for the foreign-born population - Bangladesh (%)
Place of birth for the foreign-born population - India (%)
Place of birth for the foreign-born population - Iran (%)
Place of birth for the foreign-born population - Kazakhstan (%)
Place of birth for the foreign-born population - Nepal (%)
Place of birth for the foreign-born population - Pakistan (%)
Place of birth for the foreign-born population - Sri Lanka (%)
Place of birth for the foreign-born population - Uzbekistan (%)
Place of birth for the foreign-born population - Other South Central Asia (%)
Place of birth for the foreign-born population - Burma (%)
Place of birth for the foreign-born population - Cambodia (%)
Place of birth for the foreign-born population - Indonesia (%)
Place of birth for the foreign-born population - Laos (%)
Place of birth for the foreign-born population - Malaysia (%)
Place of birth for the foreign-born population - Philippines (%)
Place of birth for the foreign-born population - Singapore (%)
Place of birth for the foreign-born population - Thailand (%)
Place of birth for the foreign-born population - Vietnam (%)
Place of birth for the foreign-born population - Other South Eastern Asia (%)
Place of birth for the foreign-born population - Armenia (%)
Place of birth for the foreign-born population - Iraq (%)
Place of birth for the foreign-born population - Israel (%)
Place of birth for the foreign-born population - Jordan (%)
Place of birth for the foreign-born population - Kuwait (%)
Place of birth for the foreign-born population - Lebanon (%)
Place of birth for the foreign-born population - Saudi Arabia (%)
Place of birth for the foreign-born population - Syria (%)
Place of birth for the foreign-born population - Turkey (%)
Place of birth for the foreign-born population - Yemen (%)
Place of birth for the foreign-born population - Other Western Asia (%)
Place of birth for the foreign-born population - Eritrea (%)
Place of birth for the foreign-born population - Ethiopia (%)
Place of birth for the foreign-born population - Kenya (%)
Place of birth for the foreign-born population - Somalia (%)
Place of birth for the foreign-born population - Uganda (%)
Place of birth for the foreign-born population - Zimbabwe (%)
Place of birth for the foreign-born population - Other Eastern Africa (%)
Place of birth for the foreign-born population - Cameroon (%)
Place of birth for the foreign-born population - Congo (%)
Place of birth for the foreign-born population - Democratic Republic of Congo (Zaire) (%)
Place of birth for the foreign-born population - Other Middle Africa (%)
Place of birth for the foreign-born population - Egypt (%)
Place of birth for the foreign-born population - Morocco (%)
Place of birth for the foreign-born population - Sudan (%)
Place of birth for the foreign-born population - Other Northern Africa (%)
Place of birth for the foreign-born population - South Africa (%)
Place of birth for the foreign-born population - Other Southern Africa (%)
Place of birth for the foreign-born population - Cabo Verde (%)
Place of birth for the foreign-born population - Ghana (%)
Place of birth for the foreign-born population - Liberia (%)
Place of birth for the foreign-born population - Nigeria (%)
Place of birth for the foreign-born population - Senegal (%)
Place of birth for the foreign-born population - Sierra Leone (%)
Place of birth for the foreign-born population - Other Western Africa (%)
Place of birth for the foreign-born population - Australia (%)
Place of birth for the foreign-born population - New Zealand (%)
Place of birth for the foreign-born population - Fiji (%)
Place of birth for the foreign-born population - Micronesia (%)
Place of birth for the foreign-born population - Bahamas (%)
Place of birth for the foreign-born population - Barbados (%)
Place of birth for the foreign-born population - Cuba (%)
Place of birth for the foreign-born population - Dominica (%)
Place of birth for the foreign-born population - Dominican Republic (%)
Place of birth for the foreign-born population - Grenada (%)
Place of birth for the foreign-born population - Haiti (%)
Place of birth for the foreign-born population - Jamaica (%)
Place of birth for the foreign-born population - St. Vincent and the Grenadines (%)
Place of birth for the foreign-born population - Trinidad and Tobago (%)
Place of birth for the foreign-born population - West Indies (%)
Place of birth for the foreign-born population - Other Caribbean (%)
Place of birth for the foreign-born population - Belize (%)
Place of birth for the foreign-born population - Costa Rica (%)
Place of birth for the foreign-born population - El Salvador (%)
Place of birth for the foreign-born population - Guatemala (%)
Place of birth for the foreign-born population - Honduras (%)
Place of birth for the foreign-born population - Mexico (%)
Place of birth for the foreign-born population - Nicaragua (%)
Place of birth for the foreign-born population - Panama (%)
Place of birth for the foreign-born population - Other Central America (%)
Place of birth for the foreign-born population - Argentina (%)
Place of birth for the foreign-born population - Bolivia (%)
Place of birth for the foreign-born population - Brazil (%)
Place of birth for the foreign-born population - Chile (%)
Place of birth for the foreign-born population - Colombia (%)
Place of birth for the foreign-born population - Ecuador (%)
Place of birth for the foreign-born population - Guyana (%)
Place of birth for the foreign-born population - Peru (%)
Place of birth for the foreign-born population - Uruguay (%)
Place of birth for the foreign-born population - Venezuela (%)
Place of birth for the foreign-born population - Other South America (%)
Place of birth for the foreign-born population - Canada (%)
Place of birth for the foreign-born population - Other Northern America (%)
Place of birth for the foreign-born population - Other (%)
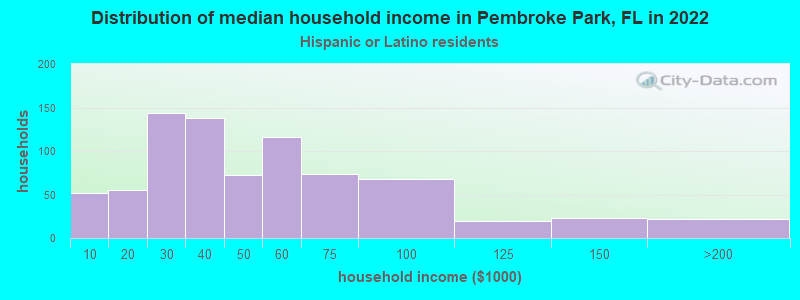
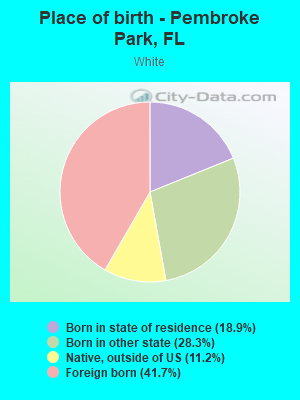
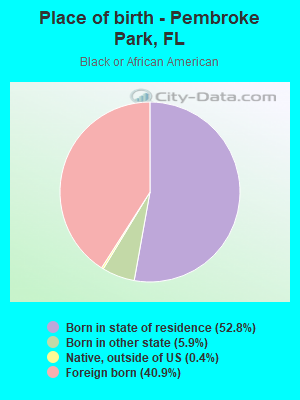
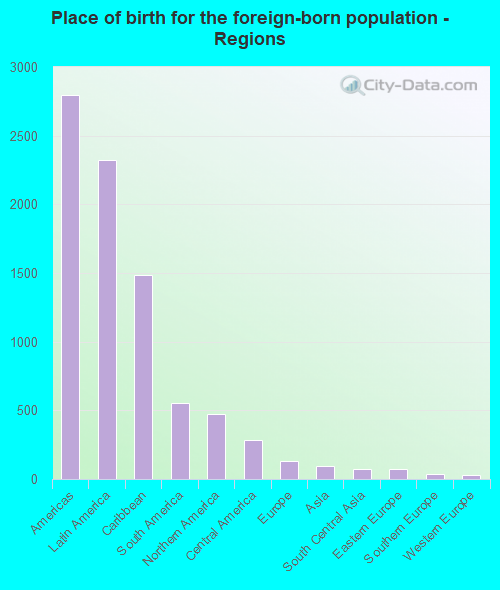
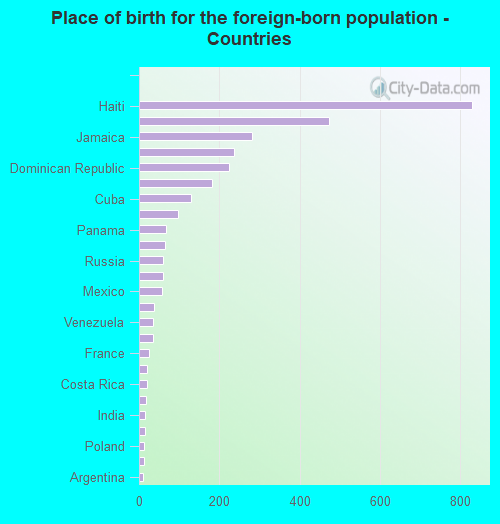
According to 2022 data, the most numerous races in Pembroke Park, FL are White alone (986 residents), Hispanic (2,443 residents), and Black alone (2,617 residents). 32.8% of Pembroke Park residents speak English at home. 48.3% of Pembroke Park, FL residents are foreign-born (34.9% born in Latin America, 7.1% born in North America), which is 56.6% greater than the foreign-born rate of 21.0% across the entire state of Florida.
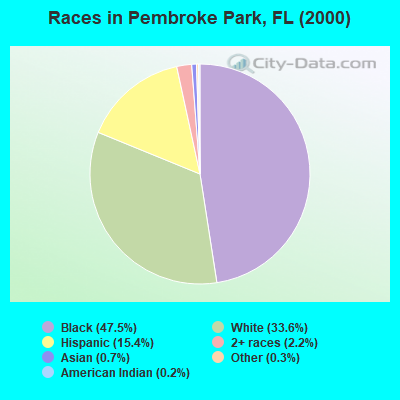
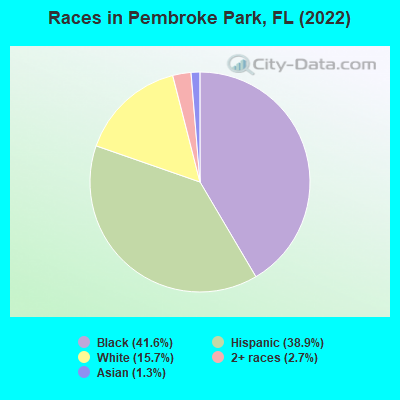
Race distribution in Pembroke Park
2000 2022
10,458,509 65.4% White alone 2,682,715 16.8% Hispanic 2,264,268 14.2% Black alone 261,693 1.6% Asian alone 236,954 1.5% Two or more races 42,358 0.3% American Indian alone 28,994 0.2% Other race alone 6,887 0.04% Native Hawaiian and Other
11,309,403 50.8% White alone 6,025,039 27.1% Hispanic 3,241,015 14.6% Black alone 861,630 3.9% Two or more races 623,692 2.8% Asian alone 152,054 0.7% Other race alone 22,504 0.1% American Indian alone 9,486 0.04% Native Hawaiian and Other
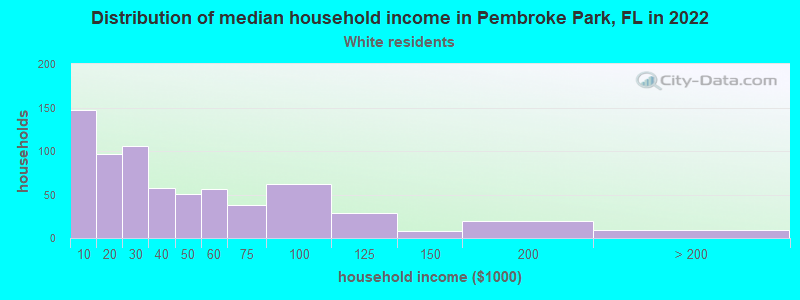
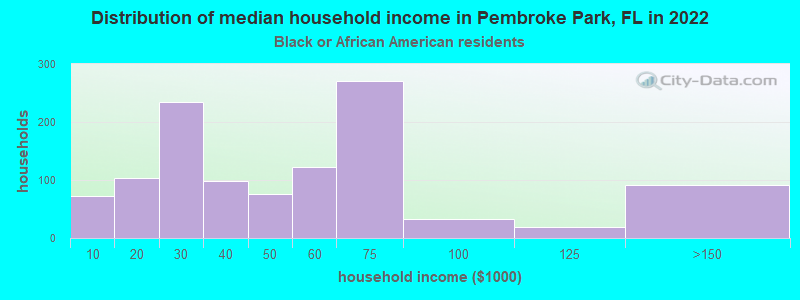
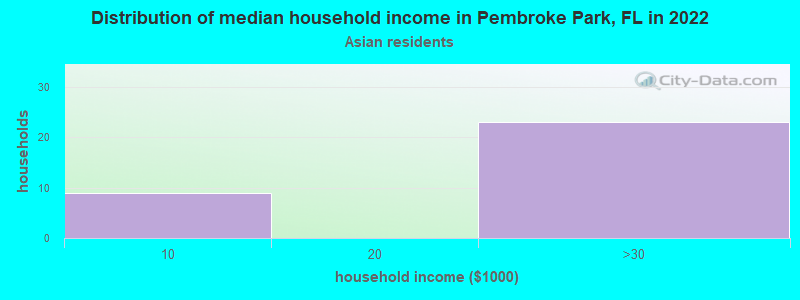
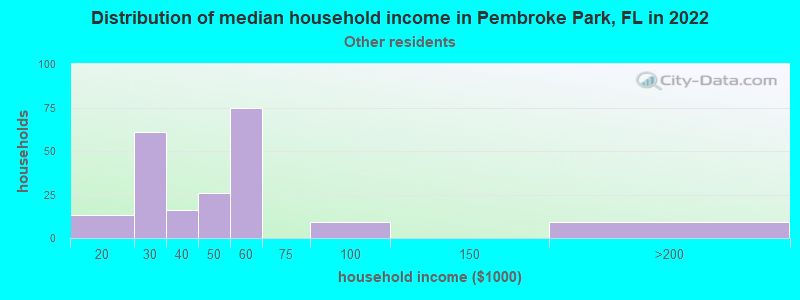
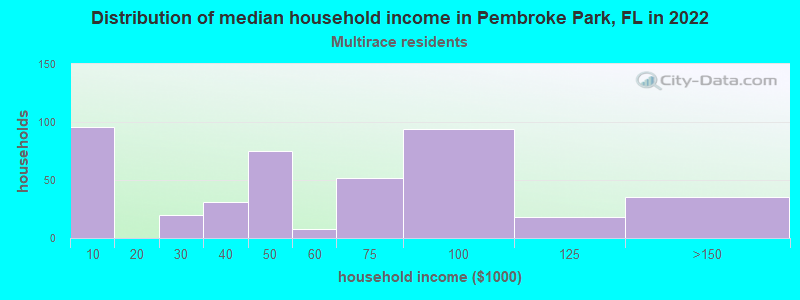
Income and house value in Pembroke Park Median household income in 2022 $25,541 White non-Hispanic householders$48,477 Black householders$43,562 Some other race householders$50,369 Two or more races householders$39,687 Hispanic or Latino race householdersMedian 2022 house value $79,807 White Non-Hispanic householders$106,194 Black or African American householders$80,940 Some other race householders$28,329 Two or more races householders$70,094 Hispanic or Latino householders
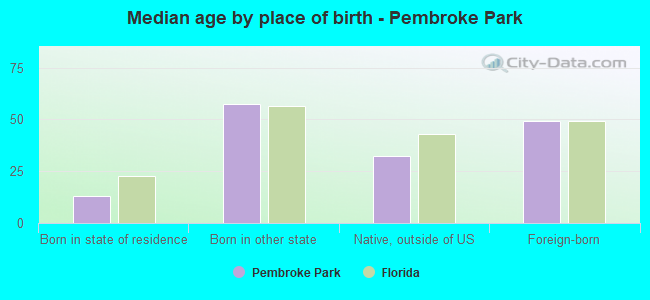
Median age by race in Pembroke Park
63.4 Median age for White residents61.0 67.9 30.1 Median age for Black or African American residents30.0 31.3 -660,098,521.5 Median age for American Indian / Alaska Native residents-518,333,332.8 -735,362,996.9 59.6 Median age for Asian residents49.1 -669,841,269.2 -437,357,630.5 Median age for Native Hawaiian / Pacific Islander residents-454,756,380.1 -666,666,666.0 28.4 Median age for Other race residents16.1 45.2 24.7 Median age for Two or more races residents14.5 30.5 72.8 Median age for White alone residents70.3 74.4 28.5 Median age for Hispanic or Latino residents28.1 30.0
Owner/renter occupied households by race in Pembroke Park
House owners and renters - White residents 400 58.8% Owner occupied280 41.2% Renter occupiedHouse owners and renters - Black or African American residents 134 11.6% Owner occupied1,024 88.4% Renter occupiedHouse owners and renters - Asian residents 35 100.0% Renter occupiedHouse owners and renters - Other race residents 91 45.3% Owner occupied109 54.7% Renter occupiedHouse owners and renters - Two or more races residents 214 48.2% Owner occupied230 51.8% Renter occupiedHouse owners and renters - White alone residents 358 70.2% Owner occupied152 29.8% Renter occupiedHouse owners and renters - Hispanic or Latino residents 288 35.4% Owner occupied526 64.6% Renter occupied
Language usage in Pembroke Park
English speakers - Total 32.8% of residents of Pembroke Park speak English at home.
34.6% of residents speak Spanish at home 1,128 58.0% Speak English very well817 42.0% Speak English less than very well34.2% of residents speak other language at home 970 50.5% Speak English very well951 49.5% Speak English less than very well
English speakers - Born in the United States 76.3% of residents of Pembroke Park speak English at home.
15.5% of residents speak Spanish at home 64 80.0% Speak English very well16 20.0% Speak English less than very well9.1% of residents speak other language at home 47 100.0% Speak English very well
English speakers - Native, born elsewhere 5.4% of residents of Pembroke Park speak English at home.
83.7% of residents speak Spanish at home 171 55.7% Speak English very well136 44.3% Speak English less than very well7.6% of residents speak other language at home 28 100.0% Speak English very well
English speakers - Foreign-born 10.0% of residents of Pembroke Park speak English at home.
37.2% of residents speak Spanish at home 502 44.7% Speak English very well620 55.3% Speak English less than very well53.0% of residents speak other language at home 717 44.9% Speak English very well879 55.1% Speak English less than very well
White (Caucasian) - Speak only English Native:
49.6% (379)Foreign-born:
18.2% (90)
White (Caucasian) - Speak another language Native:
40.0% (306)Foreign-born:
81.3% (402)
Black or African American - Speak only English Native:
77.0% (989)Foreign-born:
13.7% (159)
Black or African American - Speak another language Native:
22.2% (285)Foreign-born:
89.8% (1,047)
Other race - Speak another language Native:
90.5% (239)Foreign-born:
99.4% (367)
Two or more races - Speak only English Native:
42.5% (210)Foreign-born:
4.3% (39)
Two or more races - Speak another language Native:
57.7% (285)Foreign-born:
96.3% (884)
White alone - Speak only English Native:
78.6% (328)Foreign-born:
14.5% (80)
White alone - Speak another language Native:
21.7% (90)Foreign-born:
84.2% (461)
Hispanic or Latino - Speak only English Native:
22.7% (229)Foreign-born:
4.9% (57)
Hispanic or Latino - Speak another language Native:
77.1% (781)Foreign-born:
95.1% (1,112)
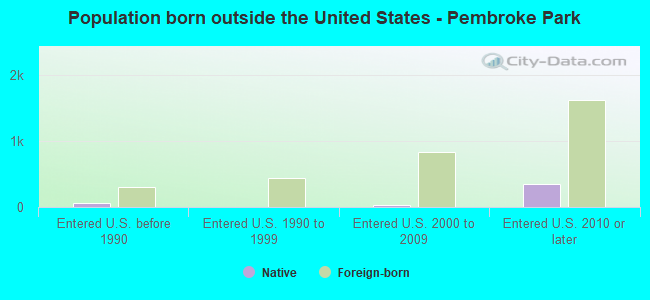
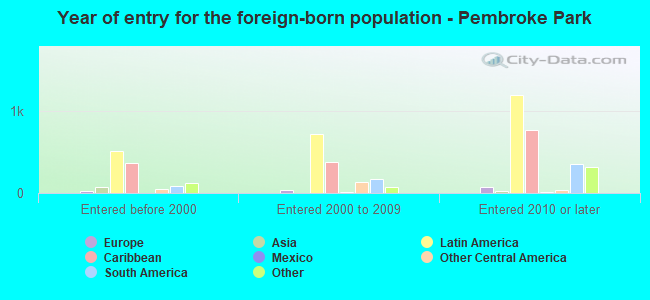
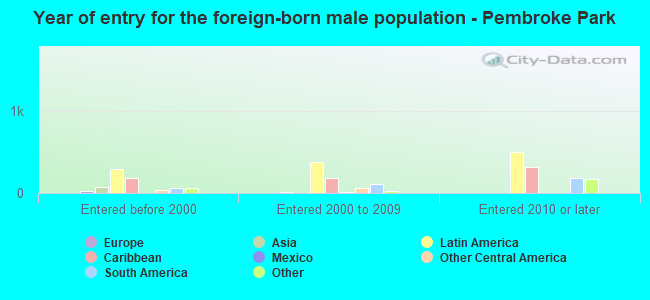
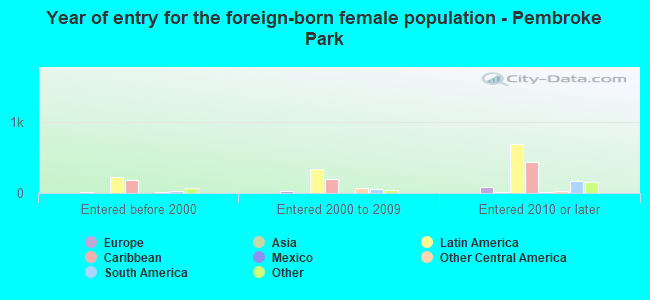
Foreign-born residents in Pembroke Park 3,039 residents are foreign born (34.9% Latin America , 7.1% North America ).
This city:
48.3%Florida:
21.1%
Marital status for residents in Pembroke Park Marital status - White (Caucasian) population 15 years and over
Males 34.7% Never married45.6% Now married2.3% Separated1.4% Widowed16.0% DivorcedFemales 28.2% Never married32.7% Now married0.9% Separated22.1% Widowed16.1% DivorcedWomen who did not give birth in the past 12 months Now married:
21.3% (38)Unmarried:
78.7% (140)
Marital status - Black or African American population 15 years and over
Males 38.5% Never married34.3% Now married11.1% Separated0.0% Widowed16.2% DivorcedFemales 33.8% Never married25.6% Now married4.6% Separated5.7% Widowed30.4% DivorcedWomen who gave birth in the past 12 months Now married:
100.0% (36)Unmarried:
0.0% (0)
Women who did not give birth in the past 12 months Now married:
21.4% (151)Unmarried:
78.6% (555)
Marital status - Asian population 15 years and over
Males 54.4% Never married10.1% Now married0.0% Separated0.0% Widowed35.4% DivorcedFemales 0.0% Never married100.0% Now married0.0% Separated0.0% Widowed0.0% DivorcedMarital status - Other race population 15 years and over
Males 49.3% Never married29.6% Now married0.0% Separated0.0% Widowed21.1% DivorcedFemales 52.3% Never married3.5% Now married24.4% Separated10.5% Widowed9.3% DivorcedWomen who did not give birth in the past 12 months Now married:
41.0% (71)Unmarried:
59.0% (103)
Marital status - Two or more races population 15 years and over
Males 22.4% Never married62.4% Now married0.0% Separated0.0% Widowed15.1% DivorcedFemales 32.4% Never married44.8% Now married0.0% Separated14.5% Widowed8.3% DivorcedWomen who gave birth in the past 12 months Now married:
36.8% (21)Unmarried:
63.2% (36)
Women who did not give birth in the past 12 months Now married:
44.5% (122)Unmarried:
55.5% (153)
Marital status - White alone, not Hispanic / Latino population 15 years and over
Males 26.7% Never married52.6% Now married3.7% Separated2.3% Widowed14.7% DivorcedFemales 22.4% Never married37.0% Now married1.3% Separated20.6% Widowed18.6% DivorcedWomen who did not give birth in the past 12 months Now married:
21.5% (21)Unmarried:
78.5% (75)
Marital status - Hispanic or Latino population 15 years and over
Males 38.0% Never married47.1% Now married0.0% Separated0.0% Widowed14.9% DivorcedFemales 37.4% Never married29.1% Now married5.2% Separated14.8% Widowed13.5% DivorcedWomen who gave birth in the past 12 months Now married:
61.3% (39)Unmarried:
38.7% (25)
Women who did not give birth in the past 12 months Now married:
33.6% (161)Unmarried:
66.4% (317)
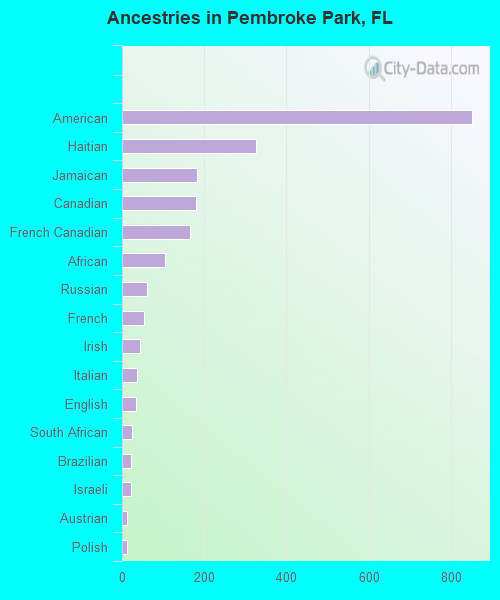
Ancestries in Pembroke Park
850 19.3% American325 7.4% Haitian182 4.1% Jamaican179 4.1% Canadian166 3.8% French Canadian105 2.4% African62 1.4% Russian54 1.2% French44 1.0% Irish37 0.8% Italian33 0.7% English25 0.6% South African23 0.5% Brazilian23 0.5% Israeli13 0.3% Austrian13 0.3% Polish5 0.1% West Indian
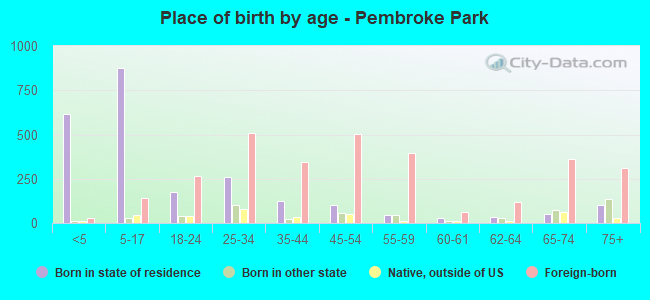
Children Nativity (place of birth) in Pembroke Park
Children under 6 years - Living with two parents Both parents native 2 100.0% Foreign-bornBoth parents foreign-born 275 92.4% Native23 7.6% Foreign-bornChildren under 6 years - Living with one parent Native parent 309 100.0% NativeForeign-born parent 222 100.0% NativeChildren 6 to 17 years - Living with two parents Both parents native 22 93.7% Native2 6.3% Foreign-bornBoth parents foreign-born 117 53.5% Native101 46.5% Foreign-bornOne native, one foreign-born parent 21 71.0% Native9 29.0% Foreign-bornChildren 6 to 17 years - Living with one parent Native parent 346 100.0% NativeForeign-born parent 279 53.9% Native239 46.1% Foreign-born
Grandparents responsible for own grandchildren in Pembroke Park
Grandparents (30 to 59 years) Black or African American 24 36.7% Responsible for grandchildren42 63.3% Not responsible for grandchildrenTwo or more races 116 100.0% Not responsible for grandchildrenHispanic or Latino 69 100.0% Not responsible for grandchildren
Grandparents (60 years and over)