Races in Perry Hall, Maryland (MD) Detailed Stats
Data:
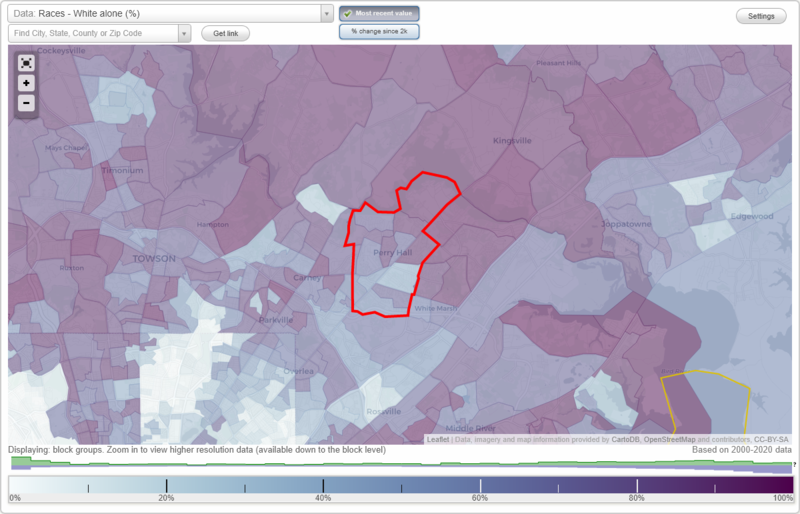
Races - White alone (%)
Races - White alone (% change since 2000)
Races - Black alone (%)
Races - Black alone (% change since 2000)
Races - American Indian alone (%)
Races - American Indian alone (% change since 2000)
Races - Asian alone (%)
Races - Asian alone (% change since 2000)
Races - Hispanic (%)
Races - Hispanic (% change since 2000)
Races - Native Hawaiian and Other Pacific Islander alone (%)
Races - Native Hawaiian and Other Pacific Islander alone (% change since 2000)
Races - Two or more races(%)
Races - Two or more races(% change since 2000)
Races - Other race alone (%)
Races - Other race alone (% change since 2000)
Racial diversity
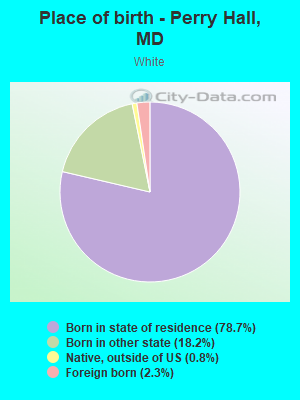
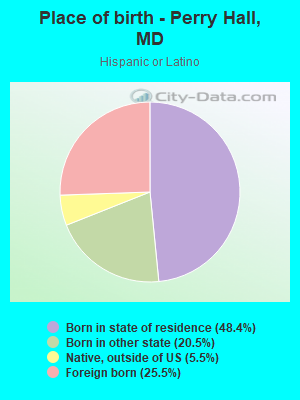
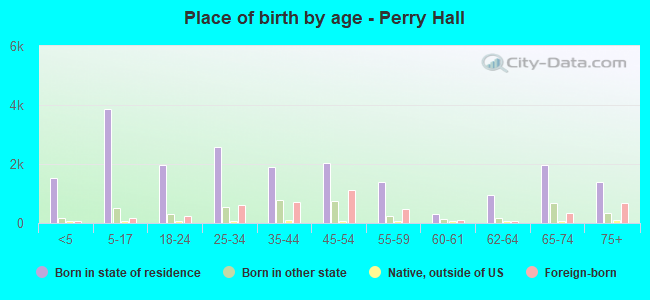
Place of birth - Born in state of residence (%)
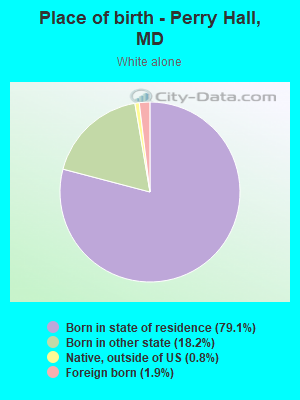
Place of birth - Born in state of residence (%) - White
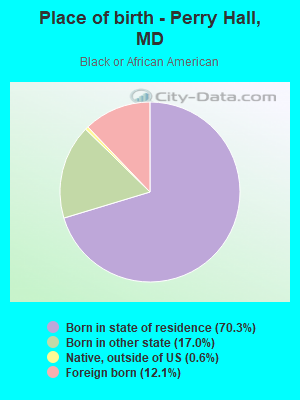
Place of birth - Born in state of residence (%) - Black or African American
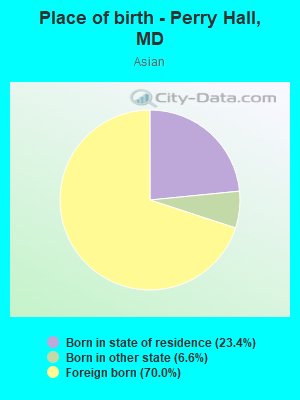
Place of birth - Born in state of residence (%) - Asian
Place of birth - Born in state of residence (%) - Hispanic or Latino
Place of birth - Born in state of residence (%) - American Indian and Alaska Native
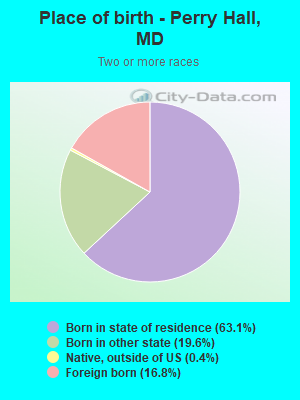
Place of birth - Born in state of residence (%) - Multirace
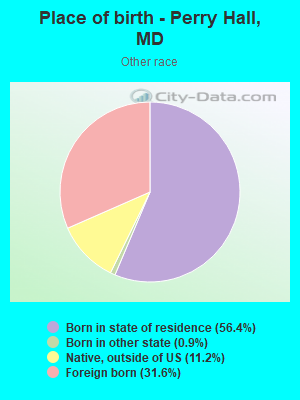
Place of birth - Born in state of residence (%) - Other Race
Place of birth - Born in other state (%)
Place of birth - Born in other state (%) - White
Place of birth - Born in other state (%) - Black or African American
Place of birth - Born in other state (%) - Asian
Place of birth - Born in other state (%) - Hispanic or Latino
Place of birth - Born in other state (%) - American Indian and Alaska Native
Place of birth - Born in other state (%) - Multirace
Place of birth - Born in other state (%) - Other Race
Place of birth - Native, outside of US (%)
Place of birth - Native, outside of US (%) - White
Place of birth - Native, outside of US (%) - Black or African American
Place of birth - Native, outside of US (%) - Asian
Place of birth - Native, outside of US (%) - Hispanic or Latino
Place of birth - Native, outside of US (%) - American Indian and Alaska Native
Place of birth - Native, outside of US (%) - Multirace
Place of birth - Native, outside of US (%) - Other Race
Place of birth - Foreign born (%)
Place of birth - Foreign born (%) - White
Place of birth - Foreign born (%) - Black or African American
Place of birth - Foreign born (%) - Asian
Place of birth - Foreign born (%) - Hispanic or Latino
Place of birth - Foreign born (%) - American Indian and Alaska Native
Place of birth - Foreign born (%) - Multirace
Place of birth - Foreign born (%) - Other Race
Residents speaking English at home (%)
Residents speaking English at home - Born in the United States (%)
Residents speaking English at home - Native, born elsewhere (%)
Residents speaking English at home - Foreign born (%)
Residents speaking Spanish at home (%)
Residents speaking Spanish at home - Born in the United States (%)
Residents speaking Spanish at home - Native, born elsewhere (%)
Residents speaking Spanish at home - Foreign born (%)
Residents speaking other language at home (%)
Residents speaking other language at home - Born in the United States (%)
Residents speaking other language at home - Native, born elsewhere (%)
Residents speaking other language at home - Foreign born (%)
Marital status - Never married (%)
Marital status - Now married (%)
Marital status - Separated (%)
Marital status - Widowed (%)
Marital status - Divorced (%)
Ancestries Reported - Arab (%)
Ancestries Reported - Czech (%)
Ancestries Reported - Danish (%)
Ancestries Reported - Dutch (%)
Ancestries Reported - English (%)
Ancestries Reported - French (%)
Ancestries Reported - French Canadian (%)
Ancestries Reported - German (%)
Ancestries Reported - Greek (%)
Ancestries Reported - Hungarian (%)
Ancestries Reported - Irish (%)
Ancestries Reported - Italian (%)
Ancestries Reported - Lithuanian (%)
Ancestries Reported - Norwegian (%)
Ancestries Reported - Polish (%)
Ancestries Reported - Portuguese (%)
Ancestries Reported - Russian (%)
Ancestries Reported - Scotch-Irish (%)
Ancestries Reported - Scottish (%)
Ancestries Reported - Slovak (%)
Ancestries Reported - Subsaharan African (%)
Ancestries Reported - Swedish (%)
Ancestries Reported - Swiss (%)
Ancestries Reported - Ukrainian (%)
Ancestries Reported - United States (%)
Ancestries Reported - Welsh (%)
Ancestries Reported - West Indian (%)
Ancestries Reported - Other (%)
Geographical mobility - Same house 1 year ago (%)
Geographical mobility - Same house 1 year ago (%) - White
Geographical mobility - Same house 1 year ago (%) - Black or African American
Geographical mobility - Same house 1 year ago (%) - Asian
Geographical mobility - Same house 1 year ago (%) - Hispanic or Latino
Geographical mobility - Same house 1 year ago (%) - American Indian and Alaska Native
Geographical mobility - Same house 1 year ago (%) - Multirace
Geographical mobility - Same house 1 year ago (%) - Other Race
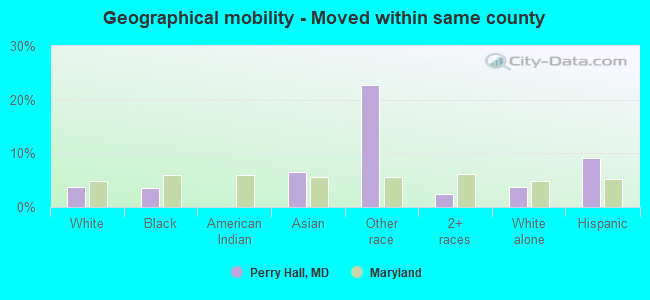
Geographical mobility - Moved within same county (%)
Geographical mobility - Moved within same county (%) - White
Geographical mobility - Moved within same county (%) - Black or African American
Geographical mobility - Moved within same county (%) - Asian
Geographical mobility - Moved within same county (%) - Hispanic or Latino
Geographical mobility - Moved within same county (%) - American Indian and Alaska Native
Geographical mobility - Moved within same county (%) - Multirace
Geographical mobility - Moved within same county (%) - Other Race
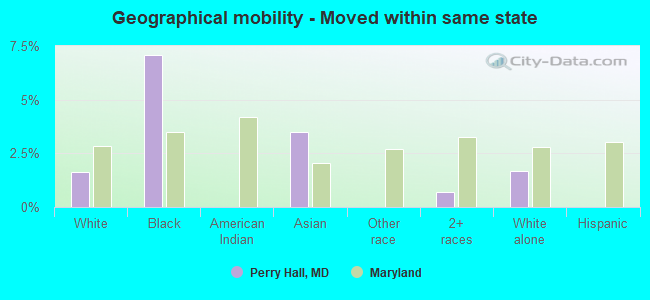
Geographical mobility - Moved from different county within same state (%)
Geographical mobility - Moved from different county within same state (%) - White
Geographical mobility - Moved from different county within same state (%) - Black or African American
Geographical mobility - Moved from different county within same state (%) - Asian
Geographical mobility - Moved from different county within same state (%) - Hispanic or Latino
Geographical mobility - Moved from different county within same state (%) - American Indian and Alaska Native
Geographical mobility - Moved from different county within same state (%) - Multirace
Geographical mobility - Moved from different county within same state (%) - Other Race
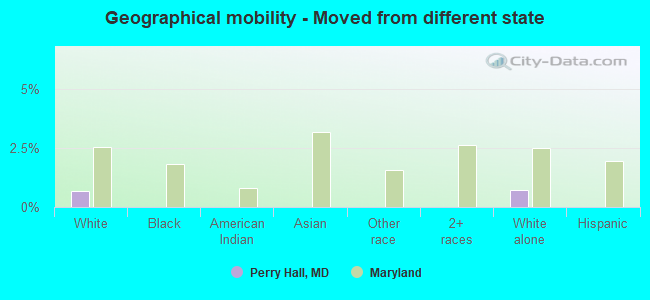
Geographical mobility - Moved from different state (%)
Geographical mobility - Moved from different state (%) - White
Geographical mobility - Moved from different state (%) - Black or African American
Geographical mobility - Moved from different state (%) - Asian
Geographical mobility - Moved from different state (%) - Hispanic or Latino
Geographical mobility - Moved from different state (%) - American Indian and Alaska Native
Geographical mobility - Moved from different state (%) - Multirace
Geographical mobility - Moved from different state (%) - Other Race
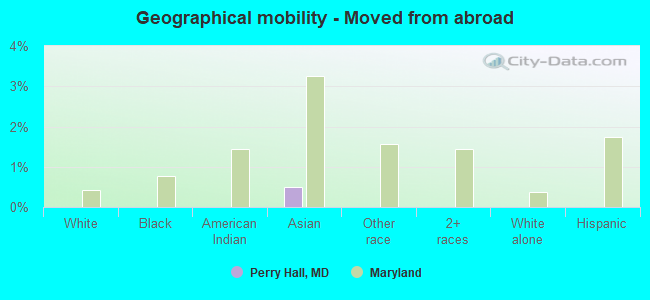
Geographical mobility - Moved from abroad (%)
Geographical mobility - Moved from abroad (%) - White
Geographical mobility - Moved from abroad (%) - Black or African American
Geographical mobility - Moved from abroad (%) - Asian
Geographical mobility - Moved from abroad (%) - Hispanic or Latino
Geographical mobility - Moved from abroad (%) - American Indian and Alaska Native
Geographical mobility - Moved from abroad (%) - Multirace
Geographical mobility - Moved from abroad (%) - Other Race
Place of birth for the foreign-born population - Ireland (%)
Place of birth for the foreign-born population - Denmark (%)
Place of birth for the foreign-born population - Norway (%)
Place of birth for the foreign-born population - Sweden (%)
Place of birth for the foreign-born population - United Kingdom (%)
Place of birth for the foreign-born population - England (%)
Place of birth for the foreign-born population - Scotland (%)
Place of birth for the foreign-born population - Other Northern Europe (%)
Place of birth for the foreign-born population - Austria (%)
Place of birth for the foreign-born population - Belgium (%)
Place of birth for the foreign-born population - France (%)
Place of birth for the foreign-born population - Germany (%)
Place of birth for the foreign-born population - Netherlands (%)
Place of birth for the foreign-born population - Switzerland (%)
Place of birth for the foreign-born population - Other Western Europe (%)
Place of birth for the foreign-born population - Greece (%)
Place of birth for the foreign-born population - Italy (%)
Place of birth for the foreign-born population - Portugal (%)
Place of birth for the foreign-born population - Spain (%)
Place of birth for the foreign-born population - Other Southern Europe (%)
Place of birth for the foreign-born population - Albania (%)
Place of birth for the foreign-born population - Belarus (%)
Place of birth for the foreign-born population - Bosnia and Herzegovina (%)
Place of birth for the foreign-born population - Bulgaria (%)
Place of birth for the foreign-born population - Croatia (%)
Place of birth for the foreign-born population - Czechoslovakia (%)
Place of birth for the foreign-born population - Hungary (%)
Place of birth for the foreign-born population - Latvia (%)
Place of birth for the foreign-born population - Lithuania (%)
Place of birth for the foreign-born population - North Macedonia (Macedonia) (%)
Place of birth for the foreign-born population - Moldova (%)
Place of birth for the foreign-born population - Poland (%)
Place of birth for the foreign-born population - Romania (%)
Place of birth for the foreign-born population - Russia (%)
Place of birth for the foreign-born population - Serbia (%)
Place of birth for the foreign-born population - Ukraine (%)
Place of birth for the foreign-born population - Other Eastern Europe (%)
Place of birth for the foreign-born population - China (%)
Place of birth for the foreign-born population - Hong Kong (%)
Place of birth for the foreign-born population - Taiwan (%)
Place of birth for the foreign-born population - Japan (%)
Place of birth for the foreign-born population - Korea (%)
Place of birth for the foreign-born population - Other Eastern Asia (%)
Place of birth for the foreign-born population - Afghanistan (%)
Place of birth for the foreign-born population - Bangladesh (%)
Place of birth for the foreign-born population - India (%)
Place of birth for the foreign-born population - Iran (%)
Place of birth for the foreign-born population - Kazakhstan (%)
Place of birth for the foreign-born population - Nepal (%)
Place of birth for the foreign-born population - Pakistan (%)
Place of birth for the foreign-born population - Sri Lanka (%)
Place of birth for the foreign-born population - Uzbekistan (%)
Place of birth for the foreign-born population - Other South Central Asia (%)
Place of birth for the foreign-born population - Burma (%)
Place of birth for the foreign-born population - Cambodia (%)
Place of birth for the foreign-born population - Indonesia (%)
Place of birth for the foreign-born population - Laos (%)
Place of birth for the foreign-born population - Malaysia (%)
Place of birth for the foreign-born population - Philippines (%)
Place of birth for the foreign-born population - Singapore (%)
Place of birth for the foreign-born population - Thailand (%)
Place of birth for the foreign-born population - Vietnam (%)
Place of birth for the foreign-born population - Other South Eastern Asia (%)
Place of birth for the foreign-born population - Armenia (%)
Place of birth for the foreign-born population - Iraq (%)
Place of birth for the foreign-born population - Israel (%)
Place of birth for the foreign-born population - Jordan (%)
Place of birth for the foreign-born population - Kuwait (%)
Place of birth for the foreign-born population - Lebanon (%)
Place of birth for the foreign-born population - Saudi Arabia (%)
Place of birth for the foreign-born population - Syria (%)
Place of birth for the foreign-born population - Turkey (%)
Place of birth for the foreign-born population - Yemen (%)
Place of birth for the foreign-born population - Other Western Asia (%)
Place of birth for the foreign-born population - Eritrea (%)
Place of birth for the foreign-born population - Ethiopia (%)
Place of birth for the foreign-born population - Kenya (%)
Place of birth for the foreign-born population - Somalia (%)
Place of birth for the foreign-born population - Uganda (%)
Place of birth for the foreign-born population - Zimbabwe (%)
Place of birth for the foreign-born population - Other Eastern Africa (%)
Place of birth for the foreign-born population - Cameroon (%)
Place of birth for the foreign-born population - Congo (%)
Place of birth for the foreign-born population - Democratic Republic of Congo (Zaire) (%)
Place of birth for the foreign-born population - Other Middle Africa (%)
Place of birth for the foreign-born population - Egypt (%)
Place of birth for the foreign-born population - Morocco (%)
Place of birth for the foreign-born population - Sudan (%)
Place of birth for the foreign-born population - Other Northern Africa (%)
Place of birth for the foreign-born population - South Africa (%)
Place of birth for the foreign-born population - Other Southern Africa (%)
Place of birth for the foreign-born population - Cabo Verde (%)
Place of birth for the foreign-born population - Ghana (%)
Place of birth for the foreign-born population - Liberia (%)
Place of birth for the foreign-born population - Nigeria (%)
Place of birth for the foreign-born population - Senegal (%)
Place of birth for the foreign-born population - Sierra Leone (%)
Place of birth for the foreign-born population - Other Western Africa (%)
Place of birth for the foreign-born population - Australia (%)
Place of birth for the foreign-born population - New Zealand (%)
Place of birth for the foreign-born population - Fiji (%)
Place of birth for the foreign-born population - Micronesia (%)
Place of birth for the foreign-born population - Bahamas (%)
Place of birth for the foreign-born population - Barbados (%)
Place of birth for the foreign-born population - Cuba (%)
Place of birth for the foreign-born population - Dominica (%)
Place of birth for the foreign-born population - Dominican Republic (%)
Place of birth for the foreign-born population - Grenada (%)
Place of birth for the foreign-born population - Haiti (%)
Place of birth for the foreign-born population - Jamaica (%)
Place of birth for the foreign-born population - St. Vincent and the Grenadines (%)
Place of birth for the foreign-born population - Trinidad and Tobago (%)
Place of birth for the foreign-born population - West Indies (%)
Place of birth for the foreign-born population - Other Caribbean (%)
Place of birth for the foreign-born population - Belize (%)
Place of birth for the foreign-born population - Costa Rica (%)
Place of birth for the foreign-born population - El Salvador (%)
Place of birth for the foreign-born population - Guatemala (%)
Place of birth for the foreign-born population - Honduras (%)
Place of birth for the foreign-born population - Mexico (%)
Place of birth for the foreign-born population - Nicaragua (%)
Place of birth for the foreign-born population - Panama (%)
Place of birth for the foreign-born population - Other Central America (%)
Place of birth for the foreign-born population - Argentina (%)
Place of birth for the foreign-born population - Bolivia (%)
Place of birth for the foreign-born population - Brazil (%)
Place of birth for the foreign-born population - Chile (%)
Place of birth for the foreign-born population - Colombia (%)
Place of birth for the foreign-born population - Ecuador (%)
Place of birth for the foreign-born population - Guyana (%)
Place of birth for the foreign-born population - Peru (%)
Place of birth for the foreign-born population - Uruguay (%)
Place of birth for the foreign-born population - Venezuela (%)
Place of birth for the foreign-born population - Other South America (%)
Place of birth for the foreign-born population - Canada (%)
Place of birth for the foreign-born population - Other Northern America (%)
Place of birth for the foreign-born population - Other (%)
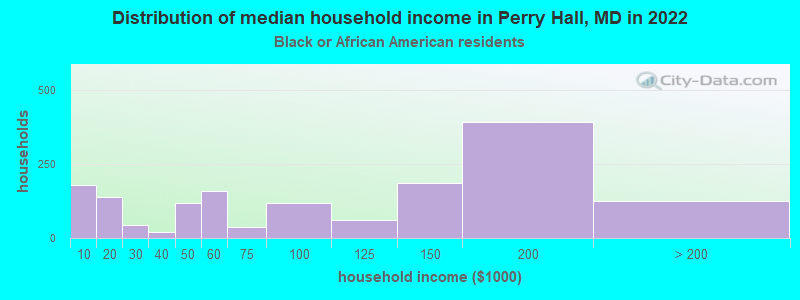
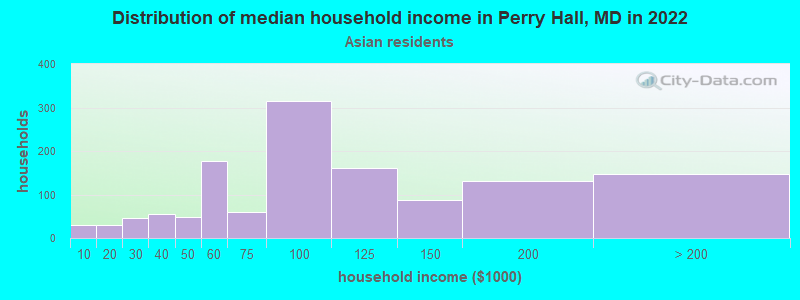
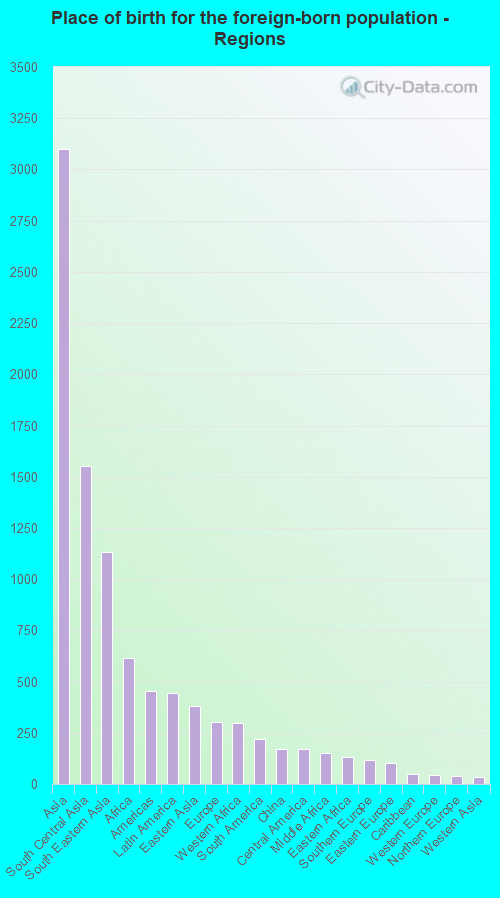
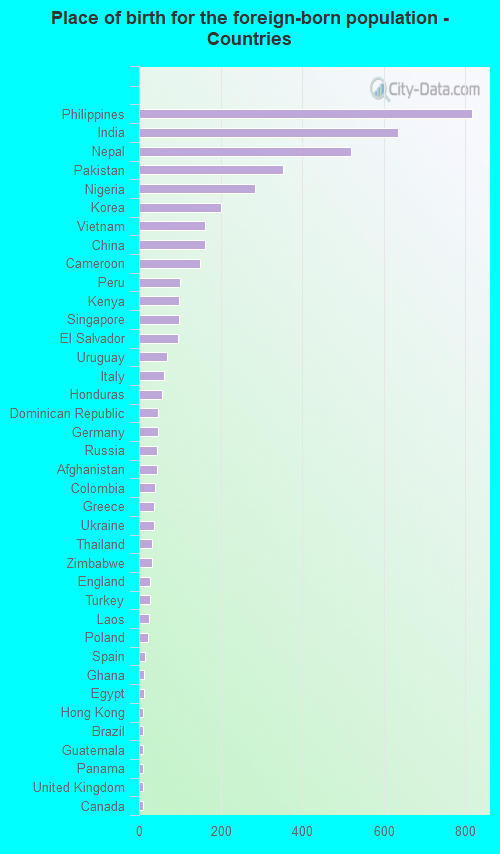
According to 2022 data, the most numerous races in Perry Hall, MD are White alone (17,061 residents), Black alone (4,769 residents), and Hispanic (1,759 residents). 80.6% of Perry Hall residents speak English at home. 15.4% of Perry Hall, MD residents are foreign-born (9.9% born in Asia, 2.0% born in Africa), which is 4.1% less than the foreign-born rate of 16.0% across the entire state of Maryland.
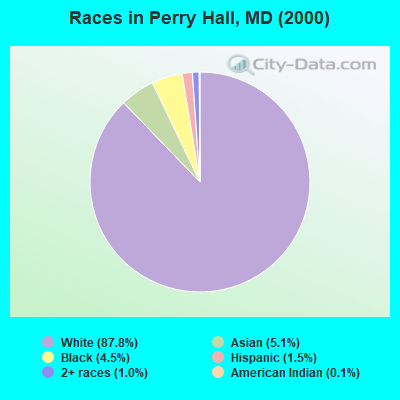
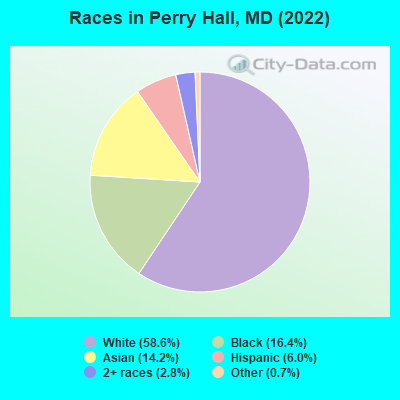
Race distribution in Perry Hall
2000 2022
3,286,547 62.1% White alone 1,464,735 27.7% Black alone 227,916 4.3% Hispanic 209,738 4.0% Asian alone 82,946 1.6% Two or more races 13,312 0.3% American Indian alone 9,379 0.2% Other race alone 1,913 0.04% Native Hawaiian and Other
2,906,492 47.1% White alone 1,800,914 29.2% Black alone 705,842 11.4% Hispanic 401,818 6.5% Asian alone 291,317 4.7% Two or more races 46,930 0.8% Other race alone 8,930 0.1% American Indian alone 2,417 0.04% Native Hawaiian and Other
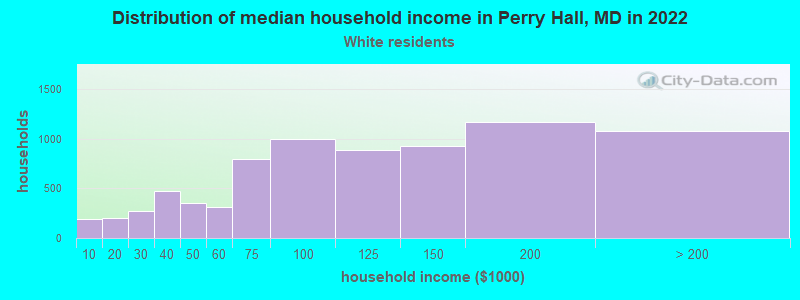
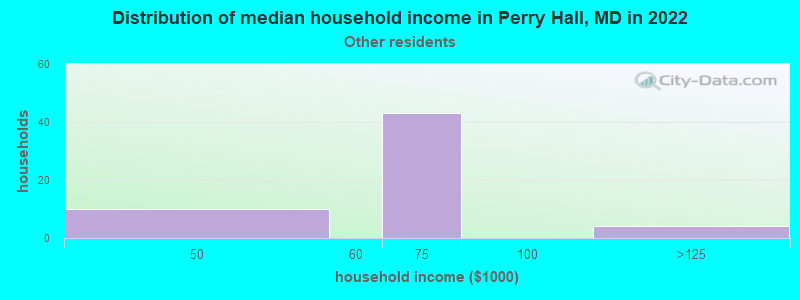
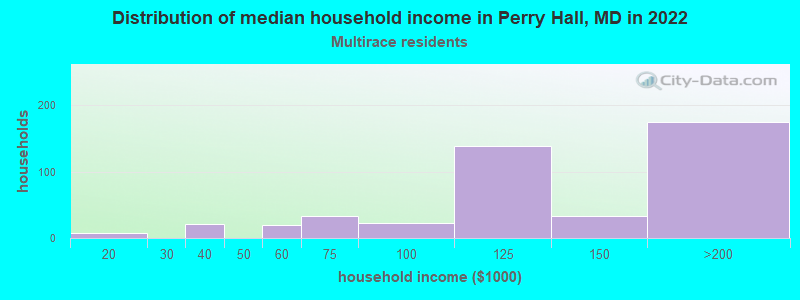
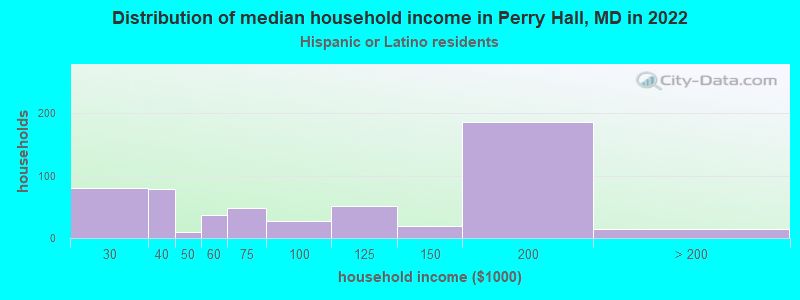
Income and house value in Perry Hall Median household income in 2022 $104,726 White non-Hispanic householders$95,130 Black householders$97,349 Asian householders$62,961 Some other race householders$148,070 Two or more races householders$124,005 Hispanic or Latino race householdersMedian 2022 house value $343,845 White Non-Hispanic householders$298,015 Black or African American householders $328,811 Asian householders$333,419 Some other race householders$349,423 Two or more races householders$303,108 Hispanic or Latino householders
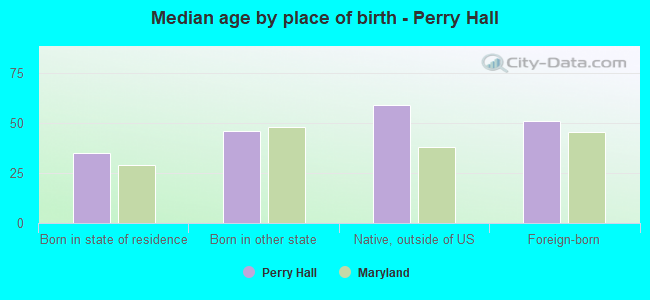
Median age by race in Perry Hall
48.0 Median age for White residents45.2 50.3 32.1 Median age for Black or African American residents24.9 37.0 -768,041,236.3 Median age for American Indian / Alaska Native residents-867,632,849.4 -677,419,354.2 37.8 Median age for Asian residents34.9 39.9 -1,541,125,539.6 Median age for Native Hawaiian / Pacific Islander residents-790,901,136.6 -760,942,760.2 17.5 Median age for Other race residents14.6 43.9 25.5 Median age for Two or more races residents30.7 20.8 48.1 Median age for White alone residents45.5 50.4 28.6 Median age for Hispanic or Latino residents26.2 35.5
Owner/renter occupied households by race in Perry Hall
House owners and renters - White residents 6,405 82.9% Owner occupied1,320 17.1% Renter occupiedHouse owners and renters - Black or African American residents 862 53.6% Owner occupied746 46.4% Renter occupiedHouse owners and renters - Asian residents 1,025 80.5% Owner occupied248 19.5% Renter occupiedHouse owners and renters - Other race residents 76 100.0% Owner occupiedHouse owners and renters - Two or more races residents 371 80.0% Owner occupied93 20.0% Renter occupiedHouse owners and renters - White alone residents 6,279 83.5% Owner occupied1,238 16.5% Renter occupiedHouse owners and renters - Hispanic or Latino residents 480 75.9% Owner occupied153 24.1% Renter occupied
Language usage in Perry Hall
English speakers - Total 80.6% of residents of Perry Hall speak English at home.
4.0% of residents speak Spanish at home 926 83.6% Speak English very well182 16.4% Speak English less than very well15.0% of residents speak other language at home 2,651 64.6% Speak English very well1,455 35.4% Speak English less than very well
English speakers - Born in the United States 94.9% of residents of Perry Hall speak English at home.
4.9% of residents speak Spanish at home 180 82.6% Speak English very well38 17.4% Speak English less than very well0.9% of residents speak other language at home 39 100.0% Speak English very well
English speakers - Native, born elsewhere 64.8% of residents of Perry Hall speak English at home.
29.9% of residents speak Spanish at home 84 100.0% Speak English very well4.3% of residents speak other language at home 12 100.0% Speak English very well
English speakers - Foreign-born 9.9% of residents of Perry Hall speak English at home.
8.6% of residents speak Spanish at home 338 88.5% Speak English very well44 11.5% Speak English less than very well77.3% of residents speak other language at home 2,027 59.1% Speak English very well1,404 40.9% Speak English less than very well
White (Caucasian) - Speak only English Native:
97.4% (15,792)Foreign-born:
39.1% (157)
White (Caucasian) - Speak another language Native:
2.6% (420)Foreign-born:
62.1% (249)
Black or African American - Speak only English Native:
99.5% (3,910)Foreign-born:
10.9% (64)
Black or African American - Speak another language Native:
0.9% (37)Foreign-born:
77.7% (457)
Asian - Speak only English Native:
52.7% (444)Foreign-born:
5.1% (149)
Asian - Speak another language Native:
47.4% (400)Foreign-born:
93.8% (2,715)
Other race - Speak only English Native:
30.7% (79)Foreign-born:
5.6% (10)
Other race - Speak another language Native:
68.8% (178)Foreign-born:
95.9% (176)
Two or more races - Speak only English Native:
66.2% (939)Foreign-born:
6.0% (19)
Two or more races - Speak another language Native:
23.1% (328)Foreign-born:
78.5% (248)
White alone - Speak only English Native:
97.8% (15,715)Foreign-born:
48.4% (155)
White alone - Speak another language Native:
2.1% (345)Foreign-born:
50.4% (162)
Hispanic or Latino - Speak only English Native:
42.8% (429)Foreign-born:
2.1% (10)
Hispanic or Latino - Speak another language Native:
53.1% (532)Foreign-born:
97.9% (440)
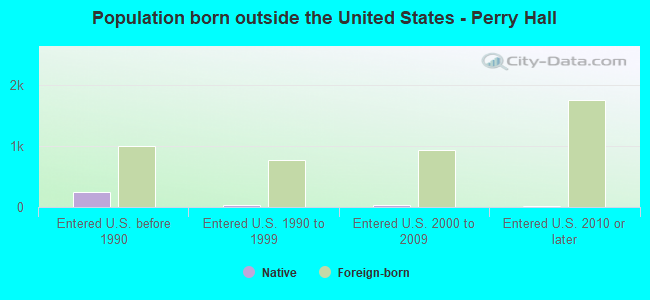
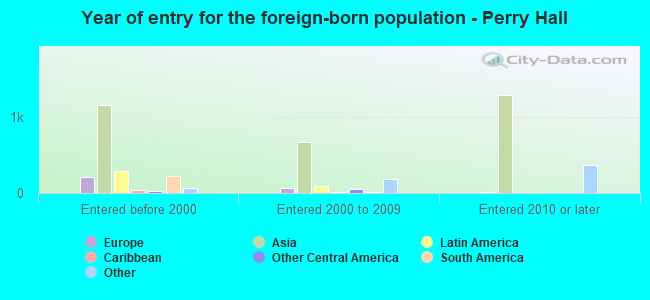
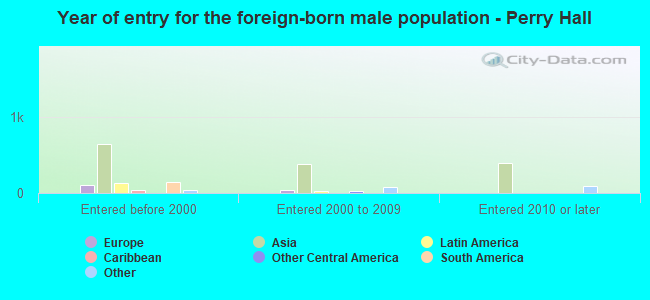
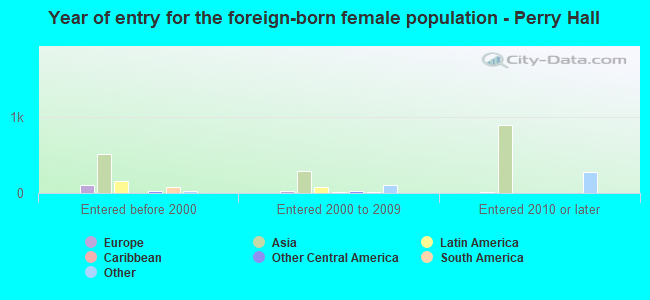
Foreign-born residents in Perry Hall 4,472 residents are foreign born (9.9% Asia , 2.0% Africa ).
This city:
15.4%Maryland:
15.7%
Marital status for residents in Perry Hall Marital status - White (Caucasian) population 15 years and over
Males 33.0% Never married54.0% Now married0.4% Separated3.1% Widowed9.5% DivorcedFemales 25.1% Never married52.4% Now married1.4% Separated8.6% Widowed12.5% DivorcedWomen who gave birth in the past 12 months Now married:
67.3% (71)Unmarried:
32.7% (35)
Women who did not give birth in the past 12 months Now married:
49.6% (1,660)Unmarried:
50.4% (1,690)
Marital status - Black or African American population 15 years and over
Males 35.7% Never married56.0% Now married0.6% Separated0.0% Widowed7.8% DivorcedFemales 36.2% Never married43.0% Now married5.2% Separated2.8% Widowed12.7% DivorcedWomen who gave birth in the past 12 months Now married:
48.9% (68)Unmarried:
51.1% (71)
Women who did not give birth in the past 12 months Now married:
52.2% (554)Unmarried:
47.8% (508)
Marital status - Asian population 15 years and over
Males 31.9% Never married66.9% Now married0.0% Separated0.0% Widowed1.1% DivorcedFemales 21.3% Never married61.4% Now married1.8% Separated11.1% Widowed4.4% DivorcedWomen who gave birth in the past 12 months Now married:
100.0% (14)Unmarried:
0.0% (0)
Women who did not give birth in the past 12 months Now married:
57.2% (536)Unmarried:
42.8% (401)
Marital status - Other race population 15 years and over
Males 0.0% Never married74.4% Now married25.6% Separated0.0% Widowed0.0% DivorcedFemales 33.7% Never married39.1% Now married4.9% Separated17.4% Widowed4.9% DivorcedWomen who did not give birth in the past 12 months Now married:
56.6% (119)Unmarried:
43.4% (91)
Marital status - Two or more races population 15 years and over
Males 70.5% Never married26.7% Now married0.0% Separated0.0% Widowed2.7% DivorcedFemales 39.3% Never married26.0% Now married0.0% Separated0.0% Widowed34.7% DivorcedWomen who did not give birth in the past 12 months Now married:
25.8% (81)Unmarried:
74.2% (234)
Marital status - White alone, not Hispanic / Latino population 15 years and over
Males 33.0% Never married53.8% Now married0.5% Separated3.1% Widowed9.6% DivorcedFemales 25.6% Never married52.1% Now married1.5% Separated8.8% Widowed12.0% DivorcedWomen who gave birth in the past 12 months Now married:
67.3% (72)Unmarried:
32.7% (35)
Women who did not give birth in the past 12 months Now married:
48.1% (1,567)Unmarried:
51.9% (1,691)
Marital status - Hispanic or Latino population 15 years and over
Males 51.6% Never married48.4% Now married0.0% Separated0.0% Widowed0.0% DivorcedFemales 22.0% Never married40.4% Now married1.6% Separated5.5% Widowed30.5% DivorcedWomen who did not give birth in the past 12 months Now married:
58.8% (205)Unmarried:
41.2% (144)
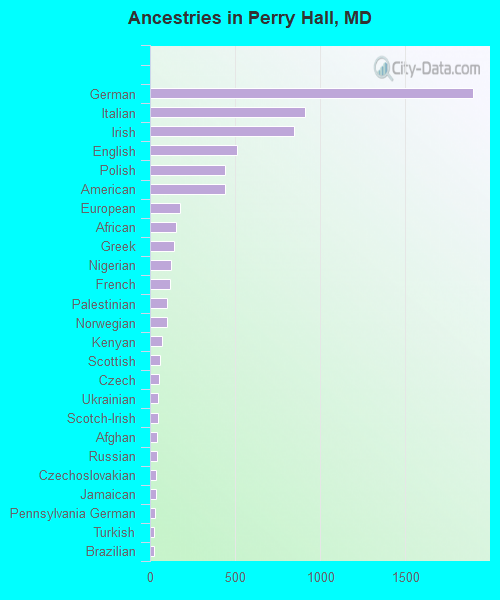
Ancestries in Perry Hall
1,897 12.1% German912 5.8% Italian849 5.4% Irish509 3.2% English441 2.8% Polish438 2.8% American179 1.1% European155 1.0% African139 0.9% Greek122 0.8% Nigerian117 0.7% French102 0.6% Palestinian102 0.6% Norwegian69 0.4% Kenyan58 0.4% Scottish55 0.4% Czech49 0.3% Ukrainian47 0.3% Scotch-Irish40 0.3% Afghan39 0.2% Russian38 0.2% Czechoslovakian38 0.2% Jamaican27 0.2% Pennsylvania German26 0.2% Turkish24 0.2% Brazilian23 0.1% Dutch22 0.1% Finnish21 0.1% Ghanaian18 0.1% Austrian17 0.1% Armenian17 0.1% Welsh16 0.1% Lithuanian15 0.10% Romanian11 0.07% British10 0.06% Danish9 0.06% Swiss7 0.04% Eastern European4 0.03% French Canadian
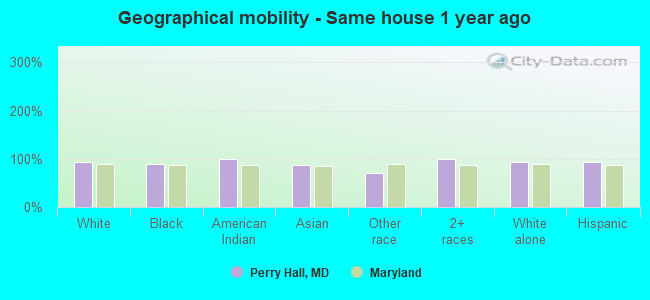
Geographical mobility in Perry Hall Same house 1 year ago 16,084 93.6% White (Caucasian)4,318 89.2% Black or African American9 98.9% American Indian / Alaska Native3,609 87.8% Asian365 71.1% Other race1,867 99.3% Two or more races15,887 93.6% White alone, not Hispanic / Latino1,575 92.7% Hispanic or LatinoMoved within same county 645 3.8% White / Caucasian176 3.6% Black or African American269 6.6% Asian116 22.7% Other race44 2.4% Two or more races646 3.8% White alone, not Hispanic / Latino155 9.1% Hispanic or LatinoMoved within same state 283 1.6% White / Caucasian343 7.1% Black or African American143 3.5% Asian13 0.7% Two or more races282 1.7% White alone, not Hispanic / LatinoMoved from different state 119 0.7% White / Caucasian120 0.7% White alone, not Hispanic / LatinoMoved from abroad 21 0.5% Asian
Children Nativity (place of birth) in Perry Hall
Children under 6 years - Living with two parents Both parents native 881 100.0% NativeBoth parents foreign-born 505 100.0% NativeOne native, one foreign-born parent 139 100.0% NativeChildren under 6 years - Living with one parent Native parent 498 100.0% NativeForeign-born parent 39 100.0% NativeChildren 6 to 17 years - Living with two parents Both parents native 1,577 100.0% NativeBoth parents foreign-born 734 85.0% Native129 15.0% Foreign-bornOne native, one foreign-born parent 426 100.0% NativeChildren 6 to 17 years - Living with one parent Native parent 1,043 100.0% NativeForeign-born parent 80 53.4% Native70 46.6% Foreign-born
Grandparents responsible for own grandchildren in Perry Hall
Grandparents (30 to 59 years) White / Caucasian 12 17.8% Responsible for grandchildren53 82.2% Not responsible for grandchildrenBlack or African American 18 100.0% Responsible for grandchildrenAsian 33 100.0% Not responsible for grandchildrenOther race 21 100.0% Not responsible for grandchildrenTwo or more races 96 100.0% Not responsible for grandchildrenWhite alone, not Hispanic / Latino 12 18.3% Responsible for grandchildren52 81.7% Not responsible for grandchildrenHispanic or Latino 99 100.0% Not responsible for grandchildren
Grandparents (60 years and over) White / Caucasian 202 100.0% Not responsible for grandchildrenAsian 196 100.0% Not responsible for grandchildrenTwo or more races 23 100.0% Not responsible for grandchildrenWhite alone, not Hispanic / Latino 210 100.0% Not responsible for grandchildrenHispanic or Latino 14 100.0% Not responsible for grandchildren