Races in Phillipston, Massachusetts (MA) Detailed Stats
Ancestries, Foreign-born residents, place of birth

Recent posts about races in Phillipston, Massachusetts on our local forum with over 2,400,000 registered users:
 | What cities/towns in MA would you avoid? (50 replies) |
| Living in Athol MA (10 replies) |
| Thoughts on possible relocation to Gardner, MA (35 replies) |
1.1% of Phillipston, MA residents are foreign-born , which is 1521.0% less than the foreign-born rate of 18.0% across the entire state of Massachusetts.
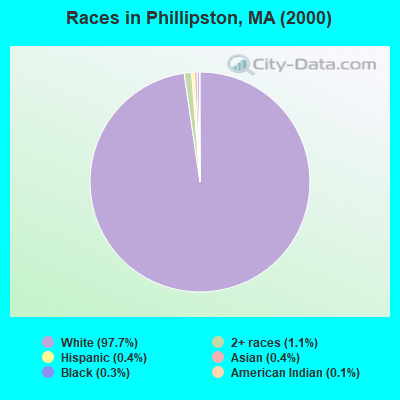
Race distribution in Phillipston

- 1,58397.7%White alone
- 181.1%Two or more races
- 70.4%Hispanic
- 60.4%Asian alone
- 50.3%Black alone
- 20.1%American Indian alone
2000
2022
-
- 5,198,35981.9%White alone
- 428,7296.8%Hispanic
- 318,3295.0%Black alone
- 236,7863.7%Asian alone
- 110,3381.7%Two or more races
- 43,5860.7%Other race alone
- 11,2640.2%American Indian alone
- 1,7060.03%Native Hawaiian and Other
Pacific Islander alone

-
- 4,676,62767.0%White alone
- 911,03813.0%Hispanic
- 501,4637.2%Asian alone
- 459,7406.6%Black alone
- 341,8894.9%Two or more races
- 84,4031.2%Other race alone
- 5,8380.08%American Indian alone
- 9760.01%Native Hawaiian and Other
Pacific Islander alone

Income and house value in Phillipston
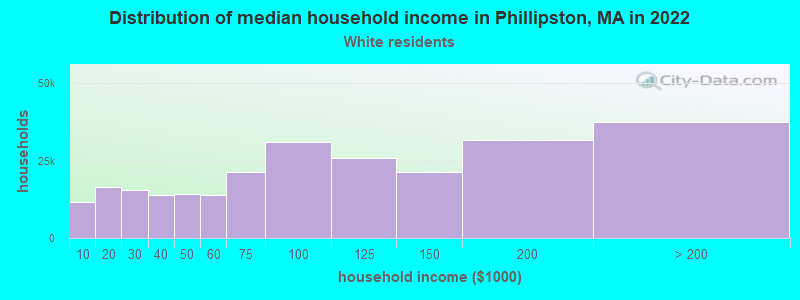
- Median household income in 2022
- $86,942White non-Hispanic householders
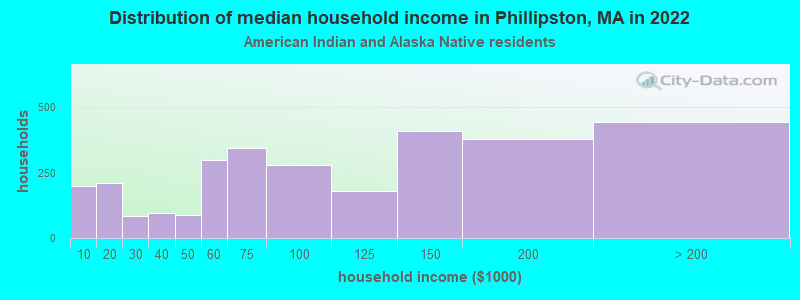
- $53,090American Indian and Alaska Native householders
- Median 2022 house value
- $317,304White Non-Hispanic householders
Household income for White non-Hispanic householders
Household income for American Indian and Alaska Native householders
Foreign-born residents in Phillipston
18 residents are foreign born
| This city: | 1.1% |
| Massachusetts: | 12.2% |
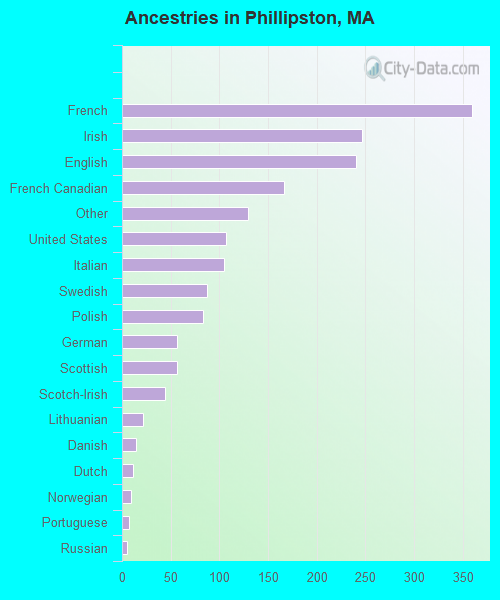
Ancestries in Phillipston

- 35920.4%French
- 24614.0%Irish
- 24013.6%English
- 1669.4%French Canadian
- 1297.3%Other
- 1076.1%United States
- 1056.0%Italian
- 874.9%Swedish
- 834.7%Polish
- 573.2%German
- 573.2%Scottish
- 442.5%Scotch-Irish
- 221.2%Lithuanian
- 140.8%Danish
- 110.6%Dutch
- 90.5%Norwegian
- 70.4%Portuguese
- 50.3%Russian
- 30.2%Czech
- 30.2%Greek
- 20.1%Arab
- 20.1%Ukrainian
- 20.1%Welsh
Zip codes: 01331.