Races in Phoenix, Georgia (GA) Detailed Stats
Ancestries, Foreign-born residents, place of birth
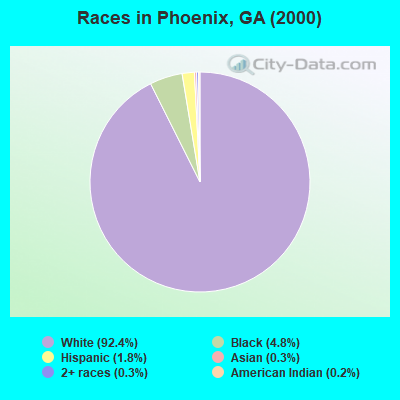
Race distribution in Phoenix

- 5,35892.4%White alone
- 2804.8%Black alone
- 1031.8%Hispanic
- 190.3%Asian alone
- 170.3%Two or more races
- 140.2%American Indian alone
- 50.09%Other race alone
2000
2022
-
- 5,128,66162.6%White alone
- 2,331,46528.5%Black alone
- 435,2275.3%Hispanic
- 171,5132.1%Asian alone
- 87,3641.1%Two or more races
- 17,6700.2%American Indian alone
- 11,2750.1%Other race alone
- 3,2780.04%Native Hawaiian and Other
Pacific Islander alone

-
- 5,415,65749.6%White alone
- 3,349,24030.7%Black alone
- 1,132,60410.4%Hispanic
- 479,1564.4%Asian alone
- 462,9234.2%Two or more races
- 54,4160.5%Other race alone
- 11,9230.1%American Indian alone
- 6,9570.06%Native Hawaiian and Other
Pacific Islander alone

Income and house value in Phoenix
- Median household income in 2022
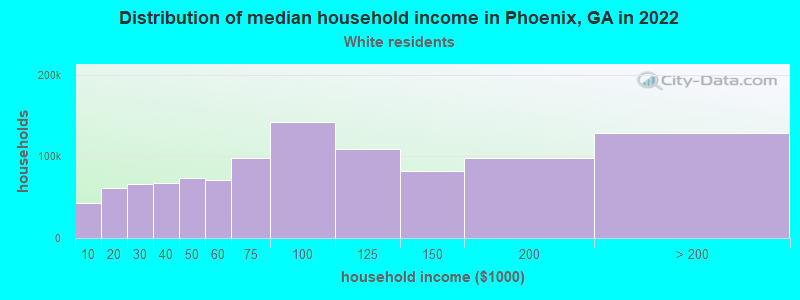
- $76,955White non-Hispanic householders
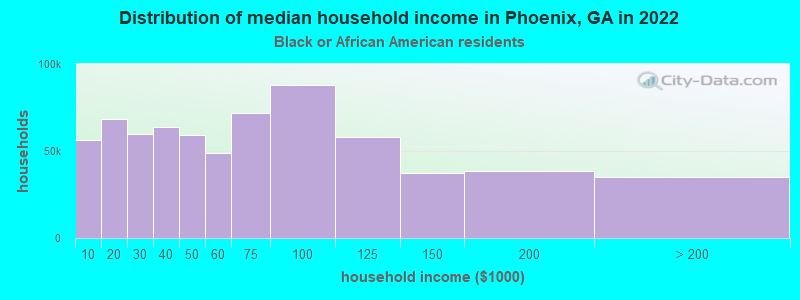
- $60,010Black householders
- over $200,000Some other race householders
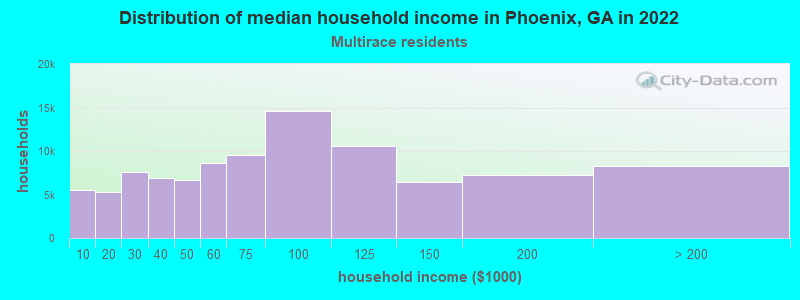
- $55,868Two or more races householders
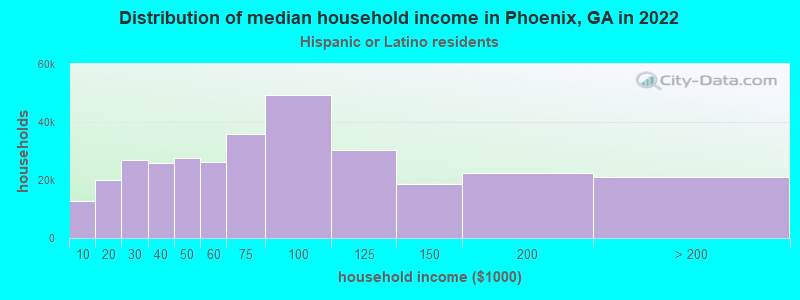
- $154,480Hispanic or Latino race householders
- Median 2022 house value
- $484,697White Non-Hispanic householders
- $379,993Black or African American householders
- $101,468Two or more races householders
- $279,406Hispanic or Latino householders
Household income for White non-Hispanic householders
Household income for Black householders
Household income for Two or more races householders
Household income for Hispanic or Latino race householders
Zip code: 31024