Races in Pigeon Forge, Tennessee (TN) Detailed Stats
Data:
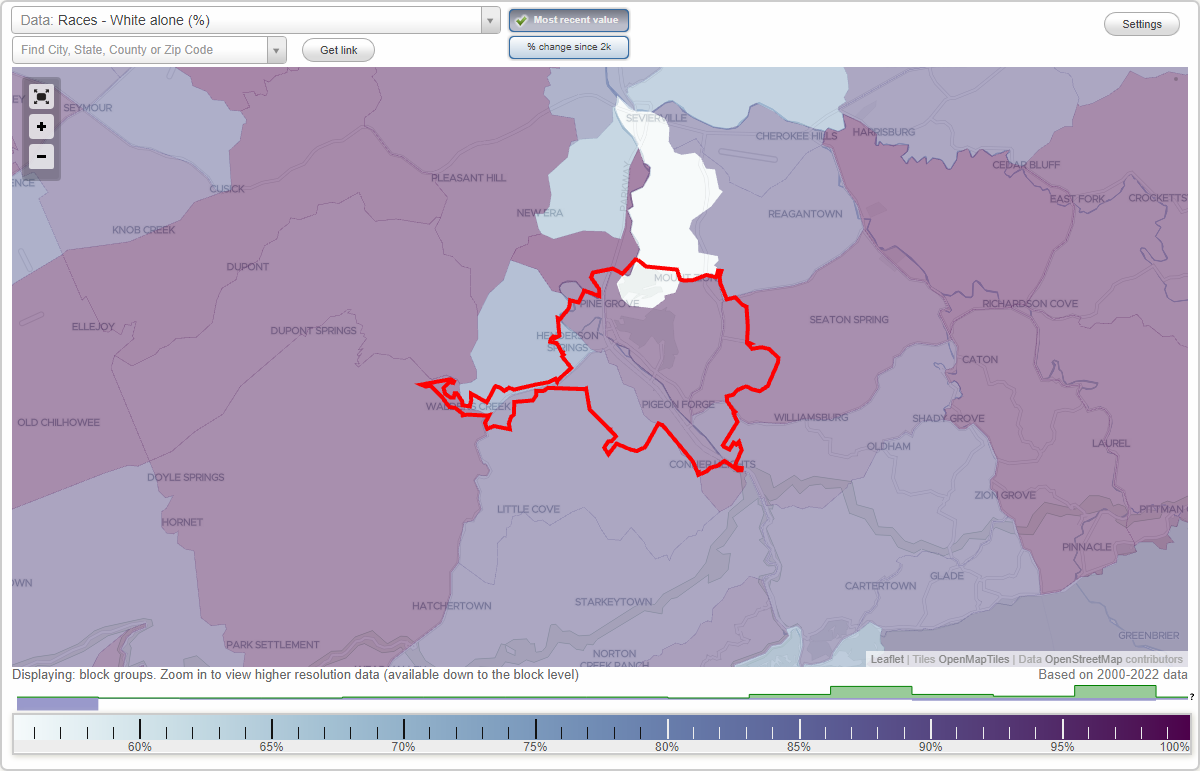
Races - White alone (%)
Races - White alone (% change since 2000)
Races - Black alone (%)
Races - Black alone (% change since 2000)
Races - American Indian alone (%)
Races - American Indian alone (% change since 2000)
Races - Asian alone (%)
Races - Asian alone (% change since 2000)
Races - Hispanic (%)
Races - Hispanic (% change since 2000)
Races - Native Hawaiian and Other Pacific Islander alone (%)
Races - Native Hawaiian and Other Pacific Islander alone (% change since 2000)
Races - Two or more races(%)
Races - Two or more races(% change since 2000)
Races - Other race alone (%)
Races - Other race alone (% change since 2000)
Racial diversity
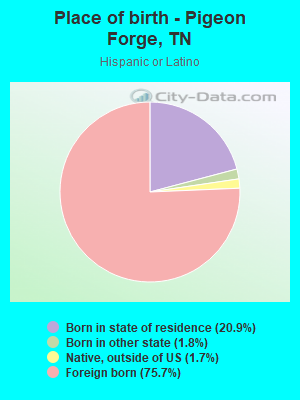
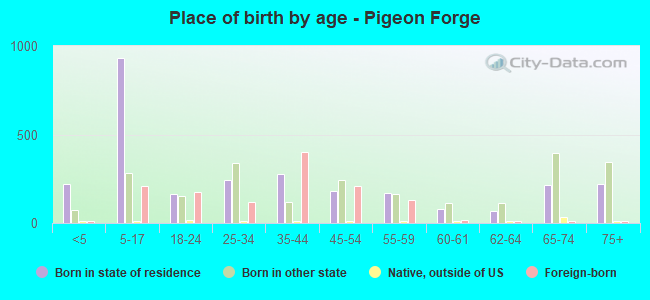
Place of birth - Born in state of residence (%)
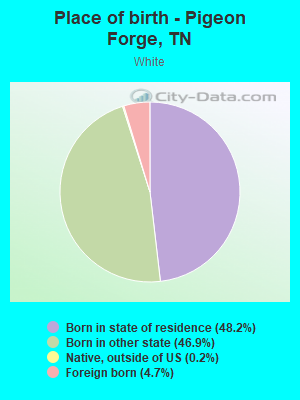
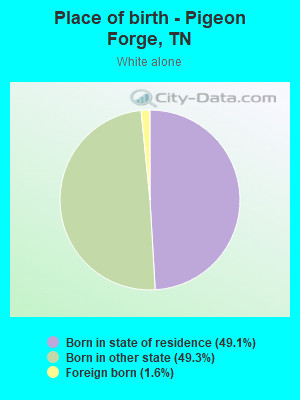
Place of birth - Born in state of residence (%) - White
Place of birth - Born in state of residence (%) - Black or African American
Place of birth - Born in state of residence (%) - Asian
Place of birth - Born in state of residence (%) - Hispanic or Latino
Place of birth - Born in state of residence (%) - American Indian and Alaska Native
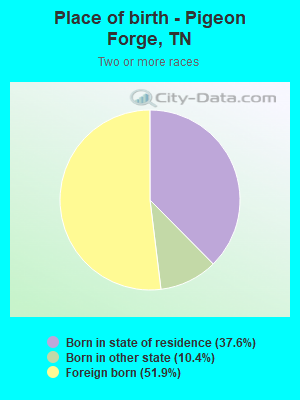
Place of birth - Born in state of residence (%) - Multirace
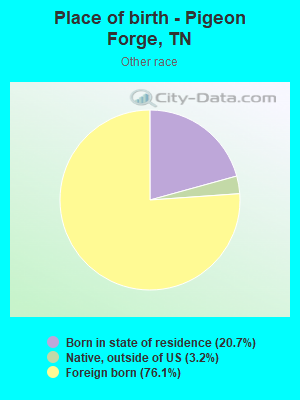
Place of birth - Born in state of residence (%) - Other Race
Place of birth - Born in other state (%)
Place of birth - Born in other state (%) - White
Place of birth - Born in other state (%) - Black or African American
Place of birth - Born in other state (%) - Asian
Place of birth - Born in other state (%) - Hispanic or Latino
Place of birth - Born in other state (%) - American Indian and Alaska Native
Place of birth - Born in other state (%) - Multirace
Place of birth - Born in other state (%) - Other Race
Place of birth - Native, outside of US (%)
Place of birth - Native, outside of US (%) - White
Place of birth - Native, outside of US (%) - Black or African American
Place of birth - Native, outside of US (%) - Asian
Place of birth - Native, outside of US (%) - Hispanic or Latino
Place of birth - Native, outside of US (%) - American Indian and Alaska Native
Place of birth - Native, outside of US (%) - Multirace
Place of birth - Native, outside of US (%) - Other Race
Place of birth - Foreign born (%)
Place of birth - Foreign born (%) - White
Place of birth - Foreign born (%) - Black or African American
Place of birth - Foreign born (%) - Asian
Place of birth - Foreign born (%) - Hispanic or Latino
Place of birth - Foreign born (%) - American Indian and Alaska Native
Place of birth - Foreign born (%) - Multirace
Place of birth - Foreign born (%) - Other Race
Residents speaking English at home (%)
Residents speaking English at home - Born in the United States (%)
Residents speaking English at home - Native, born elsewhere (%)
Residents speaking English at home - Foreign born (%)
Residents speaking Spanish at home (%)
Residents speaking Spanish at home - Born in the United States (%)
Residents speaking Spanish at home - Native, born elsewhere (%)
Residents speaking Spanish at home - Foreign born (%)
Residents speaking other language at home (%)
Residents speaking other language at home - Born in the United States (%)
Residents speaking other language at home - Native, born elsewhere (%)
Residents speaking other language at home - Foreign born (%)
Marital status - Never married (%)
Marital status - Now married (%)
Marital status - Separated (%)
Marital status - Widowed (%)
Marital status - Divorced (%)
Ancestries Reported - Arab (%)
Ancestries Reported - Czech (%)
Ancestries Reported - Danish (%)
Ancestries Reported - Dutch (%)
Ancestries Reported - English (%)
Ancestries Reported - French (%)
Ancestries Reported - French Canadian (%)
Ancestries Reported - German (%)
Ancestries Reported - Greek (%)
Ancestries Reported - Hungarian (%)
Ancestries Reported - Irish (%)
Ancestries Reported - Italian (%)
Ancestries Reported - Lithuanian (%)
Ancestries Reported - Norwegian (%)
Ancestries Reported - Polish (%)
Ancestries Reported - Portuguese (%)
Ancestries Reported - Russian (%)
Ancestries Reported - Scotch-Irish (%)
Ancestries Reported - Scottish (%)
Ancestries Reported - Slovak (%)
Ancestries Reported - Subsaharan African (%)
Ancestries Reported - Swedish (%)
Ancestries Reported - Swiss (%)
Ancestries Reported - Ukrainian (%)
Ancestries Reported - United States (%)
Ancestries Reported - Welsh (%)
Ancestries Reported - West Indian (%)
Ancestries Reported - Other (%)
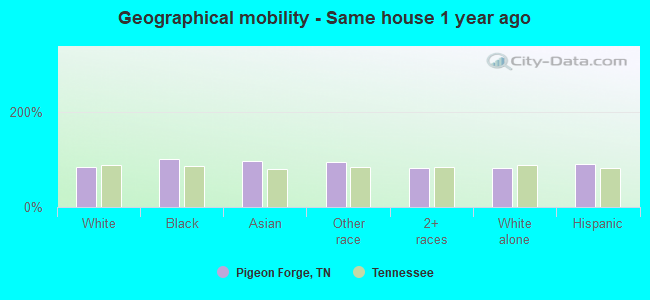
Geographical mobility - Same house 1 year ago (%)
Geographical mobility - Same house 1 year ago (%) - White
Geographical mobility - Same house 1 year ago (%) - Black or African American
Geographical mobility - Same house 1 year ago (%) - Asian
Geographical mobility - Same house 1 year ago (%) - Hispanic or Latino
Geographical mobility - Same house 1 year ago (%) - American Indian and Alaska Native
Geographical mobility - Same house 1 year ago (%) - Multirace
Geographical mobility - Same house 1 year ago (%) - Other Race
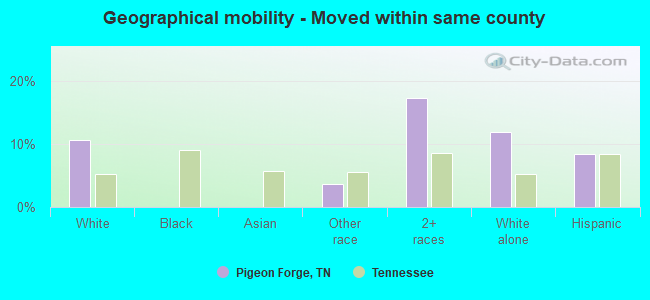
Geographical mobility - Moved within same county (%)
Geographical mobility - Moved within same county (%) - White
Geographical mobility - Moved within same county (%) - Black or African American
Geographical mobility - Moved within same county (%) - Asian
Geographical mobility - Moved within same county (%) - Hispanic or Latino
Geographical mobility - Moved within same county (%) - American Indian and Alaska Native
Geographical mobility - Moved within same county (%) - Multirace
Geographical mobility - Moved within same county (%) - Other Race
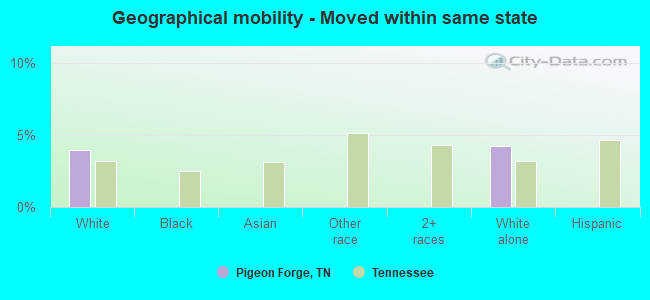
Geographical mobility - Moved from different county within same state (%)
Geographical mobility - Moved from different county within same state (%) - White
Geographical mobility - Moved from different county within same state (%) - Black or African American
Geographical mobility - Moved from different county within same state (%) - Asian
Geographical mobility - Moved from different county within same state (%) - Hispanic or Latino
Geographical mobility - Moved from different county within same state (%) - American Indian and Alaska Native
Geographical mobility - Moved from different county within same state (%) - Multirace
Geographical mobility - Moved from different county within same state (%) - Other Race
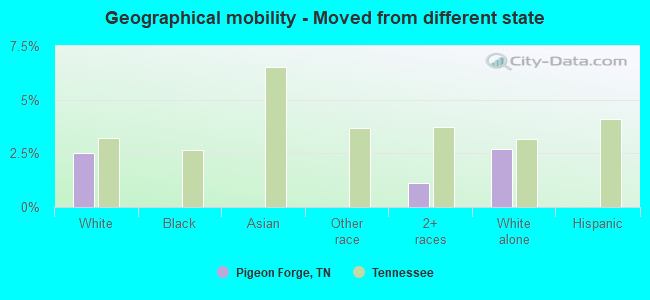
Geographical mobility - Moved from different state (%)
Geographical mobility - Moved from different state (%) - White
Geographical mobility - Moved from different state (%) - Black or African American
Geographical mobility - Moved from different state (%) - Asian
Geographical mobility - Moved from different state (%) - Hispanic or Latino
Geographical mobility - Moved from different state (%) - American Indian and Alaska Native
Geographical mobility - Moved from different state (%) - Multirace
Geographical mobility - Moved from different state (%) - Other Race
Geographical mobility - Moved from abroad (%)
Geographical mobility - Moved from abroad (%) - White
Geographical mobility - Moved from abroad (%) - Black or African American
Geographical mobility - Moved from abroad (%) - Asian
Geographical mobility - Moved from abroad (%) - Hispanic or Latino
Geographical mobility - Moved from abroad (%) - American Indian and Alaska Native
Geographical mobility - Moved from abroad (%) - Multirace
Geographical mobility - Moved from abroad (%) - Other Race
Place of birth for the foreign-born population - Ireland (%)
Place of birth for the foreign-born population - Denmark (%)
Place of birth for the foreign-born population - Norway (%)
Place of birth for the foreign-born population - Sweden (%)
Place of birth for the foreign-born population - United Kingdom (%)
Place of birth for the foreign-born population - England (%)
Place of birth for the foreign-born population - Scotland (%)
Place of birth for the foreign-born population - Other Northern Europe (%)
Place of birth for the foreign-born population - Austria (%)
Place of birth for the foreign-born population - Belgium (%)
Place of birth for the foreign-born population - France (%)
Place of birth for the foreign-born population - Germany (%)
Place of birth for the foreign-born population - Netherlands (%)
Place of birth for the foreign-born population - Switzerland (%)
Place of birth for the foreign-born population - Other Western Europe (%)
Place of birth for the foreign-born population - Greece (%)
Place of birth for the foreign-born population - Italy (%)
Place of birth for the foreign-born population - Portugal (%)
Place of birth for the foreign-born population - Spain (%)
Place of birth for the foreign-born population - Other Southern Europe (%)
Place of birth for the foreign-born population - Albania (%)
Place of birth for the foreign-born population - Belarus (%)
Place of birth for the foreign-born population - Bosnia and Herzegovina (%)
Place of birth for the foreign-born population - Bulgaria (%)
Place of birth for the foreign-born population - Croatia (%)
Place of birth for the foreign-born population - Czechoslovakia (%)
Place of birth for the foreign-born population - Hungary (%)
Place of birth for the foreign-born population - Latvia (%)
Place of birth for the foreign-born population - Lithuania (%)
Place of birth for the foreign-born population - North Macedonia (Macedonia) (%)
Place of birth for the foreign-born population - Moldova (%)
Place of birth for the foreign-born population - Poland (%)
Place of birth for the foreign-born population - Romania (%)
Place of birth for the foreign-born population - Russia (%)
Place of birth for the foreign-born population - Serbia (%)
Place of birth for the foreign-born population - Ukraine (%)
Place of birth for the foreign-born population - Other Eastern Europe (%)
Place of birth for the foreign-born population - China (%)
Place of birth for the foreign-born population - Hong Kong (%)
Place of birth for the foreign-born population - Taiwan (%)
Place of birth for the foreign-born population - Japan (%)
Place of birth for the foreign-born population - Korea (%)
Place of birth for the foreign-born population - Other Eastern Asia (%)
Place of birth for the foreign-born population - Afghanistan (%)
Place of birth for the foreign-born population - Bangladesh (%)
Place of birth for the foreign-born population - India (%)
Place of birth for the foreign-born population - Iran (%)
Place of birth for the foreign-born population - Kazakhstan (%)
Place of birth for the foreign-born population - Nepal (%)
Place of birth for the foreign-born population - Pakistan (%)
Place of birth for the foreign-born population - Sri Lanka (%)
Place of birth for the foreign-born population - Uzbekistan (%)
Place of birth for the foreign-born population - Other South Central Asia (%)
Place of birth for the foreign-born population - Burma (%)
Place of birth for the foreign-born population - Cambodia (%)
Place of birth for the foreign-born population - Indonesia (%)
Place of birth for the foreign-born population - Laos (%)
Place of birth for the foreign-born population - Malaysia (%)
Place of birth for the foreign-born population - Philippines (%)
Place of birth for the foreign-born population - Singapore (%)
Place of birth for the foreign-born population - Thailand (%)
Place of birth for the foreign-born population - Vietnam (%)
Place of birth for the foreign-born population - Other South Eastern Asia (%)
Place of birth for the foreign-born population - Armenia (%)
Place of birth for the foreign-born population - Iraq (%)
Place of birth for the foreign-born population - Israel (%)
Place of birth for the foreign-born population - Jordan (%)
Place of birth for the foreign-born population - Kuwait (%)
Place of birth for the foreign-born population - Lebanon (%)
Place of birth for the foreign-born population - Saudi Arabia (%)
Place of birth for the foreign-born population - Syria (%)
Place of birth for the foreign-born population - Turkey (%)
Place of birth for the foreign-born population - Yemen (%)
Place of birth for the foreign-born population - Other Western Asia (%)
Place of birth for the foreign-born population - Eritrea (%)
Place of birth for the foreign-born population - Ethiopia (%)
Place of birth for the foreign-born population - Kenya (%)
Place of birth for the foreign-born population - Somalia (%)
Place of birth for the foreign-born population - Uganda (%)
Place of birth for the foreign-born population - Zimbabwe (%)
Place of birth for the foreign-born population - Other Eastern Africa (%)
Place of birth for the foreign-born population - Cameroon (%)
Place of birth for the foreign-born population - Congo (%)
Place of birth for the foreign-born population - Democratic Republic of Congo (Zaire) (%)
Place of birth for the foreign-born population - Other Middle Africa (%)
Place of birth for the foreign-born population - Egypt (%)
Place of birth for the foreign-born population - Morocco (%)
Place of birth for the foreign-born population - Sudan (%)
Place of birth for the foreign-born population - Other Northern Africa (%)
Place of birth for the foreign-born population - South Africa (%)
Place of birth for the foreign-born population - Other Southern Africa (%)
Place of birth for the foreign-born population - Cabo Verde (%)
Place of birth for the foreign-born population - Ghana (%)
Place of birth for the foreign-born population - Liberia (%)
Place of birth for the foreign-born population - Nigeria (%)
Place of birth for the foreign-born population - Senegal (%)
Place of birth for the foreign-born population - Sierra Leone (%)
Place of birth for the foreign-born population - Other Western Africa (%)
Place of birth for the foreign-born population - Australia (%)
Place of birth for the foreign-born population - New Zealand (%)
Place of birth for the foreign-born population - Fiji (%)
Place of birth for the foreign-born population - Micronesia (%)
Place of birth for the foreign-born population - Bahamas (%)
Place of birth for the foreign-born population - Barbados (%)
Place of birth for the foreign-born population - Cuba (%)
Place of birth for the foreign-born population - Dominica (%)
Place of birth for the foreign-born population - Dominican Republic (%)
Place of birth for the foreign-born population - Grenada (%)
Place of birth for the foreign-born population - Haiti (%)
Place of birth for the foreign-born population - Jamaica (%)
Place of birth for the foreign-born population - St. Vincent and the Grenadines (%)
Place of birth for the foreign-born population - Trinidad and Tobago (%)
Place of birth for the foreign-born population - West Indies (%)
Place of birth for the foreign-born population - Other Caribbean (%)
Place of birth for the foreign-born population - Belize (%)
Place of birth for the foreign-born population - Costa Rica (%)
Place of birth for the foreign-born population - El Salvador (%)
Place of birth for the foreign-born population - Guatemala (%)
Place of birth for the foreign-born population - Honduras (%)
Place of birth for the foreign-born population - Mexico (%)
Place of birth for the foreign-born population - Nicaragua (%)
Place of birth for the foreign-born population - Panama (%)
Place of birth for the foreign-born population - Other Central America (%)
Place of birth for the foreign-born population - Argentina (%)
Place of birth for the foreign-born population - Bolivia (%)
Place of birth for the foreign-born population - Brazil (%)
Place of birth for the foreign-born population - Chile (%)
Place of birth for the foreign-born population - Colombia (%)
Place of birth for the foreign-born population - Ecuador (%)
Place of birth for the foreign-born population - Guyana (%)
Place of birth for the foreign-born population - Peru (%)
Place of birth for the foreign-born population - Uruguay (%)
Place of birth for the foreign-born population - Venezuela (%)
Place of birth for the foreign-born population - Other South America (%)
Place of birth for the foreign-born population - Canada (%)
Place of birth for the foreign-born population - Other Northern America (%)
Place of birth for the foreign-born population - Other (%)
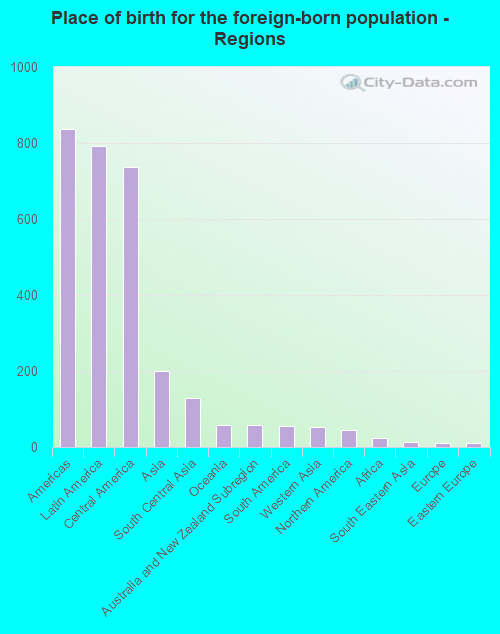
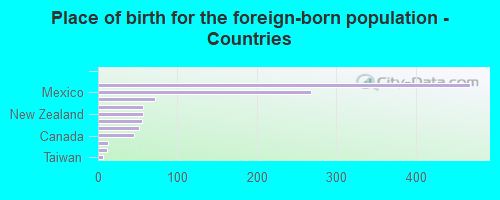
According to 2022 data, the most numerous races in Pigeon Forge, TN are White alone (4,685 residents), Black alone (42 residents), and Hispanic (1,266 residents). 76.3% of Pigeon Forge residents speak English at home. 17.8% of Pigeon Forge, TN residents are foreign-born (12.0% born in Latin America, 3.0% born in Asia), which is 71.9% greater than the foreign-born rate of 5.0% across the entire state of Tennessee.
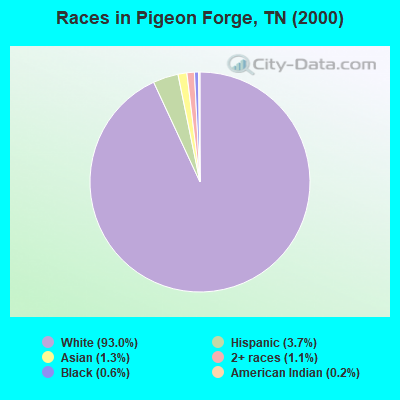
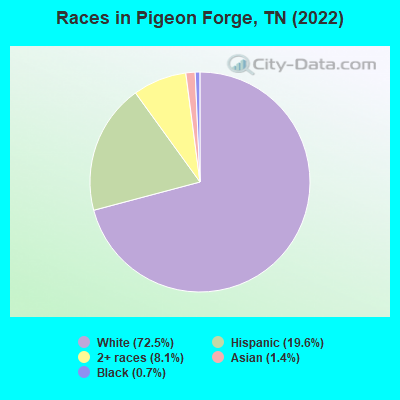
Race distribution in Pigeon Forge
2000 2022
4,505,930 79.2% White alone 928,204 16.3% Black alone 123,838 2.2% Hispanic 54,824 1.0% Two or more races 56,077 1.0% Asian alone 13,820 0.2% American Indian alone 4,780 0.08% Other race alone 1,810 0.03% Native Hawaiian and Other
5,070,026 71.9% White alone 1,089,738 15.5% Black alone 442,629 6.3% Hispanic 279,381 4.0% Two or more races 131,817 1.9% Asian alone 26,972 0.4% Other race alone 6,387 0.09% American Indian alone 4,389 0.06% Native Hawaiian and Other
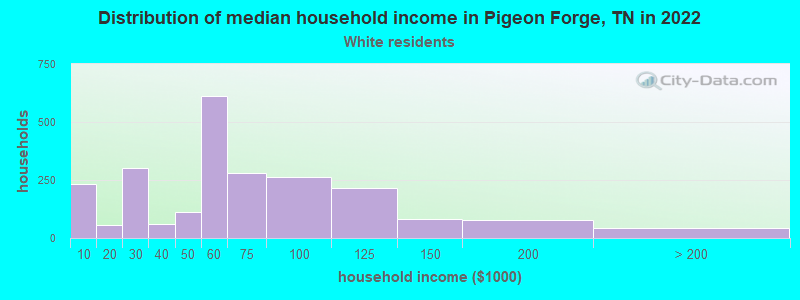
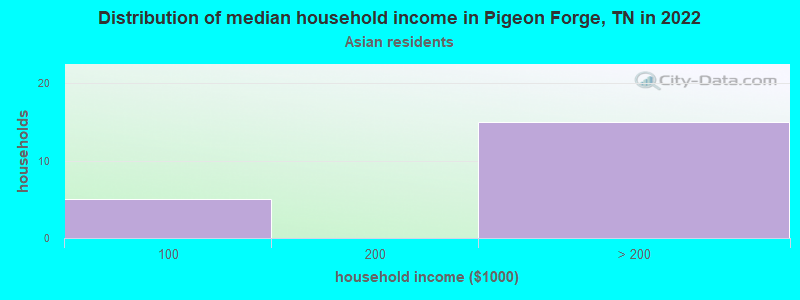
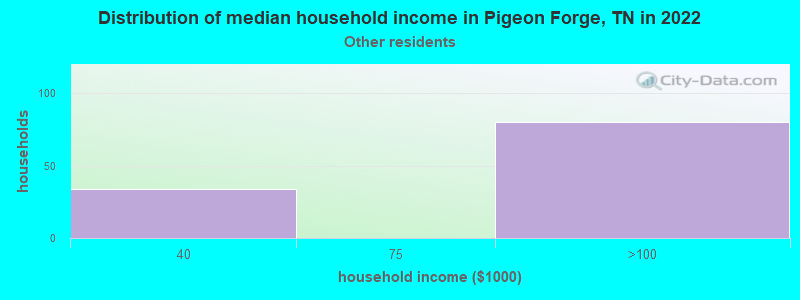
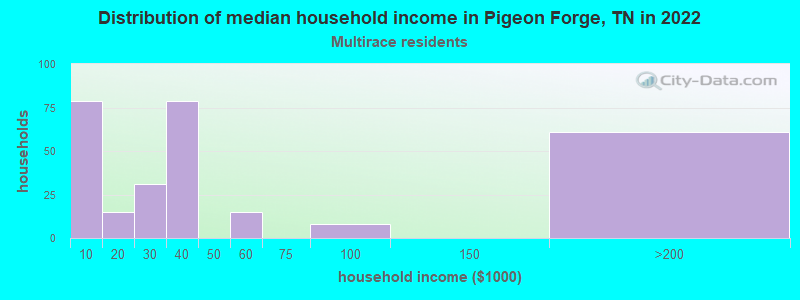
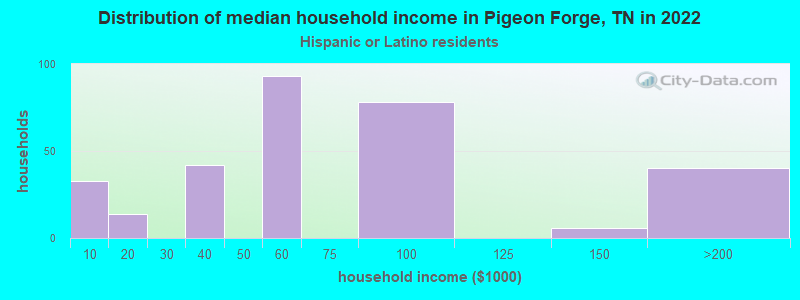
Income and house value in Pigeon Forge Median household income in 2022 $55,235 White non-Hispanic householders$80,601 Some other race householders$29,852 Two or more races householders$63,535 Hispanic or Latino race householdersMedian 2022 house value $364,915 White Non-Hispanic householders
Median age by race in Pigeon Forge
44.5 Median age for White residents41.4 50.3 -1,245,495,494.2 Median age for Black or African American residents-714,725,815.7 -1,368,029,738.4 -557,471,263.8 Median age for American Indian / Alaska Native residents-633,911,367.4 -667,936,507.3 32.3 Median age for Asian residents37.3 27.5 -666,666,666.0 Median age for Native Hawaiian / Pacific Islander residents-666,666,666.0 -666,666,666.0 16.0 Median age for Other race residents16.5 22.5 27.0 Median age for Two or more races residents13.9 51.6 45.3 Median age for White alone residents44.2 52.0 21.4 Median age for Hispanic or Latino residents15.4 42.9
Owner/renter occupied households by race in Pigeon Forge
House owners and renters - White residents 1,056 46.9% Owner occupied1,195 53.1% Renter occupiedHouse owners and renters - Black or African American residents 33 100.0% Renter occupiedHouse owners and renters - Asian residents 16 100.0% Renter occupiedHouse owners and renters - Other race residents 155 100.0% Renter occupiedHouse owners and renters - Two or more races residents 108 36.3% Owner occupied190 63.7% Renter occupiedHouse owners and renters - White alone residents 1,053 49.0% Owner occupied1,095 51.0% Renter occupiedHouse owners and renters - Hispanic or Latino residents 43 13.1% Owner occupied283 86.9% Renter occupied
Language usage in Pigeon Forge
English speakers - Total 76.3% of residents of Pigeon Forge speak English at home.
19.8% of residents speak Spanish at home 598 49.5% Speak English very well609 50.5% Speak English less than very well5.7% of residents speak other language at home 268 77.2% Speak English very well79 22.8% Speak English less than very well
English speakers - Born in the United States 94.7% of residents of Pigeon Forge speak English at home.
2.5% of residents speak Spanish at home 51 87.9% Speak English very well7 12.1% Speak English less than very well4.6% of residents speak other language at home 96 90.6% Speak English very well10 9.4% Speak English less than very well
English speakers - Native, born elsewhere 70.8% of residents of Pigeon Forge speak English at home.
37.5% of residents speak Spanish at home 9 100.0% Speak English very well
English speakers - Foreign-born 5.4% of residents of Pigeon Forge speak English at home.
87.4% of residents speak Spanish at home 310 28.0% Speak English very well797 72.0% Speak English less than very well15.9% of residents speak other language at home 132 65.7% Speak English very well69 34.3% Speak English less than very well
White (Caucasian) - Speak only English Native:
95.2% (4,280)Foreign-born:
32.4% (74)
White (Caucasian) - Speak another language Native:
4.0% (178)Foreign-born:
68.5% (157)
Other race - Speak another language Native:
100.0% (51)Foreign-born:
100.0% (687)
Two or more races - Speak another language Native:
17.8% (70)Foreign-born:
100.0% (434)
White alone - Speak only English Native:
97.1% (4,282)Foreign-born:
100.0% (73)
White alone - Speak another language Native:
3.1% (136)Foreign-born:
8.8% (6)
Hispanic or Latino - Speak another language Native:
90.3% (163)Foreign-born:
100.0% (1,088)
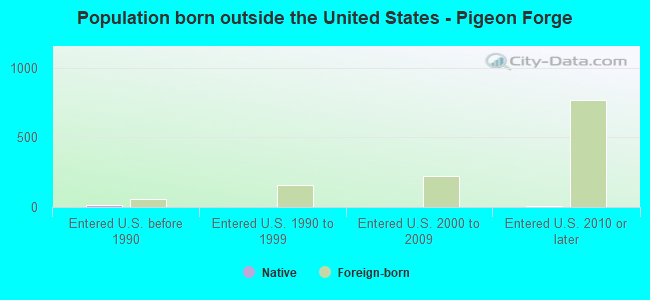
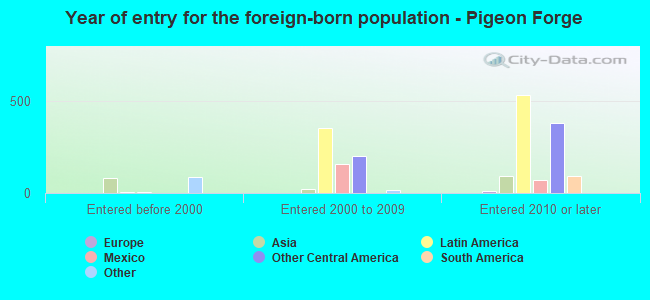
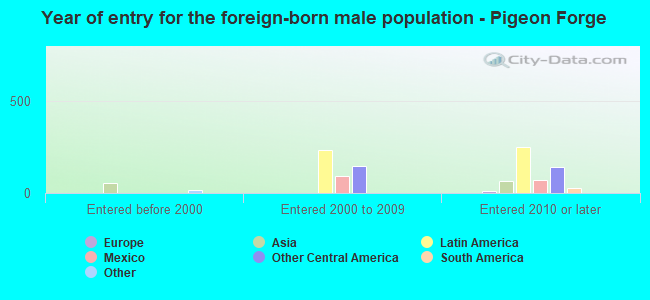
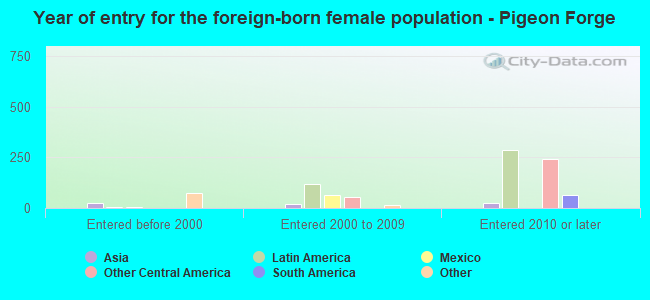
Foreign-born residents in Pigeon Forge 1,133 residents are foreign born (12.0% Latin America , 3.0% Asia ).
This city:
17.8%Tennessee:
5.4%
Marital status for residents in Pigeon Forge Marital status - White (Caucasian) population 15 years and over
Males 38.2% Never married45.5% Now married1.7% Separated0.8% Widowed13.8% DivorcedFemales 30.8% Never married44.8% Now married3.6% Separated9.1% Widowed11.7% DivorcedWomen who gave birth in the past 12 months Now married:
48.1% (12)Unmarried:
51.9% (13)
Women who did not give birth in the past 12 months Now married:
30.9% (249)Unmarried:
69.1% (559)
Marital status - Asian population 15 years and over
Males 31.1% Never married68.9% Now married0.0% Separated0.0% Widowed0.0% DivorcedFemales 23.3% Never married51.2% Now married0.0% Separated0.0% Widowed25.6% DivorcedWomen who did not give birth in the past 12 months Now married:
61.5% (17)Unmarried:
38.5% (10)
Marital status - Other race population 15 years and over
Males 62.4% Never married37.6% Now married0.0% Separated0.0% Widowed0.0% DivorcedFemales 57.0% Never married43.0% Now married0.0% Separated0.0% Widowed0.0% DivorcedWomen who gave birth in the past 12 months Now married:
100.0% (59)Unmarried:
0.0% (0)
Women who did not give birth in the past 12 months Now married:
0.0% (0)Unmarried:
100.0% (78)
Marital status - Two or more races population 15 years and over
Males 42.5% Never married54.1% Now married0.0% Separated0.0% Widowed3.4% DivorcedFemales 40.1% Never married46.0% Now married13.9% Separated0.0% Widowed0.0% DivorcedWomen who did not give birth in the past 12 months Now married:
68.4% (135)Unmarried:
31.6% (62)
Marital status - White alone, not Hispanic / Latino population 15 years and over
Males 36.9% Never married45.6% Now married1.8% Separated0.9% Widowed14.9% DivorcedFemales 31.4% Never married43.3% Now married3.1% Separated9.7% Widowed12.5% DivorcedWomen who gave birth in the past 12 months Now married:
48.1% (13)Unmarried:
51.9% (14)
Women who did not give birth in the past 12 months Now married:
25.9% (189)Unmarried:
74.1% (542)
Marital status - Hispanic or Latino population 15 years and over
Males 58.8% Never married41.2% Now married0.0% Separated0.0% Widowed0.0% DivorcedFemales 40.3% Never married47.4% Now married12.3% Separated0.0% Widowed0.0% DivorcedWomen who gave birth in the past 12 months Now married:
100.0% (56)Unmarried:
0.0% (0)
Women who did not give birth in the past 12 months Now married:
54.2% (150)Unmarried:
45.8% (127)
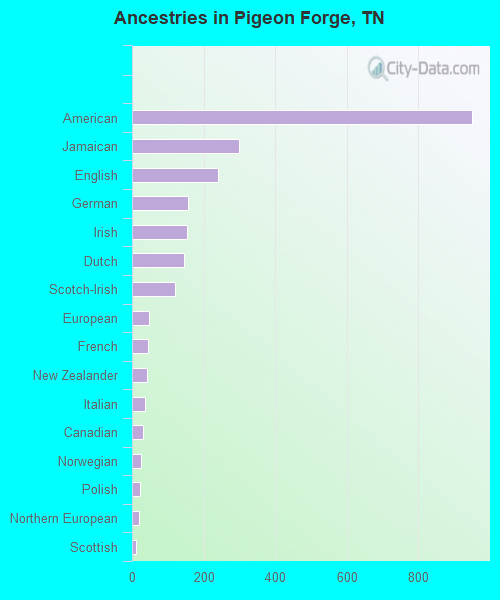
Ancestries in Pigeon Forge
950 26.6% American299 8.4% Jamaican240 6.7% English157 4.4% German153 4.3% Irish144 4.0% Dutch119 3.3% Scotch-Irish47 1.3% European46 1.3% French43 1.2% New Zealander36 1.0% Italian31 0.9% Canadian25 0.7% Norwegian22 0.6% Polish20 0.6% Northern European12 0.3% Scottish4 0.1% Eastern European
Children Nativity (place of birth) in Pigeon Forge
Children under 6 years - Living with two parents Both parents native 7 100.0% NativeBoth parents foreign-born 210 100.0% NativeChildren under 6 years - Living with one parent Native parent 53 100.0% NativeForeign-born parent 38 100.0% NativeChildren 6 to 17 years - Living with two parents Both parents foreign-born 336 54.3% Native282 45.7% Foreign-bornOne native, one foreign-born parent 75 100.0% NativeChildren 6 to 17 years - Living with one parent Native parent 469 100.0% Native
Grandparents responsible for own grandchildren in Pigeon Forge
Grandparents (30 to 59 years) White / Caucasian 18 50.0% Responsible for grandchildren18 50.0% Not responsible for grandchildrenTwo or more races 69 100.0% Not responsible for grandchildrenWhite alone, not Hispanic / Latino 18 50.0% Responsible for grandchildren18 50.0% Not responsible for grandchildrenHispanic or Latino 32 100.0% Not responsible for grandchildren
Grandparents (60 years and over) White / Caucasian 52 100.0% Not responsible for grandchildrenWhite alone, not Hispanic / Latino 52 100.0% Not responsible for grandchildren