Races in Pike Creek Valley, Delaware (DE) Detailed Stats
Data:
Races - White alone (%)
Races - White alone (% change since 2000)
Races - Black alone (%)
Races - Black alone (% change since 2000)
Races - American Indian alone (%)
Races - American Indian alone (% change since 2000)
Races - Asian alone (%)
Races - Asian alone (% change since 2000)
Races - Hispanic (%)
Races - Hispanic (% change since 2000)
Races - Native Hawaiian and Other Pacific Islander alone (%)
Races - Native Hawaiian and Other Pacific Islander alone (% change since 2000)
Races - Two or more races(%)
Races - Two or more races(% change since 2000)
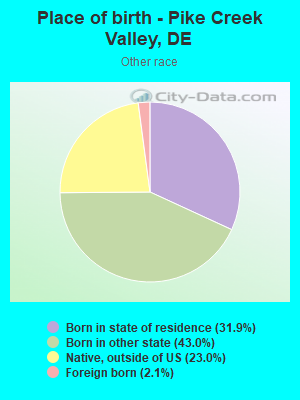
Races - Other race alone (%)
Races - Other race alone (% change since 2000)
Racial diversity
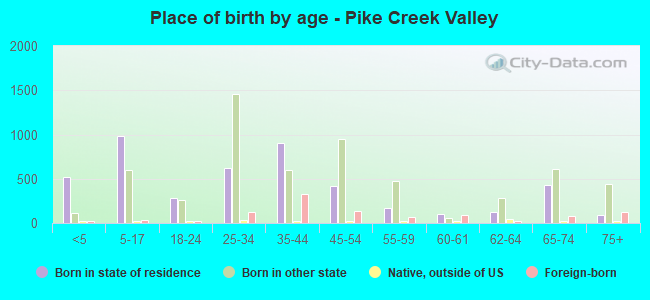
Place of birth - Born in state of residence (%)
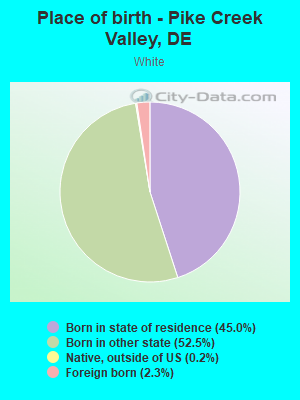
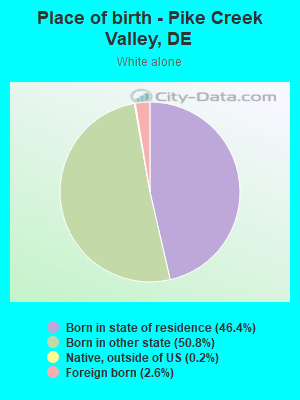
Place of birth - Born in state of residence (%) - White
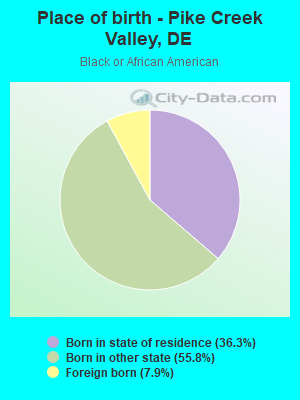
Place of birth - Born in state of residence (%) - Black or African American
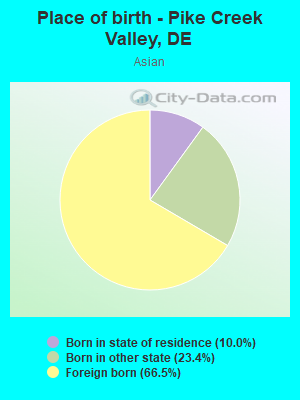
Place of birth - Born in state of residence (%) - Asian
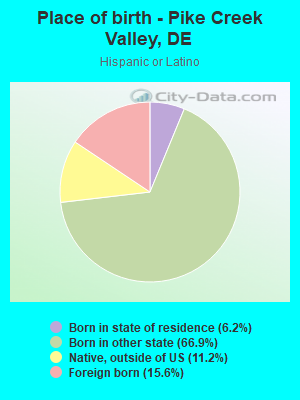
Place of birth - Born in state of residence (%) - Hispanic or Latino
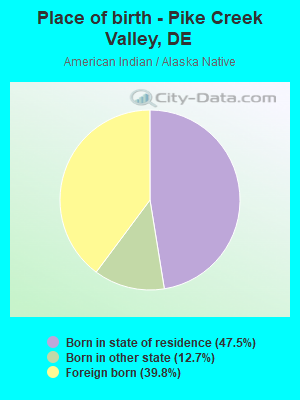
Place of birth - Born in state of residence (%) - American Indian and Alaska Native
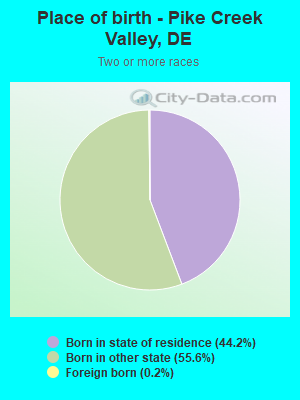
Place of birth - Born in state of residence (%) - Multirace
Place of birth - Born in state of residence (%) - Other Race
Place of birth - Born in other state (%)
Place of birth - Born in other state (%) - White
Place of birth - Born in other state (%) - Black or African American
Place of birth - Born in other state (%) - Asian
Place of birth - Born in other state (%) - Hispanic or Latino
Place of birth - Born in other state (%) - American Indian and Alaska Native
Place of birth - Born in other state (%) - Multirace
Place of birth - Born in other state (%) - Other Race
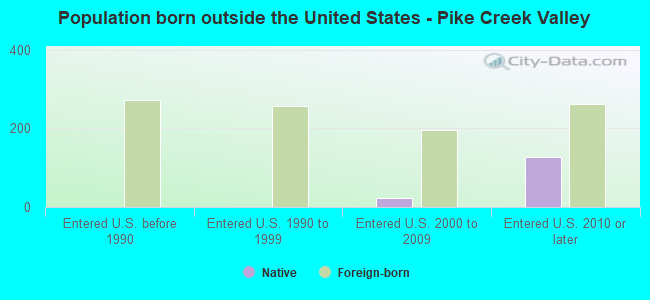
Place of birth - Native, outside of US (%)
Place of birth - Native, outside of US (%) - White
Place of birth - Native, outside of US (%) - Black or African American
Place of birth - Native, outside of US (%) - Asian
Place of birth - Native, outside of US (%) - Hispanic or Latino
Place of birth - Native, outside of US (%) - American Indian and Alaska Native
Place of birth - Native, outside of US (%) - Multirace
Place of birth - Native, outside of US (%) - Other Race
Place of birth - Foreign born (%)
Place of birth - Foreign born (%) - White
Place of birth - Foreign born (%) - Black or African American
Place of birth - Foreign born (%) - Asian
Place of birth - Foreign born (%) - Hispanic or Latino
Place of birth - Foreign born (%) - American Indian and Alaska Native
Place of birth - Foreign born (%) - Multirace
Place of birth - Foreign born (%) - Other Race
Residents speaking English at home (%)
Residents speaking English at home - Born in the United States (%)
Residents speaking English at home - Native, born elsewhere (%)
Residents speaking English at home - Foreign born (%)
Residents speaking Spanish at home (%)
Residents speaking Spanish at home - Born in the United States (%)
Residents speaking Spanish at home - Native, born elsewhere (%)
Residents speaking Spanish at home - Foreign born (%)
Residents speaking other language at home (%)
Residents speaking other language at home - Born in the United States (%)
Residents speaking other language at home - Native, born elsewhere (%)
Residents speaking other language at home - Foreign born (%)
Marital status - Never married (%)
Marital status - Now married (%)
Marital status - Separated (%)
Marital status - Widowed (%)
Marital status - Divorced (%)
Ancestries Reported - Arab (%)
Ancestries Reported - Czech (%)
Ancestries Reported - Danish (%)
Ancestries Reported - Dutch (%)
Ancestries Reported - English (%)
Ancestries Reported - French (%)
Ancestries Reported - French Canadian (%)
Ancestries Reported - German (%)
Ancestries Reported - Greek (%)
Ancestries Reported - Hungarian (%)
Ancestries Reported - Irish (%)
Ancestries Reported - Italian (%)
Ancestries Reported - Lithuanian (%)
Ancestries Reported - Norwegian (%)
Ancestries Reported - Polish (%)
Ancestries Reported - Portuguese (%)
Ancestries Reported - Russian (%)
Ancestries Reported - Scotch-Irish (%)
Ancestries Reported - Scottish (%)
Ancestries Reported - Slovak (%)
Ancestries Reported - Subsaharan African (%)
Ancestries Reported - Swedish (%)
Ancestries Reported - Swiss (%)
Ancestries Reported - Ukrainian (%)
Ancestries Reported - United States (%)
Ancestries Reported - Welsh (%)
Ancestries Reported - West Indian (%)
Ancestries Reported - Other (%)
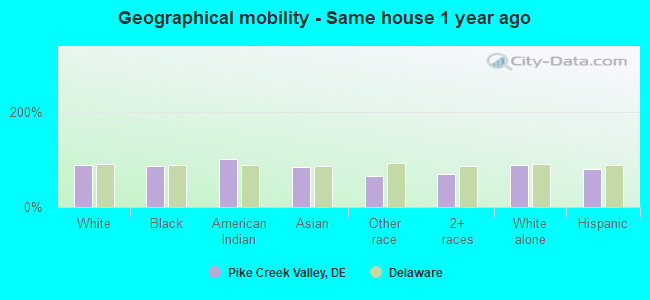
Geographical mobility - Same house 1 year ago (%)
Geographical mobility - Same house 1 year ago (%) - White
Geographical mobility - Same house 1 year ago (%) - Black or African American
Geographical mobility - Same house 1 year ago (%) - Asian
Geographical mobility - Same house 1 year ago (%) - Hispanic or Latino
Geographical mobility - Same house 1 year ago (%) - American Indian and Alaska Native
Geographical mobility - Same house 1 year ago (%) - Multirace
Geographical mobility - Same house 1 year ago (%) - Other Race
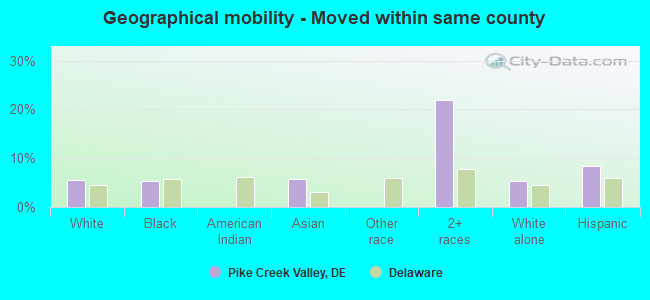
Geographical mobility - Moved within same county (%)
Geographical mobility - Moved within same county (%) - White
Geographical mobility - Moved within same county (%) - Black or African American
Geographical mobility - Moved within same county (%) - Asian
Geographical mobility - Moved within same county (%) - Hispanic or Latino
Geographical mobility - Moved within same county (%) - American Indian and Alaska Native
Geographical mobility - Moved within same county (%) - Multirace
Geographical mobility - Moved within same county (%) - Other Race
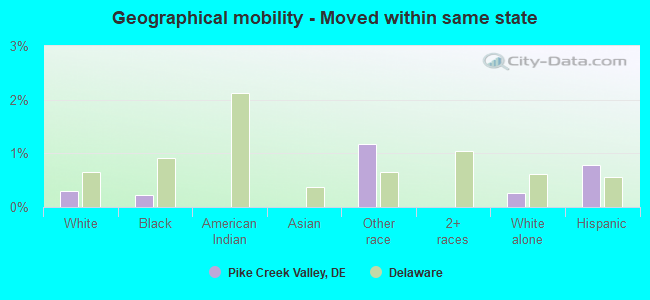
Geographical mobility - Moved from different county within same state (%)
Geographical mobility - Moved from different county within same state (%) - White
Geographical mobility - Moved from different county within same state (%) - Black or African American
Geographical mobility - Moved from different county within same state (%) - Asian
Geographical mobility - Moved from different county within same state (%) - Hispanic or Latino
Geographical mobility - Moved from different county within same state (%) - American Indian and Alaska Native
Geographical mobility - Moved from different county within same state (%) - Multirace
Geographical mobility - Moved from different county within same state (%) - Other Race
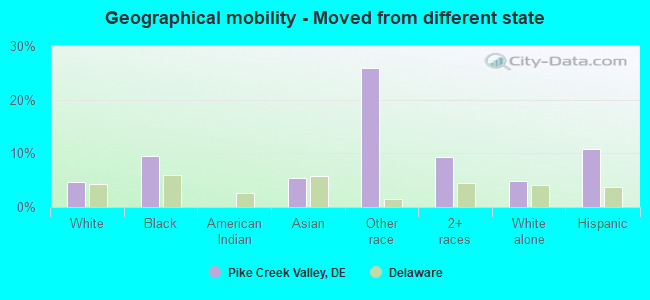
Geographical mobility - Moved from different state (%)
Geographical mobility - Moved from different state (%) - White
Geographical mobility - Moved from different state (%) - Black or African American
Geographical mobility - Moved from different state (%) - Asian
Geographical mobility - Moved from different state (%) - Hispanic or Latino
Geographical mobility - Moved from different state (%) - American Indian and Alaska Native
Geographical mobility - Moved from different state (%) - Multirace
Geographical mobility - Moved from different state (%) - Other Race
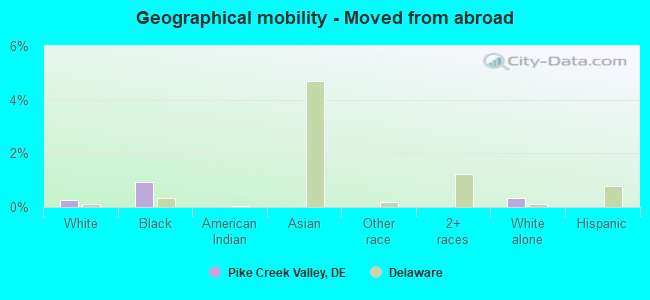
Geographical mobility - Moved from abroad (%)
Geographical mobility - Moved from abroad (%) - White
Geographical mobility - Moved from abroad (%) - Black or African American
Geographical mobility - Moved from abroad (%) - Asian
Geographical mobility - Moved from abroad (%) - Hispanic or Latino
Geographical mobility - Moved from abroad (%) - American Indian and Alaska Native
Geographical mobility - Moved from abroad (%) - Multirace
Geographical mobility - Moved from abroad (%) - Other Race
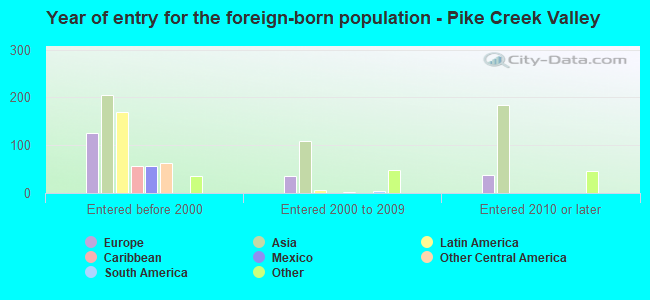
Place of birth for the foreign-born population - Ireland (%)
Place of birth for the foreign-born population - Denmark (%)
Place of birth for the foreign-born population - Norway (%)
Place of birth for the foreign-born population - Sweden (%)
Place of birth for the foreign-born population - United Kingdom (%)
Place of birth for the foreign-born population - England (%)
Place of birth for the foreign-born population - Scotland (%)
Place of birth for the foreign-born population - Other Northern Europe (%)
Place of birth for the foreign-born population - Austria (%)
Place of birth for the foreign-born population - Belgium (%)
Place of birth for the foreign-born population - France (%)
Place of birth for the foreign-born population - Germany (%)
Place of birth for the foreign-born population - Netherlands (%)
Place of birth for the foreign-born population - Switzerland (%)
Place of birth for the foreign-born population - Other Western Europe (%)
Place of birth for the foreign-born population - Greece (%)
Place of birth for the foreign-born population - Italy (%)
Place of birth for the foreign-born population - Portugal (%)
Place of birth for the foreign-born population - Spain (%)
Place of birth for the foreign-born population - Other Southern Europe (%)
Place of birth for the foreign-born population - Albania (%)
Place of birth for the foreign-born population - Belarus (%)
Place of birth for the foreign-born population - Bosnia and Herzegovina (%)
Place of birth for the foreign-born population - Bulgaria (%)
Place of birth for the foreign-born population - Croatia (%)
Place of birth for the foreign-born population - Czechoslovakia (%)
Place of birth for the foreign-born population - Hungary (%)
Place of birth for the foreign-born population - Latvia (%)
Place of birth for the foreign-born population - Lithuania (%)
Place of birth for the foreign-born population - North Macedonia (Macedonia) (%)
Place of birth for the foreign-born population - Moldova (%)
Place of birth for the foreign-born population - Poland (%)
Place of birth for the foreign-born population - Romania (%)
Place of birth for the foreign-born population - Russia (%)
Place of birth for the foreign-born population - Serbia (%)
Place of birth for the foreign-born population - Ukraine (%)
Place of birth for the foreign-born population - Other Eastern Europe (%)
Place of birth for the foreign-born population - China (%)
Place of birth for the foreign-born population - Hong Kong (%)
Place of birth for the foreign-born population - Taiwan (%)
Place of birth for the foreign-born population - Japan (%)
Place of birth for the foreign-born population - Korea (%)
Place of birth for the foreign-born population - Other Eastern Asia (%)
Place of birth for the foreign-born population - Afghanistan (%)
Place of birth for the foreign-born population - Bangladesh (%)
Place of birth for the foreign-born population - India (%)
Place of birth for the foreign-born population - Iran (%)
Place of birth for the foreign-born population - Kazakhstan (%)
Place of birth for the foreign-born population - Nepal (%)
Place of birth for the foreign-born population - Pakistan (%)
Place of birth for the foreign-born population - Sri Lanka (%)
Place of birth for the foreign-born population - Uzbekistan (%)
Place of birth for the foreign-born population - Other South Central Asia (%)
Place of birth for the foreign-born population - Burma (%)
Place of birth for the foreign-born population - Cambodia (%)
Place of birth for the foreign-born population - Indonesia (%)
Place of birth for the foreign-born population - Laos (%)
Place of birth for the foreign-born population - Malaysia (%)
Place of birth for the foreign-born population - Philippines (%)
Place of birth for the foreign-born population - Singapore (%)
Place of birth for the foreign-born population - Thailand (%)
Place of birth for the foreign-born population - Vietnam (%)
Place of birth for the foreign-born population - Other South Eastern Asia (%)
Place of birth for the foreign-born population - Armenia (%)
Place of birth for the foreign-born population - Iraq (%)
Place of birth for the foreign-born population - Israel (%)
Place of birth for the foreign-born population - Jordan (%)
Place of birth for the foreign-born population - Kuwait (%)
Place of birth for the foreign-born population - Lebanon (%)
Place of birth for the foreign-born population - Saudi Arabia (%)
Place of birth for the foreign-born population - Syria (%)
Place of birth for the foreign-born population - Turkey (%)
Place of birth for the foreign-born population - Yemen (%)
Place of birth for the foreign-born population - Other Western Asia (%)
Place of birth for the foreign-born population - Eritrea (%)
Place of birth for the foreign-born population - Ethiopia (%)
Place of birth for the foreign-born population - Kenya (%)
Place of birth for the foreign-born population - Somalia (%)
Place of birth for the foreign-born population - Uganda (%)
Place of birth for the foreign-born population - Zimbabwe (%)
Place of birth for the foreign-born population - Other Eastern Africa (%)
Place of birth for the foreign-born population - Cameroon (%)
Place of birth for the foreign-born population - Congo (%)
Place of birth for the foreign-born population - Democratic Republic of Congo (Zaire) (%)
Place of birth for the foreign-born population - Other Middle Africa (%)
Place of birth for the foreign-born population - Egypt (%)
Place of birth for the foreign-born population - Morocco (%)
Place of birth for the foreign-born population - Sudan (%)
Place of birth for the foreign-born population - Other Northern Africa (%)
Place of birth for the foreign-born population - South Africa (%)
Place of birth for the foreign-born population - Other Southern Africa (%)
Place of birth for the foreign-born population - Cabo Verde (%)
Place of birth for the foreign-born population - Ghana (%)
Place of birth for the foreign-born population - Liberia (%)
Place of birth for the foreign-born population - Nigeria (%)
Place of birth for the foreign-born population - Senegal (%)
Place of birth for the foreign-born population - Sierra Leone (%)
Place of birth for the foreign-born population - Other Western Africa (%)
Place of birth for the foreign-born population - Australia (%)
Place of birth for the foreign-born population - New Zealand (%)
Place of birth for the foreign-born population - Fiji (%)
Place of birth for the foreign-born population - Micronesia (%)
Place of birth for the foreign-born population - Bahamas (%)
Place of birth for the foreign-born population - Barbados (%)
Place of birth for the foreign-born population - Cuba (%)
Place of birth for the foreign-born population - Dominica (%)
Place of birth for the foreign-born population - Dominican Republic (%)
Place of birth for the foreign-born population - Grenada (%)
Place of birth for the foreign-born population - Haiti (%)
Place of birth for the foreign-born population - Jamaica (%)
Place of birth for the foreign-born population - St. Vincent and the Grenadines (%)
Place of birth for the foreign-born population - Trinidad and Tobago (%)
Place of birth for the foreign-born population - West Indies (%)
Place of birth for the foreign-born population - Other Caribbean (%)
Place of birth for the foreign-born population - Belize (%)
Place of birth for the foreign-born population - Costa Rica (%)
Place of birth for the foreign-born population - El Salvador (%)
Place of birth for the foreign-born population - Guatemala (%)
Place of birth for the foreign-born population - Honduras (%)
Place of birth for the foreign-born population - Mexico (%)
Place of birth for the foreign-born population - Nicaragua (%)
Place of birth for the foreign-born population - Panama (%)
Place of birth for the foreign-born population - Other Central America (%)
Place of birth for the foreign-born population - Argentina (%)
Place of birth for the foreign-born population - Bolivia (%)
Place of birth for the foreign-born population - Brazil (%)
Place of birth for the foreign-born population - Chile (%)
Place of birth for the foreign-born population - Colombia (%)
Place of birth for the foreign-born population - Ecuador (%)
Place of birth for the foreign-born population - Guyana (%)
Place of birth for the foreign-born population - Peru (%)
Place of birth for the foreign-born population - Uruguay (%)
Place of birth for the foreign-born population - Venezuela (%)
Place of birth for the foreign-born population - Other South America (%)
Place of birth for the foreign-born population - Canada (%)
Place of birth for the foreign-born population - Other Northern America (%)
Place of birth for the foreign-born population - Other (%)
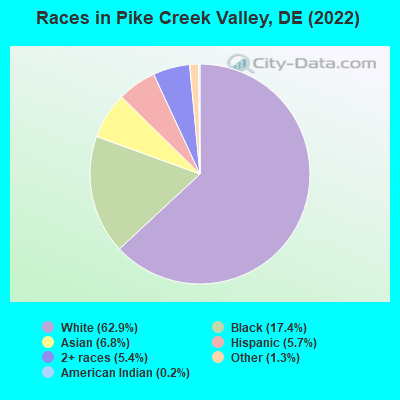
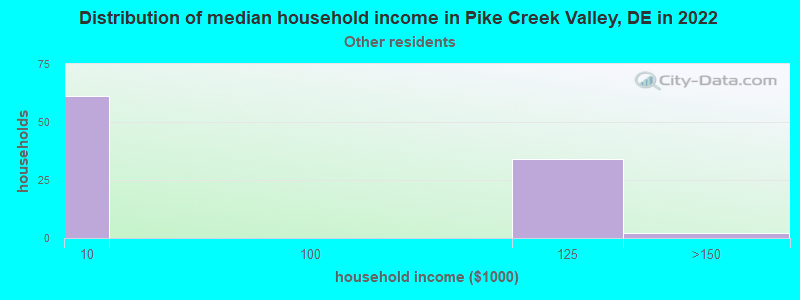
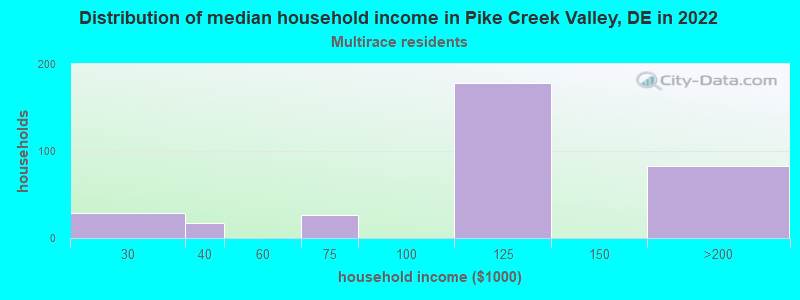
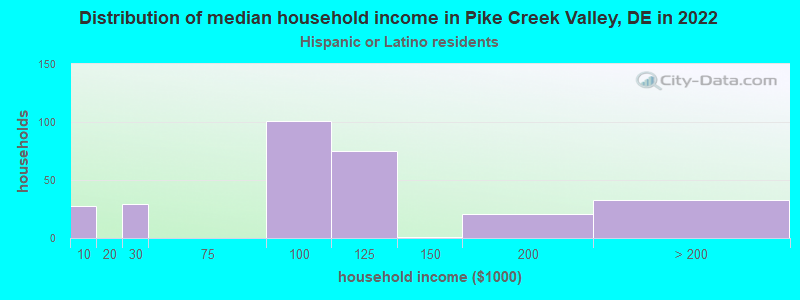
According to 2022 data, the most numerous races in Pike Creek Valley, DE are White alone (7,260 residents), Black alone (2,010 residents), and Hispanic (660 residents). 89.9% of Pike Creek Valley residents speak English at home.
Race distribution in Pike Creek Valley 7,260 62.9% White alone 2,010 17.4% Black alone 788 6.8% Asian alone 660 5.7% Hispanic 625 5.4% Two or more races 150 1.3% Other race alone 19 0.2% American Indian alone
2000 2022
567,973 72.5% White alone 148,435 18.9% Black alone 37,277 4.8% Hispanic 16,110 2.1% Asian alone 10,222 1.3% Two or more races 2,324 0.3% American Indian alone 1,025 0.1% Other race alone 234 0.03% Native Hawaiian and Other
599,347 58.9% White alone 220,010 21.6% Black alone 105,300 10.3% Hispanic 46,016 4.5% Two or more races 41,350 4.1% Asian alone 5,097 0.5% Other race alone 1,276 0.1% American Indian alone
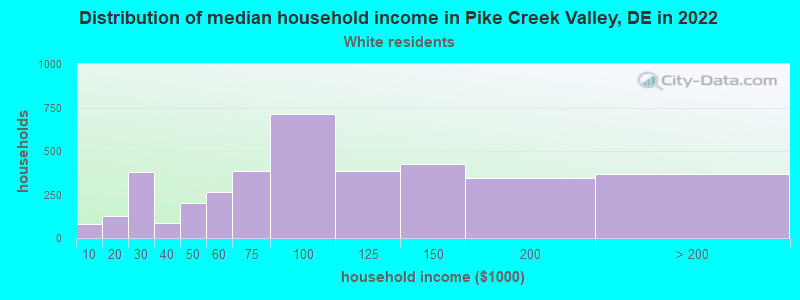
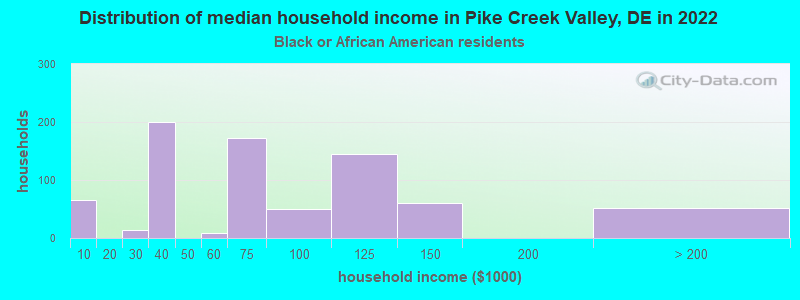
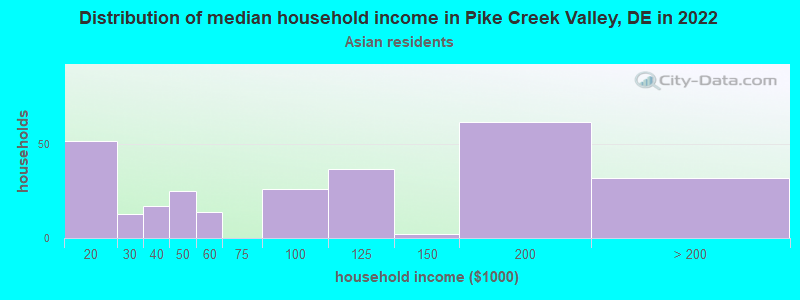
Income and house value in Pike Creek Valley Median household income in 2022 $83,323 White non-Hispanic householders$67,645 Black householders$92,450 Asian householders$2,895 Some other race householders$104,747 Two or more races householders$96,330 Hispanic or Latino race householders
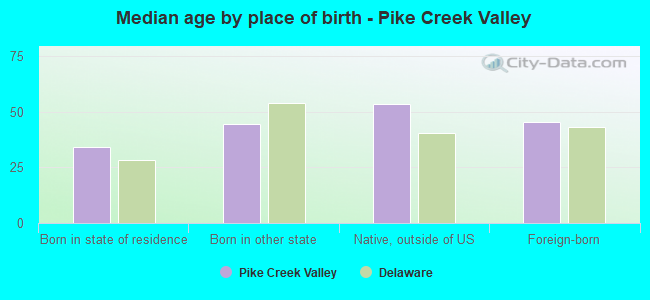
Median age by race in Pike Creek Valley
44.8 Median age for White residents44.6 45.1 33.4 Median age for Black or African American residents31.4 33.2 25.2 Median age for American Indian / Alaska Native residents13.3 -659,673,659.0 41.7 Median age for Asian residents41.2 42.4 -666,666,666.0 Median age for Native Hawaiian / Pacific Islander residents-668,724,279.2 -670,599,802.7 28.2 Median age for Other race residents17.1 55.0 31.5 Median age for Two or more races residents15.1 35.3 44.5 Median age for White alone residents44.2 44.5 30.1 Median age for Hispanic or Latino residents35.3 29.2
Owner/renter occupied households by race in Pike Creek Valley
House owners and renters - White residents 2,714 73.7% Owner occupied967 26.3% Renter occupiedHouse owners and renters - Black or African American residents 274 36.9% Owner occupied469 63.1% Renter occupiedHouse owners and renters - American Indian / Alaska Native residents 45 100.0% Renter occupiedHouse owners and renters - Asian residents 148 56.9% Owner occupied112 43.1% Renter occupiedHouse owners and renters - Other race residents 28 38.8% Owner occupied44 61.2% Renter occupiedHouse owners and renters - Two or more races residents 292 81.4% Owner occupied66 18.6% Renter occupiedHouse owners and renters - White alone residents 2,735 74.5% Owner occupied937 25.5% Renter occupiedHouse owners and renters - Hispanic or Latino residents 63 22.4% Owner occupied218 77.6% Renter occupied
Language usage in Pike Creek Valley
English speakers - Total 89.9% of residents of Pike Creek Valley speak English at home.
2.9% of residents speak Spanish at home 302 94.4% Speak English very well18 5.6% Speak English less than very well7.4% of residents speak other language at home 523 64.8% Speak English very well284 35.2% Speak English less than very well
English speakers - Born in the United States 95.6% of residents of Pike Creek Valley speak English at home.
2.1% of residents speak Spanish at home 99 84.6% Speak English very well18 15.4% Speak English less than very well2.4% of residents speak other language at home 120 87.6% Speak English very well17 12.4% Speak English less than very well
English speakers - Native, born elsewhere 52.0% of residents of Pike Creek Valley speak English at home.
28.0% of residents speak Spanish at home 28 100.0% Speak English very well16.0% of residents speak other language at home 16 100.0% Speak English very well
English speakers - Foreign-born 28.2% of residents of Pike Creek Valley speak English at home.
11.2% of residents speak Spanish at home 107 98.2% Speak English very well2 1.8% Speak English less than very well61.1% of residents speak other language at home 340 57.0% Speak English very well256 43.0% Speak English less than very well
White (Caucasian) - Speak only English Native:
99.9% (6,764)Foreign-born:
24.5% (42)
White (Caucasian) - Speak another language Native:
1.2% (80)Foreign-born:
70.9% (122)
Black or African American - Speak only English Native:
99.8% (1,763)Foreign-born:
57.2% (92)
Black or African American - Speak another language Native:
0.4% (7)Foreign-born:
37.0% (60)
American Indian / Alaska Native - Speak another language Native:
16.1% (6)Foreign-born:
100.0% (39)
Asian - Speak only English Native:
32.7% (85)Foreign-born:
26.8% (135)
Asian - Speak another language Native:
71.7% (187)Foreign-born:
76.3% (384)
Other race - Speak another language Native:
27.2% (55)Foreign-born:
91.5% (7)
Two or more races - Speak only English Native:
85.3% (721)Foreign-born:
100.0% (2)
White alone - Speak only English Native:
99.3% (6,716)Foreign-born:
24.3% (46)
White alone - Speak another language Native:
1.0% (65)Foreign-born:
75.0% (142)
Hispanic or Latino - Speak only English Native:
73.5% (360)Foreign-born:
1.5% (2)
Hispanic or Latino - Speak another language Native:
29.2% (143)Foreign-born:
93.2% (106)
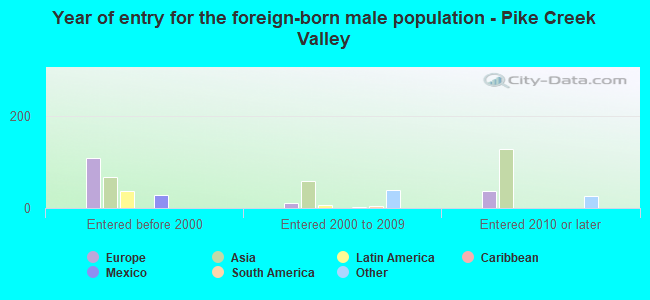
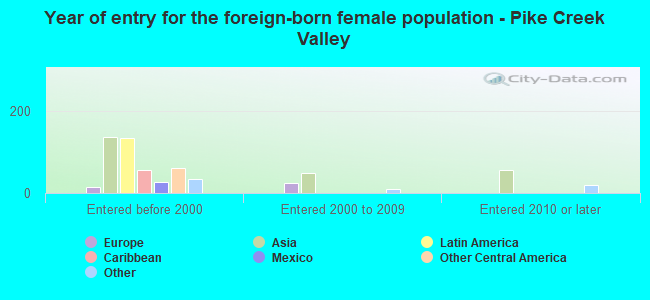
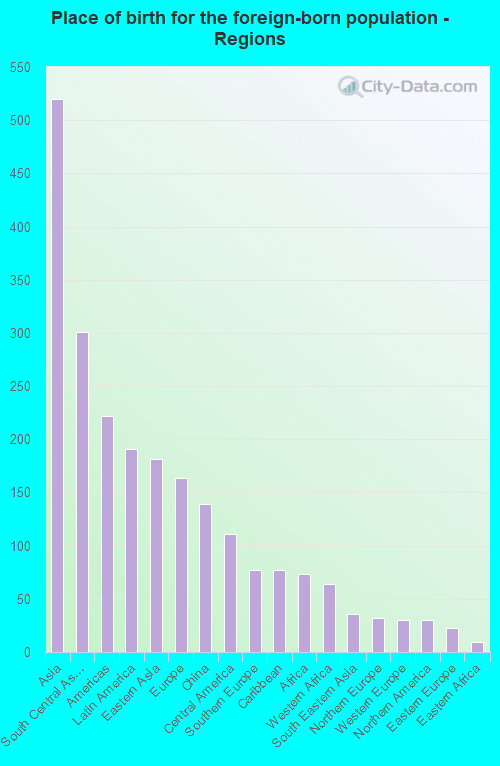
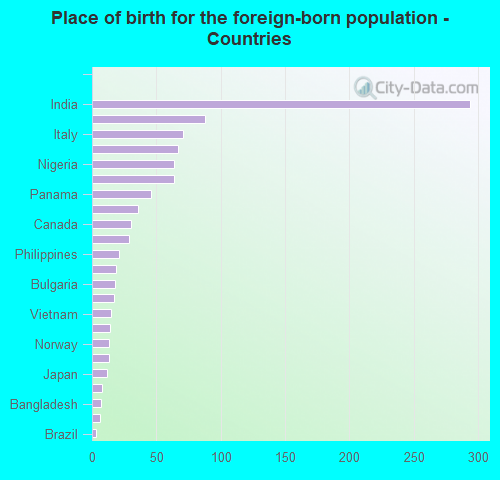
Foreign-born residents in Pike Creek Valley
Marital status for residents in Pike Creek Valley Marital status - White (Caucasian) population 15 years and over
Males 32.4% Never married52.4% Now married0.0% Separated7.2% Widowed8.0% DivorcedFemales 33.7% Never married44.1% Now married0.7% Separated10.3% Widowed11.3% DivorcedWomen who gave birth in the past 12 months Now married:
67.3% (33)Unmarried:
32.7% (16)
Women who did not give birth in the past 12 months Now married:
34.7% (582)Unmarried:
65.3% (1,094)
Marital status - Black or African American population 15 years and over
Males 39.9% Never married42.8% Now married0.0% Separated14.8% Widowed2.5% DivorcedFemales 75.7% Never married17.0% Now married0.0% Separated1.2% Widowed6.1% DivorcedWomen who gave birth in the past 12 months Now married:
100.0% (9)Unmarried:
0.0% (0)
Women who did not give birth in the past 12 months Now married:
10.4% (88)Unmarried:
89.6% (761)
Marital status - American Indian / Alaska Native population 15 years and over
Males 29.4% Never married70.6% Now married0.0% Separated0.0% Widowed0.0% DivorcedFemales 100.0% Never married0.0% Now married0.0% Separated0.0% Widowed0.0% DivorcedWomen who did not give birth in the past 12 months Now married:
0.0% (0)Unmarried:
100.0% (29)
Marital status - Asian population 15 years and over
Males 28.8% Never married71.2% Now married0.0% Separated0.0% Widowed0.0% DivorcedFemales 28.3% Never married65.4% Now married0.0% Separated0.0% Widowed6.3% DivorcedWomen who did not give birth in the past 12 months Now married:
65.8% (152)Unmarried:
34.2% (79)
Marital status - Other race population 15 years and over
Males 97.0% Never married3.0% Now married0.0% Separated0.0% Widowed0.0% DivorcedFemales 69.7% Never married30.3% Now married0.0% Separated0.0% Widowed0.0% DivorcedWomen who did not give birth in the past 12 months Now married:
100.0% (26)Unmarried:
0.0% (0)
Marital status - Two or more races population 15 years and over
Males 72.7% Never married27.3% Now married0.0% Separated0.0% Widowed0.0% DivorcedFemales 27.1% Never married72.9% Now married0.0% Separated0.0% Widowed0.0% DivorcedWomen who did not give birth in the past 12 months Now married:
86.4% (189)Unmarried:
13.6% (30)
Marital status - White alone, not Hispanic / Latino population 15 years and over
Males 32.2% Never married52.2% Now married0.0% Separated7.3% Widowed8.3% DivorcedFemales 32.9% Never married45.4% Now married0.7% Separated10.7% Widowed10.3% DivorcedWomen who gave birth in the past 12 months Now married:
100.0% (36)Unmarried:
0.0% (0)
Women who did not give birth in the past 12 months Now married:
35.2% (603)Unmarried:
64.8% (1,110)
Marital status - Hispanic or Latino population 15 years and over
Males 58.9% Never married41.1% Now married0.0% Separated0.0% Widowed0.0% DivorcedFemales 54.8% Never married28.1% Now married0.0% Separated0.0% Widowed17.0% DivorcedWomen who gave birth in the past 12 months Now married:
0.0% (0)Unmarried:
100.0% (19)
Women who did not give birth in the past 12 months Now married:
30.6% (39)Unmarried:
69.4% (89)
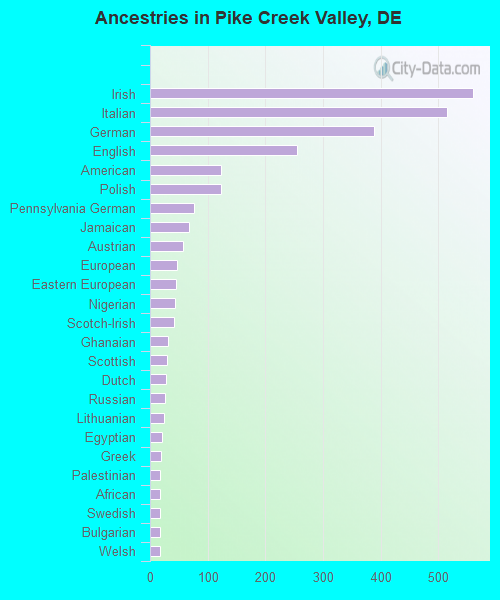
Ancestries in Pike Creek Valley
560 12.4% Irish515 11.4% Italian389 8.6% German255 5.7% English124 2.7% American124 2.7% Polish77 1.7% Pennsylvania German67 1.5% Jamaican57 1.3% Austrian47 1.0% European45 1.0% Eastern European43 1.0% Nigerian41 0.9% Scotch-Irish31 0.7% Ghanaian29 0.6% Scottish28 0.6% Dutch26 0.6% Russian25 0.6% Lithuanian20 0.4% Egyptian19 0.4% Greek18 0.4% Palestinian18 0.4% African18 0.4% Swedish17 0.4% Bulgarian17 0.4% Welsh12 0.3% Armenian12 0.3% Norwegian9 0.2% Northern European7 0.2% Ukrainian
Children Nativity (place of birth) in Pike Creek Valley
Children under 6 years - Living with two parents Both parents native 280 100.0% NativeBoth parents foreign-born 30 64.6% Native16 35.4% Foreign-bornOne native, one foreign-born parent 41 100.0% NativeChildren under 6 years - Living with one parent Native parent 260 100.0% NativeForeign-born parent 45 100.0% NativeChildren 6 to 17 years - Living with two parents Both parents native 642 100.0% NativeBoth parents foreign-born 204 92.9% Native15 7.1% Foreign-bornOne native, one foreign-born parent 51 100.0% NativeChildren 6 to 17 years - Living with one parent Native parent 521 100.0% NativeForeign-born parent 33 53.6% Native29 46.4% Foreign-born
Grandparents responsible for own grandchildren in Pike Creek Valley
Grandparents (30 to 59 years) White / Caucasian 37 76.5% Responsible for grandchildren11 23.5% Not responsible for grandchildrenBlack or African American 28 100.0% Not responsible for grandchildrenWhite alone, not Hispanic / Latino 24 100.0% Responsible for grandchildrenHispanic or Latino 16 52.6% Responsible for grandchildren15 47.4% Not responsible for grandchildren
Grandparents (60 years and over) White / Caucasian 22 100.0% Not responsible for grandchildrenBlack or African American 104 100.0% Not responsible for grandchildrenWhite alone, not Hispanic / Latino 23 100.0% Not responsible for grandchildren