Races in Pleasanton, California (CA) Detailed Stats
Data:
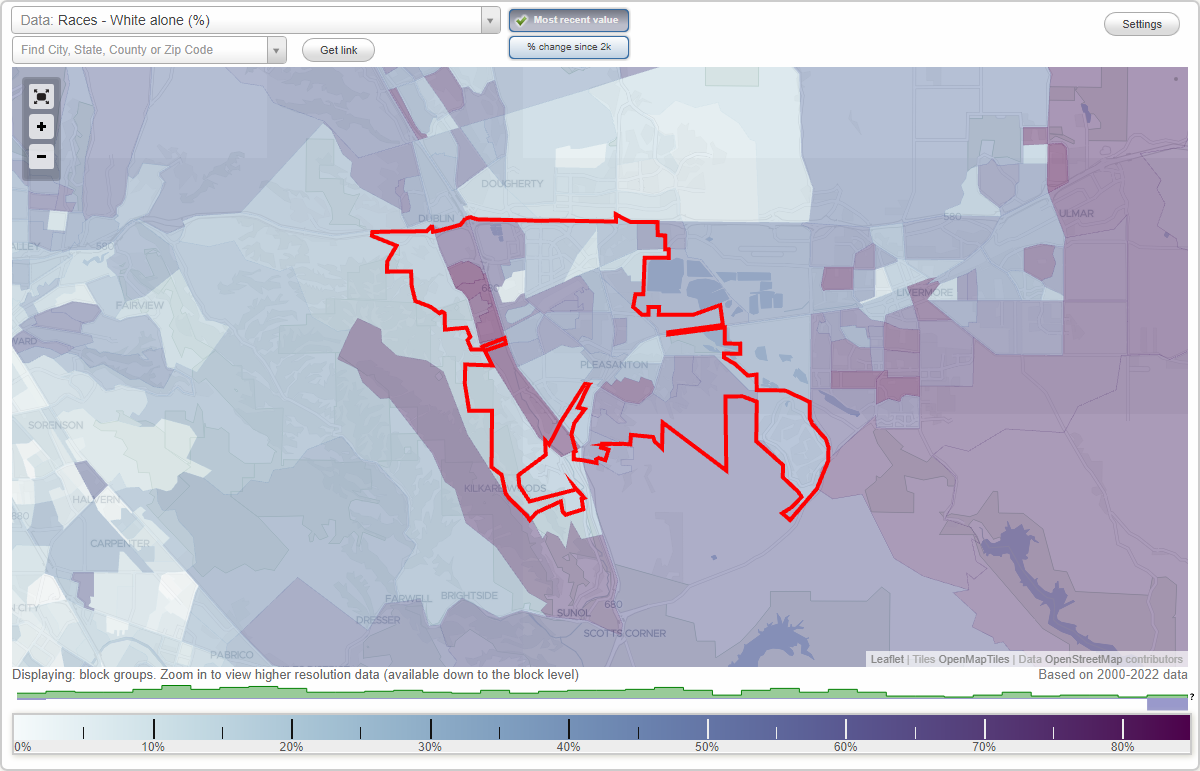
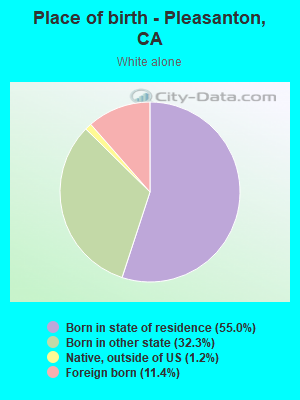
Races - White alone (%)
Races - White alone (% change since 2000)
Races - Black alone (%)
Races - Black alone (% change since 2000)
Races - American Indian alone (%)
Races - American Indian alone (% change since 2000)
Races - Asian alone (%)
Races - Asian alone (% change since 2000)
Races - Hispanic (%)
Races - Hispanic (% change since 2000)
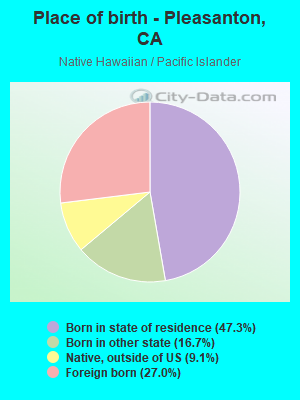
Races - Native Hawaiian and Other Pacific Islander alone (%)
Races - Native Hawaiian and Other Pacific Islander alone (% change since 2000)
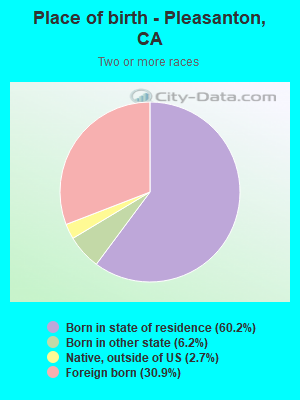
Races - Two or more races(%)
Races - Two or more races(% change since 2000)
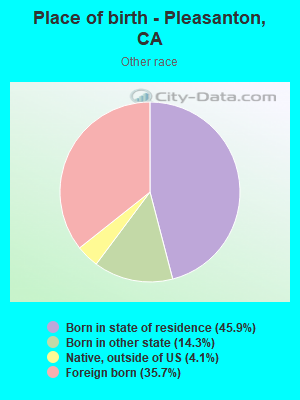
Races - Other race alone (%)
Races - Other race alone (% change since 2000)
Racial diversity
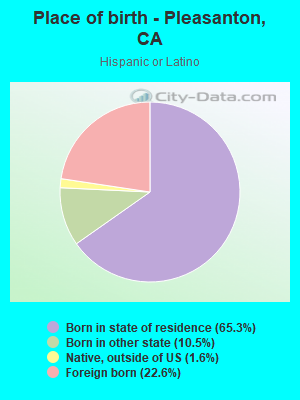
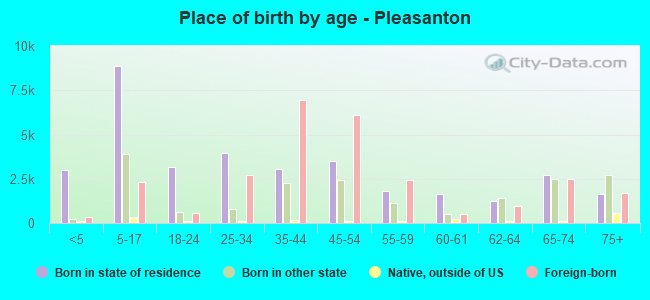
Place of birth - Born in state of residence (%)
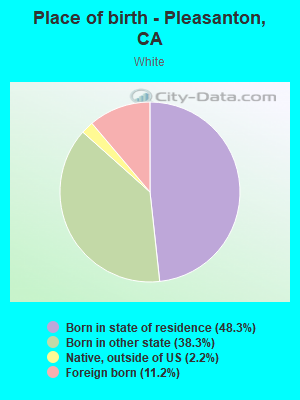
Place of birth - Born in state of residence (%) - White
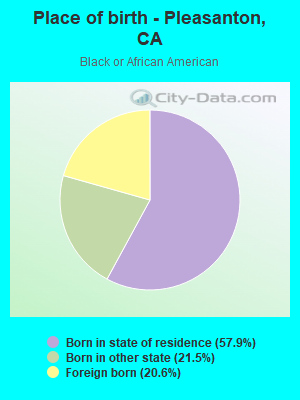
Place of birth - Born in state of residence (%) - Black or African American
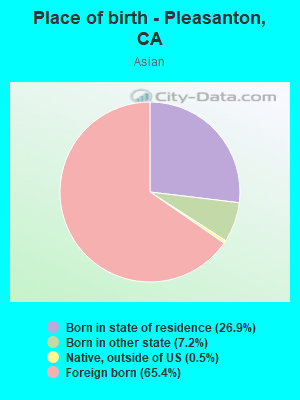
Place of birth - Born in state of residence (%) - Asian
Place of birth - Born in state of residence (%) - Hispanic or Latino
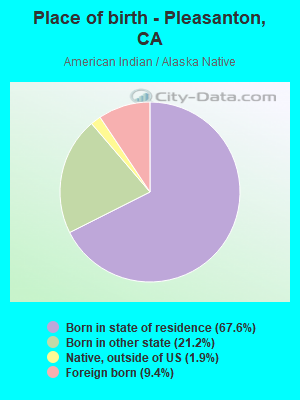
Place of birth - Born in state of residence (%) - American Indian and Alaska Native
Place of birth - Born in state of residence (%) - Multirace
Place of birth - Born in state of residence (%) - Other Race
Place of birth - Born in other state (%)
Place of birth - Born in other state (%) - White
Place of birth - Born in other state (%) - Black or African American
Place of birth - Born in other state (%) - Asian
Place of birth - Born in other state (%) - Hispanic or Latino
Place of birth - Born in other state (%) - American Indian and Alaska Native
Place of birth - Born in other state (%) - Multirace
Place of birth - Born in other state (%) - Other Race
Place of birth - Native, outside of US (%)
Place of birth - Native, outside of US (%) - White
Place of birth - Native, outside of US (%) - Black or African American
Place of birth - Native, outside of US (%) - Asian
Place of birth - Native, outside of US (%) - Hispanic or Latino
Place of birth - Native, outside of US (%) - American Indian and Alaska Native
Place of birth - Native, outside of US (%) - Multirace
Place of birth - Native, outside of US (%) - Other Race
Place of birth - Foreign born (%)
Place of birth - Foreign born (%) - White
Place of birth - Foreign born (%) - Black or African American
Place of birth - Foreign born (%) - Asian
Place of birth - Foreign born (%) - Hispanic or Latino
Place of birth - Foreign born (%) - American Indian and Alaska Native
Place of birth - Foreign born (%) - Multirace
Place of birth - Foreign born (%) - Other Race
Residents speaking English at home (%)
Residents speaking English at home - Born in the United States (%)
Residents speaking English at home - Native, born elsewhere (%)
Residents speaking English at home - Foreign born (%)
Residents speaking Spanish at home (%)
Residents speaking Spanish at home - Born in the United States (%)
Residents speaking Spanish at home - Native, born elsewhere (%)
Residents speaking Spanish at home - Foreign born (%)
Residents speaking other language at home (%)
Residents speaking other language at home - Born in the United States (%)
Residents speaking other language at home - Native, born elsewhere (%)
Residents speaking other language at home - Foreign born (%)
Marital status - Never married (%)
Marital status - Now married (%)
Marital status - Separated (%)
Marital status - Widowed (%)
Marital status - Divorced (%)
Ancestries Reported - Arab (%)
Ancestries Reported - Czech (%)
Ancestries Reported - Danish (%)
Ancestries Reported - Dutch (%)
Ancestries Reported - English (%)
Ancestries Reported - French (%)
Ancestries Reported - French Canadian (%)
Ancestries Reported - German (%)
Ancestries Reported - Greek (%)
Ancestries Reported - Hungarian (%)
Ancestries Reported - Irish (%)
Ancestries Reported - Italian (%)
Ancestries Reported - Lithuanian (%)
Ancestries Reported - Norwegian (%)
Ancestries Reported - Polish (%)
Ancestries Reported - Portuguese (%)
Ancestries Reported - Russian (%)
Ancestries Reported - Scotch-Irish (%)
Ancestries Reported - Scottish (%)
Ancestries Reported - Slovak (%)
Ancestries Reported - Subsaharan African (%)
Ancestries Reported - Swedish (%)
Ancestries Reported - Swiss (%)
Ancestries Reported - Ukrainian (%)
Ancestries Reported - United States (%)
Ancestries Reported - Welsh (%)
Ancestries Reported - West Indian (%)
Ancestries Reported - Other (%)
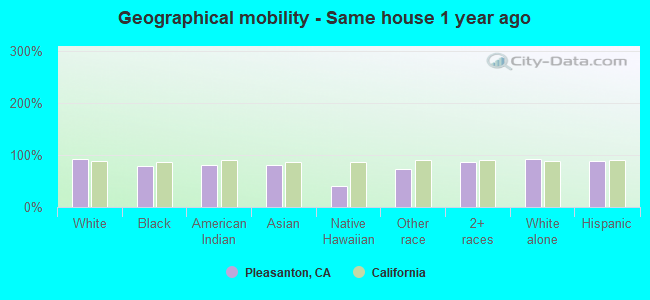
Geographical mobility - Same house 1 year ago (%)
Geographical mobility - Same house 1 year ago (%) - White
Geographical mobility - Same house 1 year ago (%) - Black or African American
Geographical mobility - Same house 1 year ago (%) - Asian
Geographical mobility - Same house 1 year ago (%) - Hispanic or Latino
Geographical mobility - Same house 1 year ago (%) - American Indian and Alaska Native
Geographical mobility - Same house 1 year ago (%) - Multirace
Geographical mobility - Same house 1 year ago (%) - Other Race
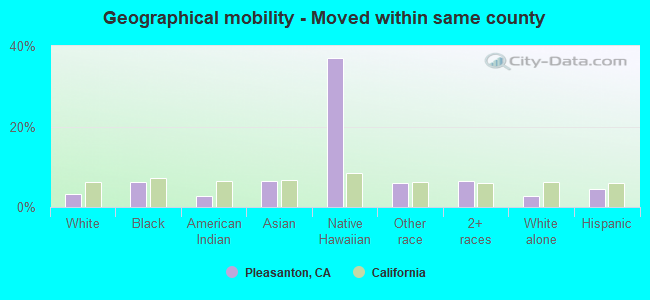
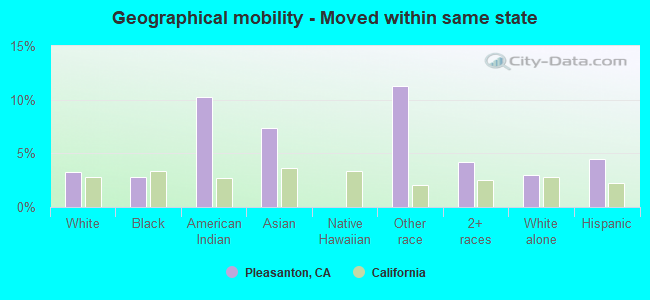
Geographical mobility - Moved within same county (%)
Geographical mobility - Moved within same county (%) - White
Geographical mobility - Moved within same county (%) - Black or African American
Geographical mobility - Moved within same county (%) - Asian
Geographical mobility - Moved within same county (%) - Hispanic or Latino
Geographical mobility - Moved within same county (%) - American Indian and Alaska Native
Geographical mobility - Moved within same county (%) - Multirace
Geographical mobility - Moved within same county (%) - Other Race
Geographical mobility - Moved from different county within same state (%)
Geographical mobility - Moved from different county within same state (%) - White
Geographical mobility - Moved from different county within same state (%) - Black or African American
Geographical mobility - Moved from different county within same state (%) - Asian
Geographical mobility - Moved from different county within same state (%) - Hispanic or Latino
Geographical mobility - Moved from different county within same state (%) - American Indian and Alaska Native
Geographical mobility - Moved from different county within same state (%) - Multirace
Geographical mobility - Moved from different county within same state (%) - Other Race
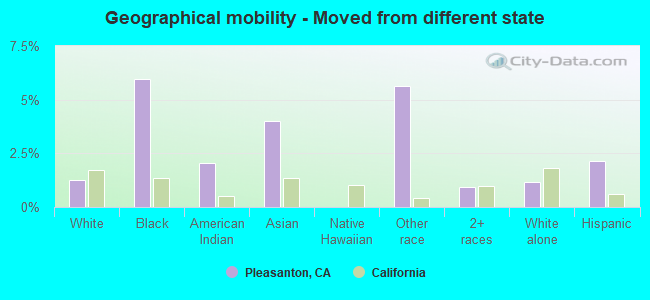
Geographical mobility - Moved from different state (%)
Geographical mobility - Moved from different state (%) - White
Geographical mobility - Moved from different state (%) - Black or African American
Geographical mobility - Moved from different state (%) - Asian
Geographical mobility - Moved from different state (%) - Hispanic or Latino
Geographical mobility - Moved from different state (%) - American Indian and Alaska Native
Geographical mobility - Moved from different state (%) - Multirace
Geographical mobility - Moved from different state (%) - Other Race
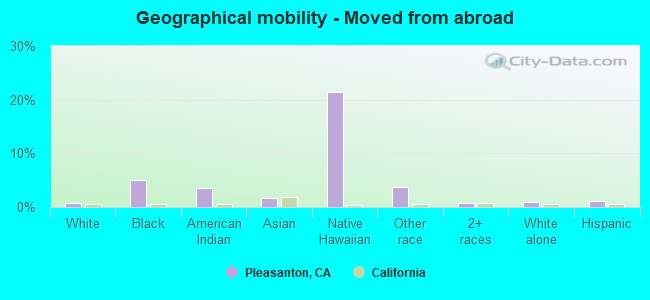
Geographical mobility - Moved from abroad (%)
Geographical mobility - Moved from abroad (%) - White
Geographical mobility - Moved from abroad (%) - Black or African American
Geographical mobility - Moved from abroad (%) - Asian
Geographical mobility - Moved from abroad (%) - Hispanic or Latino
Geographical mobility - Moved from abroad (%) - American Indian and Alaska Native
Geographical mobility - Moved from abroad (%) - Multirace
Geographical mobility - Moved from abroad (%) - Other Race
Place of birth for the foreign-born population - Ireland (%)
Place of birth for the foreign-born population - Denmark (%)
Place of birth for the foreign-born population - Norway (%)
Place of birth for the foreign-born population - Sweden (%)
Place of birth for the foreign-born population - United Kingdom (%)
Place of birth for the foreign-born population - England (%)
Place of birth for the foreign-born population - Scotland (%)
Place of birth for the foreign-born population - Other Northern Europe (%)
Place of birth for the foreign-born population - Austria (%)
Place of birth for the foreign-born population - Belgium (%)
Place of birth for the foreign-born population - France (%)
Place of birth for the foreign-born population - Germany (%)
Place of birth for the foreign-born population - Netherlands (%)
Place of birth for the foreign-born population - Switzerland (%)
Place of birth for the foreign-born population - Other Western Europe (%)
Place of birth for the foreign-born population - Greece (%)
Place of birth for the foreign-born population - Italy (%)
Place of birth for the foreign-born population - Portugal (%)
Place of birth for the foreign-born population - Spain (%)
Place of birth for the foreign-born population - Other Southern Europe (%)
Place of birth for the foreign-born population - Albania (%)
Place of birth for the foreign-born population - Belarus (%)
Place of birth for the foreign-born population - Bosnia and Herzegovina (%)
Place of birth for the foreign-born population - Bulgaria (%)
Place of birth for the foreign-born population - Croatia (%)
Place of birth for the foreign-born population - Czechoslovakia (%)
Place of birth for the foreign-born population - Hungary (%)
Place of birth for the foreign-born population - Latvia (%)
Place of birth for the foreign-born population - Lithuania (%)
Place of birth for the foreign-born population - North Macedonia (Macedonia) (%)
Place of birth for the foreign-born population - Moldova (%)
Place of birth for the foreign-born population - Poland (%)
Place of birth for the foreign-born population - Romania (%)
Place of birth for the foreign-born population - Russia (%)
Place of birth for the foreign-born population - Serbia (%)
Place of birth for the foreign-born population - Ukraine (%)
Place of birth for the foreign-born population - Other Eastern Europe (%)
Place of birth for the foreign-born population - China (%)
Place of birth for the foreign-born population - Hong Kong (%)
Place of birth for the foreign-born population - Taiwan (%)
Place of birth for the foreign-born population - Japan (%)
Place of birth for the foreign-born population - Korea (%)
Place of birth for the foreign-born population - Other Eastern Asia (%)
Place of birth for the foreign-born population - Afghanistan (%)
Place of birth for the foreign-born population - Bangladesh (%)
Place of birth for the foreign-born population - India (%)
Place of birth for the foreign-born population - Iran (%)
Place of birth for the foreign-born population - Kazakhstan (%)
Place of birth for the foreign-born population - Nepal (%)
Place of birth for the foreign-born population - Pakistan (%)
Place of birth for the foreign-born population - Sri Lanka (%)
Place of birth for the foreign-born population - Uzbekistan (%)
Place of birth for the foreign-born population - Other South Central Asia (%)
Place of birth for the foreign-born population - Burma (%)
Place of birth for the foreign-born population - Cambodia (%)
Place of birth for the foreign-born population - Indonesia (%)
Place of birth for the foreign-born population - Laos (%)
Place of birth for the foreign-born population - Malaysia (%)
Place of birth for the foreign-born population - Philippines (%)
Place of birth for the foreign-born population - Singapore (%)
Place of birth for the foreign-born population - Thailand (%)
Place of birth for the foreign-born population - Vietnam (%)
Place of birth for the foreign-born population - Other South Eastern Asia (%)
Place of birth for the foreign-born population - Armenia (%)
Place of birth for the foreign-born population - Iraq (%)
Place of birth for the foreign-born population - Israel (%)
Place of birth for the foreign-born population - Jordan (%)
Place of birth for the foreign-born population - Kuwait (%)
Place of birth for the foreign-born population - Lebanon (%)
Place of birth for the foreign-born population - Saudi Arabia (%)
Place of birth for the foreign-born population - Syria (%)
Place of birth for the foreign-born population - Turkey (%)
Place of birth for the foreign-born population - Yemen (%)
Place of birth for the foreign-born population - Other Western Asia (%)
Place of birth for the foreign-born population - Eritrea (%)
Place of birth for the foreign-born population - Ethiopia (%)
Place of birth for the foreign-born population - Kenya (%)
Place of birth for the foreign-born population - Somalia (%)
Place of birth for the foreign-born population - Uganda (%)
Place of birth for the foreign-born population - Zimbabwe (%)
Place of birth for the foreign-born population - Other Eastern Africa (%)
Place of birth for the foreign-born population - Cameroon (%)
Place of birth for the foreign-born population - Congo (%)
Place of birth for the foreign-born population - Democratic Republic of Congo (Zaire) (%)
Place of birth for the foreign-born population - Other Middle Africa (%)
Place of birth for the foreign-born population - Egypt (%)
Place of birth for the foreign-born population - Morocco (%)
Place of birth for the foreign-born population - Sudan (%)
Place of birth for the foreign-born population - Other Northern Africa (%)
Place of birth for the foreign-born population - South Africa (%)
Place of birth for the foreign-born population - Other Southern Africa (%)
Place of birth for the foreign-born population - Cabo Verde (%)
Place of birth for the foreign-born population - Ghana (%)
Place of birth for the foreign-born population - Liberia (%)
Place of birth for the foreign-born population - Nigeria (%)
Place of birth for the foreign-born population - Senegal (%)
Place of birth for the foreign-born population - Sierra Leone (%)
Place of birth for the foreign-born population - Other Western Africa (%)
Place of birth for the foreign-born population - Australia (%)
Place of birth for the foreign-born population - New Zealand (%)
Place of birth for the foreign-born population - Fiji (%)
Place of birth for the foreign-born population - Micronesia (%)
Place of birth for the foreign-born population - Bahamas (%)
Place of birth for the foreign-born population - Barbados (%)
Place of birth for the foreign-born population - Cuba (%)
Place of birth for the foreign-born population - Dominica (%)
Place of birth for the foreign-born population - Dominican Republic (%)
Place of birth for the foreign-born population - Grenada (%)
Place of birth for the foreign-born population - Haiti (%)
Place of birth for the foreign-born population - Jamaica (%)
Place of birth for the foreign-born population - St. Vincent and the Grenadines (%)
Place of birth for the foreign-born population - Trinidad and Tobago (%)
Place of birth for the foreign-born population - West Indies (%)
Place of birth for the foreign-born population - Other Caribbean (%)
Place of birth for the foreign-born population - Belize (%)
Place of birth for the foreign-born population - Costa Rica (%)
Place of birth for the foreign-born population - El Salvador (%)
Place of birth for the foreign-born population - Guatemala (%)
Place of birth for the foreign-born population - Honduras (%)
Place of birth for the foreign-born population - Mexico (%)
Place of birth for the foreign-born population - Nicaragua (%)
Place of birth for the foreign-born population - Panama (%)
Place of birth for the foreign-born population - Other Central America (%)
Place of birth for the foreign-born population - Argentina (%)
Place of birth for the foreign-born population - Bolivia (%)
Place of birth for the foreign-born population - Brazil (%)
Place of birth for the foreign-born population - Chile (%)
Place of birth for the foreign-born population - Colombia (%)
Place of birth for the foreign-born population - Ecuador (%)
Place of birth for the foreign-born population - Guyana (%)
Place of birth for the foreign-born population - Peru (%)
Place of birth for the foreign-born population - Uruguay (%)
Place of birth for the foreign-born population - Venezuela (%)
Place of birth for the foreign-born population - Other South America (%)
Place of birth for the foreign-born population - Canada (%)
Place of birth for the foreign-born population - Other Northern America (%)
Place of birth for the foreign-born population - Other (%)
Latest news about races in Pleasanton, CA collected exclusively by city-data.com from local newspapers, TV, and radio stations
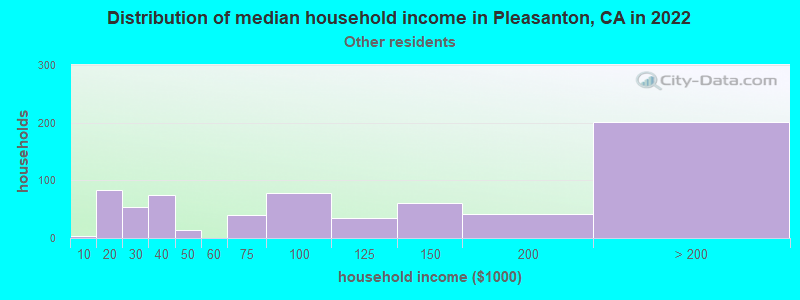
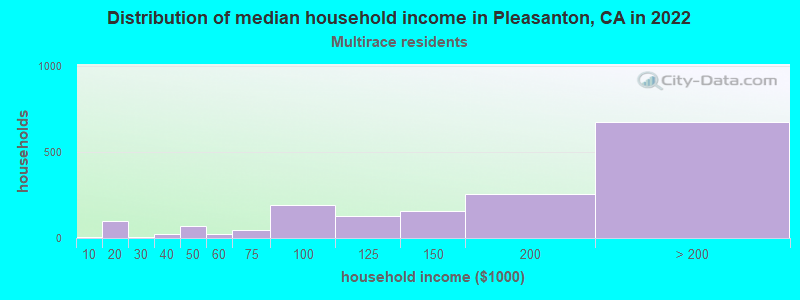
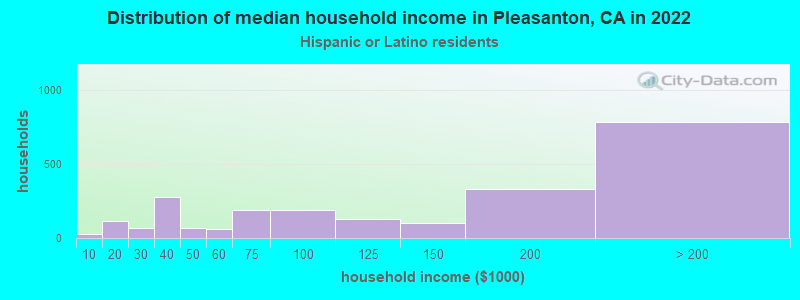
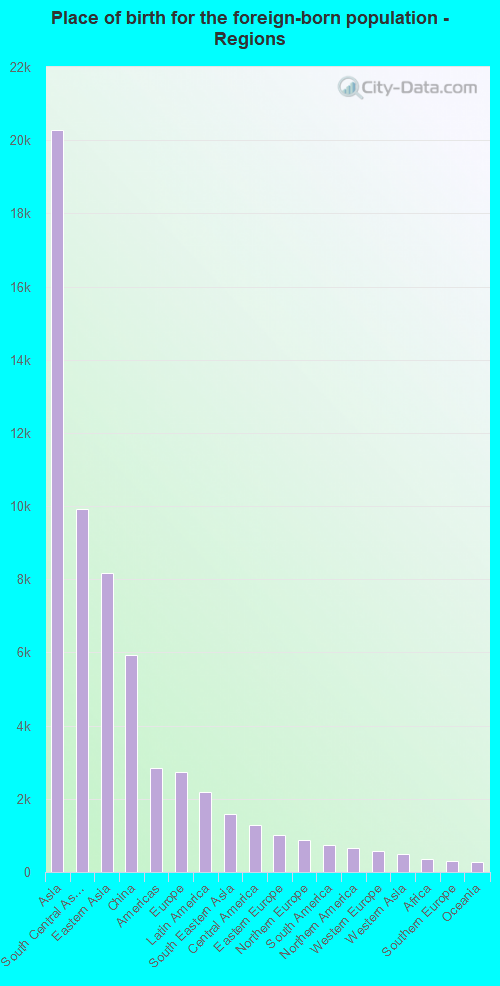
According to 2022 data, the most numerous races in Pleasanton, CA are Hispanic (7,917 residents), White alone (37,912 residents), and Asian alone (30,384 residents). 63.5% of Pleasanton residents speak English at home. 32.1% of Pleasanton, CA residents are foreign-born (24.5% born in Asia, 3.3% born in Europe), which is 19.0% greater than the foreign-born rate of 26.0% across the entire state of California.
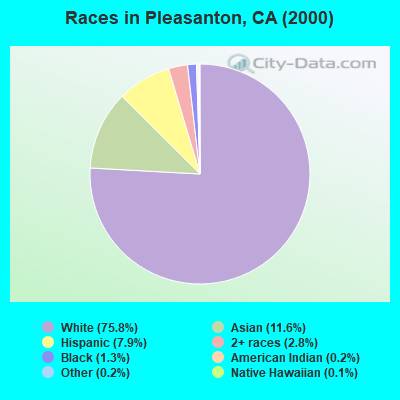
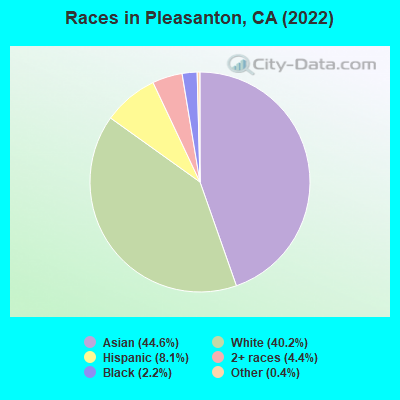
Race distribution in Pleasanton
2000 2022
15,816,790 46.7% White alone 10,966,556 32.4% Hispanic 3,648,860 10.8% Asian alone 2,181,926 6.4% Black alone 903,115 2.7% Two or more races 178,984 0.5% American Indian alone 103,736 0.3% Native Hawaiian and Other 71,681 0.2% Other race alone
15,732,184 40.3% Hispanic 13,160,426 33.7% White alone 5,957,867 15.3% Asian alone 2,025,218 5.2% Black alone 1,663,222 4.3% Two or more races 251,618 0.6% Other race alone 135,777 0.3% Native Hawaiian and Other 103,030 0.3% American Indian alone
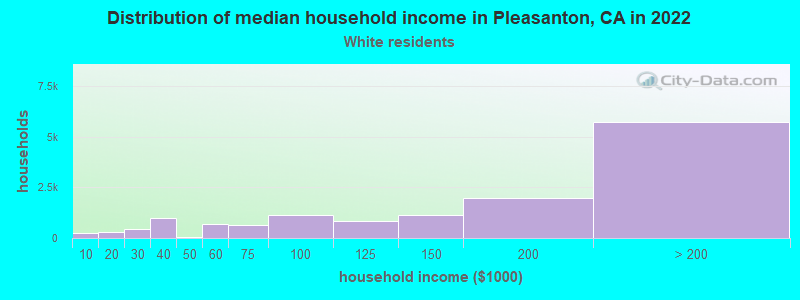
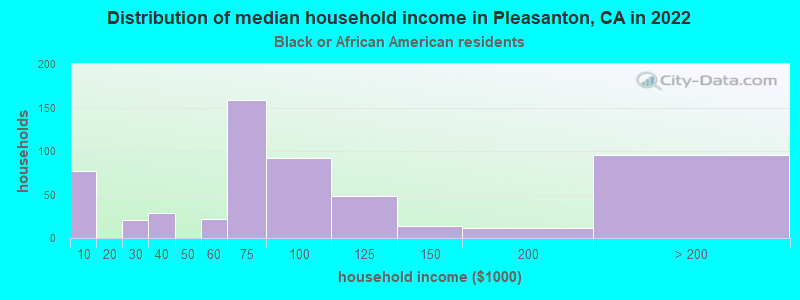
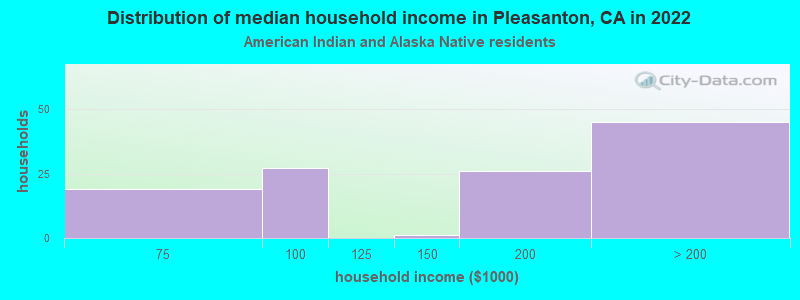
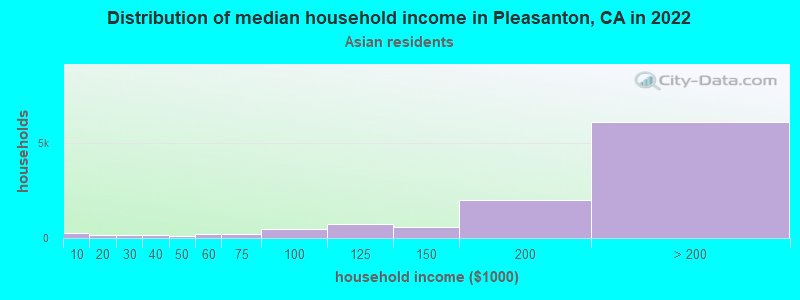
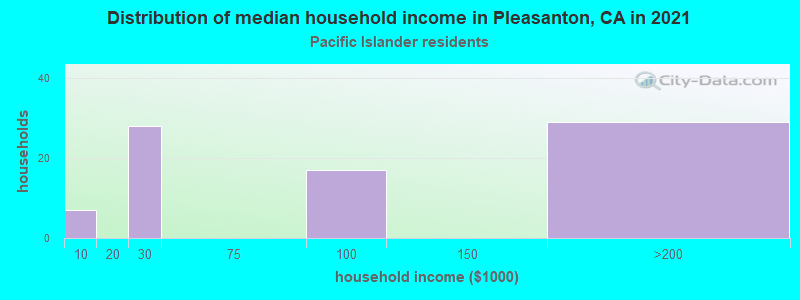
Income and house value in Pleasanton Median household income in 2022 $180,068 White non-Hispanic householders$141,066 Black householders$180,216 American Indian and Alaska Native householdersover $200,000 Asian householders$107,874 Native Hawaiian and other Pacific Islander householders$108,446 Some other race householdersover $200,000 Two or more races householders$143,683 Hispanic or Latino race householdersMedian 2022 house value over $1,000,000 White Non-Hispanic householdersover $1,000,000 Black or African American householders$809,841 American Indian or Alaska Native householders over $1,000,000 Asian householdersover $1,000,000 Some other race householdersover $1,000,000 Two or more races householdersover $1,000,000 Hispanic or Latino householders
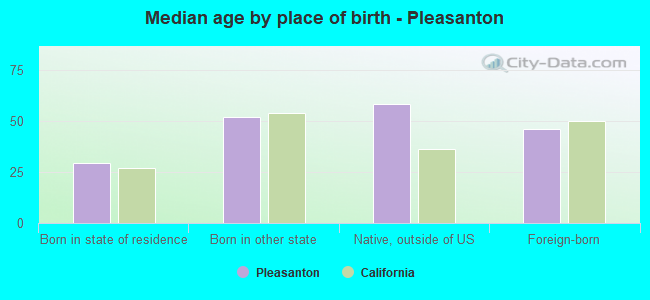
Median age by race in Pleasanton
52.1 Median age for White residents48.7 54.6 37.2 Median age for Black or African American residents33.2 54.3 38.5 Median age for American Indian / Alaska Native residents42.1 31.9 39.6 Median age for Asian residents41.1 38.0 34.7 Median age for Native Hawaiian / Pacific Islander residents33.0 36.0 27.0 Median age for Other race residents26.7 27.3 24.2 Median age for Two or more races residents25.6 22.7 50.7 Median age for White alone residents46.9 53.7 31.1 Median age for Hispanic or Latino residents27.8 38.8
Owner/renter occupied households by race in Pleasanton
House owners and renters - White residents 11,129 70.4% Owner occupied4,673 29.6% Renter occupiedHouse owners and renters - Black or African American residents 117 29.1% Owner occupied285 70.9% Renter occupiedHouse owners and renters - American Indian / Alaska Native residents 88 67.3% Owner occupied43 32.7% Renter occupiedHouse owners and renters - Asian residents 6,573 64.5% Owner occupied3,621 35.5% Renter occupiedHouse owners and renters - Native Hawaiian / Pacific Islander residents 12 10.7% Owner occupied103 89.3% Renter occupiedHouse owners and renters - Other race residents 275 44.7% Owner occupied341 55.3% Renter occupiedHouse owners and renters - Two or more races residents 1,323 64.2% Owner occupied737 35.8% Renter occupiedHouse owners and renters - White alone residents 11,153 69.4% Owner occupied4,929 30.6% Renter occupiedHouse owners and renters - Hispanic or Latino residents 1,249 54.5% Owner occupied1,041 45.5% Renter occupied
Language usage in Pleasanton
English speakers - Total 63.5% of residents of Pleasanton speak English at home.
4.9% of residents speak Spanish at home 2,628 68.1% Speak English very well1,230 31.9% Speak English less than very well32.3% of residents speak other language at home 17,500 68.7% Speak English very well7,985 31.3% Speak English less than very well
English speakers - Born in the United States 91.5% of residents of Pleasanton speak English at home.
1.4% of residents speak Spanish at home 221 94.8% Speak English very well12 5.2% Speak English less than very well7.3% of residents speak other language at home 1,107 93.3% Speak English very well79 6.7% Speak English less than very well
English speakers - Native, born elsewhere 62.6% of residents of Pleasanton speak English at home.
6.8% of residents speak Spanish at home 49 71.0% Speak English very well20 29.0% Speak English less than very well29.9% of residents speak other language at home 133 44.2% Speak English very well168 55.8% Speak English less than very well
English speakers - Foreign-born 17.8% of residents of Pleasanton speak English at home.
6.7% of residents speak Spanish at home 823 47.6% Speak English very well906 52.4% Speak English less than very well78.7% of residents speak other language at home 12,955 63.9% Speak English very well7,329 36.1% Speak English less than very well
White (Caucasian) - Speak only English Native:
98.0% (31,587)Foreign-born:
25.3% (1,068)
White (Caucasian) - Speak another language Native:
5.9% (1,901)Foreign-born:
76.9% (3,249)
Black or African American - Speak only English Native:
97.5% (1,065)Foreign-born:
100.0% (314)
Black or African American - Speak another language Native:
2.5% (27)Foreign-born:
3.1% (10)
American Indian / Alaska Native - Speak another language Native:
12.0% (33)Foreign-born:
100.0% (30)
Asian - Speak only English Native:
61.3% (4,761)Foreign-born:
11.7% (2,225)
Asian - Speak another language Native:
39.0% (3,029)Foreign-born:
88.3% (16,732)
Native Hawaiian / Pacific Islander - Speak only English Native:
87.8% (201)Foreign-born:
76.5% (99)
Other race - Speak only English Native:
65.5% (869)Foreign-born:
26.9% (205)
Other race - Speak another language Native:
44.5% (590)Foreign-born:
83.8% (641)
Two or more races - Speak only English Native:
65.3% (4,821)Foreign-born:
13.1% (496)
Two or more races - Speak another language Native:
31.8% (2,345)Foreign-born:
83.0% (3,142)
White alone - Speak only English Native:
94.0% (30,968)Foreign-born:
24.7% (1,163)
White alone - Speak another language Native:
6.0% (1,985)Foreign-born:
75.5% (3,563)
Hispanic or Latino - Speak another language Native:
38.6% (2,573)Foreign-born:
98.5% (2,679)
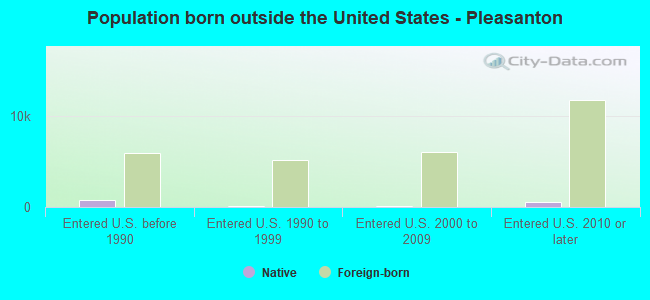
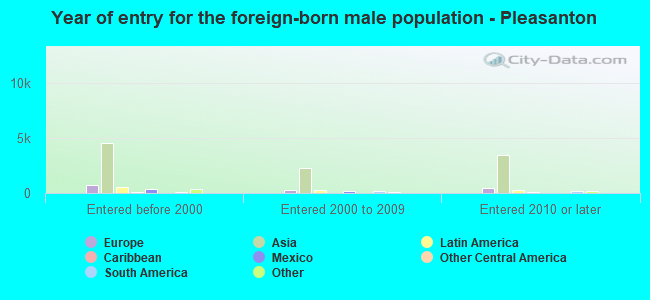
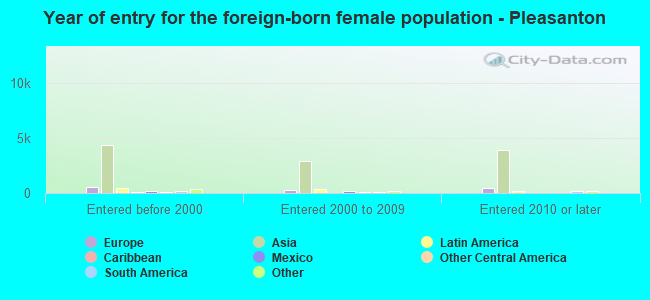
Foreign-born residents in Pleasanton 26,502 residents are foreign born (24.5% Asia , 3.3% Europe ).
This city:
32.1%California:
100.0%
Marital status for residents in Pleasanton Marital status - White (Caucasian) population 15 years and over
Males 24.4% Never married63.5% Now married1.7% Separated1.4% Widowed9.0% DivorcedFemales 17.4% Never married60.4% Now married2.5% Separated11.4% Widowed8.2% DivorcedWomen who gave birth in the past 12 months Now married:
100.0% (289)Unmarried:
0.0% (0)
Women who did not give birth in the past 12 months Now married:
53.9% (3,133)Unmarried:
46.1% (2,683)
Marital status - Black or African American population 15 years and over
Males 43.8% Never married37.1% Now married2.2% Separated0.3% Widowed16.6% DivorcedFemales 31.7% Never married30.0% Now married5.3% Separated7.1% Widowed25.9% DivorcedWomen who gave birth in the past 12 months Now married:
0.0% (0)Unmarried:
100.0% (37)
Women who did not give birth in the past 12 months Now married:
44.7% (97)Unmarried:
55.3% (120)
Marital status - American Indian / Alaska Native population 15 years and over
Males 29.5% Never married70.5% Now married0.0% Separated0.0% Widowed0.0% DivorcedFemales 25.3% Never married43.4% Now married7.1% Separated10.1% Widowed14.1% DivorcedWomen who gave birth in the past 12 months Now married:
100.0% (15)Unmarried:
0.0% (0)
Women who did not give birth in the past 12 months Now married:
26.8% (19)Unmarried:
73.2% (51)
Marital status - Asian population 15 years and over
Males 15.3% Never married81.7% Now married0.5% Separated0.0% Widowed2.6% DivorcedFemales 12.9% Never married77.8% Now married0.6% Separated2.9% Widowed5.8% DivorcedWomen who gave birth in the past 12 months Now married:
100.0% (429)Unmarried:
0.0% (0)
Women who did not give birth in the past 12 months Now married:
76.0% (5,724)Unmarried:
24.0% (1,811)
Marital status - Native Hawaiian / Pacific Islander population 15 years and over
Males 37.9% Never married62.1% Now married0.0% Separated0.0% Widowed0.0% DivorcedFemales 51.4% Never married24.0% Now married9.1% Separated0.0% Widowed15.4% DivorcedWomen who gave birth in the past 12 months Now married:
0.0% (0)Unmarried:
100.0% (25)
Women who did not give birth in the past 12 months Now married:
26.8% (30)Unmarried:
73.2% (83)
Marital status - Other race population 15 years and over
Males 57.4% Never married38.0% Now married1.1% Separated0.0% Widowed3.4% DivorcedFemales 38.8% Never married36.0% Now married2.9% Separated7.2% Widowed15.1% DivorcedWomen who gave birth in the past 12 months Now married:
100.0% (33)Unmarried:
0.0% (0)
Women who did not give birth in the past 12 months Now married:
40.7% (204)Unmarried:
59.3% (297)
Marital status - Two or more races population 15 years and over
Males 47.4% Never married48.6% Now married0.0% Separated0.8% Widowed3.2% DivorcedFemales 44.8% Never married41.4% Now married0.8% Separated2.6% Widowed10.5% DivorcedWomen who gave birth in the past 12 months Now married:
100.0% (62)Unmarried:
0.0% (0)
Women who did not give birth in the past 12 months Now married:
35.9% (938)Unmarried:
64.1% (1,672)
Marital status - White alone, not Hispanic / Latino population 15 years and over
Males 23.4% Never married64.4% Now married1.4% Separated1.5% Widowed9.2% DivorcedFemales 18.4% Never married59.1% Now married2.8% Separated12.3% Widowed7.5% DivorcedWomen who gave birth in the past 12 months Now married:
100.0% (345)Unmarried:
0.0% (0)
Women who did not give birth in the past 12 months Now married:
52.0% (3,184)Unmarried:
48.0% (2,941)
Marital status - Hispanic or Latino population 15 years and over
Males 45.9% Never married45.8% Now married0.8% Separated1.5% Widowed6.0% DivorcedFemales 29.0% Never married56.4% Now married2.3% Separated2.8% Widowed9.5% DivorcedWomen who gave birth in the past 12 months Now married:
100.0% (59)Unmarried:
0.0% (0)
Women who did not give birth in the past 12 months Now married:
49.3% (829)Unmarried:
50.7% (851)
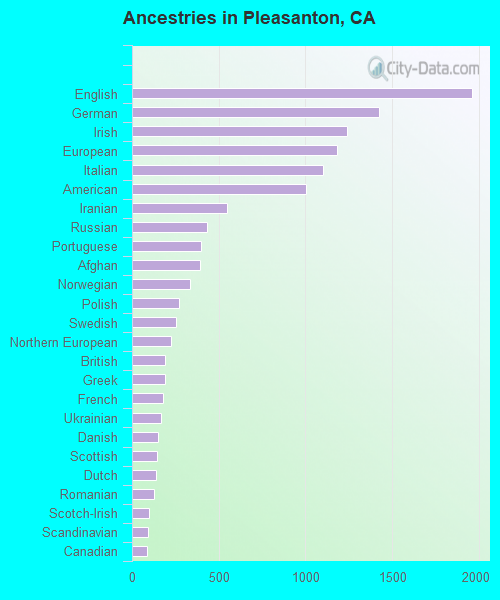
Ancestries in Pleasanton
2,281 4.9% European1,720 3.7% German1,679 3.6% English1,550 3.3% American1,400 3.0% Irish1,228 2.6% Italian806 1.7% Iranian713 1.5% Portuguese496 1.1% British358 0.8% Northern European330 0.7% Polish289 0.6% Norwegian280 0.6% Russian271 0.6% Lebanese233 0.5% Ukrainian230 0.5% Eastern European224 0.5% Scottish220 0.5% Greek218 0.5% Swedish201 0.4% Afghan180 0.4% Slavic179 0.4% French161 0.3% Armenian159 0.3% Scandinavian157 0.3% Canadian149 0.3% Palestinian149 0.3% Danish148 0.3% Dutch138 0.3% Romanian129 0.3% Brazilian117 0.3% Scotch-Irish102 0.2% French Canadian96 0.2% Turkish74 0.2% Czech73 0.2% Welsh65 0.1% Bulgarian56 0.1% Hungarian43 0.09% African43 0.09% Swiss42 0.09% Belizean41 0.09% Serbian38 0.08% Ethiopian38 0.08% Jamaican36 0.08% Croatian33 0.07% Arab28 0.06% Australian28 0.06% Nigerian27 0.06% British West Indian26 0.06% Kenyan25 0.05% Assyrian24 0.05% West Indian24 0.05% Albanian22 0.05% Lithuanian18 0.04% Ghanaian17 0.04% Maltese16 0.03% Finnish15 0.03% New Zealander11 0.02% South African11 0.02% Trinidadian and Tobagonian10 0.02% Moroccan9 0.02% Israeli7 0.02% Belgian4 0.01% Austrian
Geographical mobility in Pleasanton Same house 1 year ago 33,891 91.9% White (Caucasian)1,171 79.7% Black or African American289 81.1% American Indian / Alaska Native23,060 80.9% Asian156 40.0% Native Hawaiian / Pacific Islander1,571 73.2% Other race9,644 87.0% Two or more races35,838 92.8% White alone, not Hispanic / Latino6,907 88.1% Hispanic or LatinoMoved within same county 1,222 3.3% White / Caucasian91 6.2% Black or African American10 2.8% American Indian / Alaska Native1,810 6.4% Asian145 37.0% Native Hawaiian / Pacific Islander126 5.9% Other race704 6.3% Two or more races1,068 2.8% White alone, not Hispanic / Latino355 4.5% Hispanic or LatinoMoved within same state 1,215 3.3% White / Caucasian41 2.8% Black or African American36 10.2% American Indian / Alaska Native2,101 7.4% Asian243 11.3% Other race462 4.2% Two or more races1,167 3.0% White alone, not Hispanic / Latino349 4.5% Hispanic or LatinoMoved from different state 467 1.3% White / Caucasian87 5.9% Black or African American7 2.1% American Indian / Alaska Native1,145 4.0% Asian121 5.6% Other race103 0.9% Two or more races457 1.2% White alone, not Hispanic / Latino168 2.1% Hispanic or LatinoMoved from abroad 252 0.7% White73 4.9% Black or African American13 3.6% American Indian / Alaska Native467 1.6% Asian84 21.5% Native Hawaiian / Pacific Islander81 3.8% Other race89 0.8% Two or more races326 0.8% White alone, not Hispanic / Latino81 1.0% Hispanic or Latino
Children Nativity (place of birth) in Pleasanton
Children under 6 years - Living with two parents Both parents native 1,852 100.0% NativeBoth parents foreign-born 1,393 75.5% Native452 24.5% Foreign-bornOne native, one foreign-born parent 184 100.0% NativeChildren under 6 years - Living with one parent Native parent 215 100.0% NativeForeign-born parent 93 100.0% NativeChildren 6 to 17 years - Living with two parents Both parents native 4,870 100.0% NativeBoth parents foreign-born 3,830 65.7% Native1,998 34.3% Foreign-bornOne native, one foreign-born parent 1,775 95.4% Native85 4.6% Foreign-bornChildren 6 to 17 years - Living with one parent Native parent 921 100.0% NativeForeign-born parent 709 51.9% Native658 48.1% Foreign-born
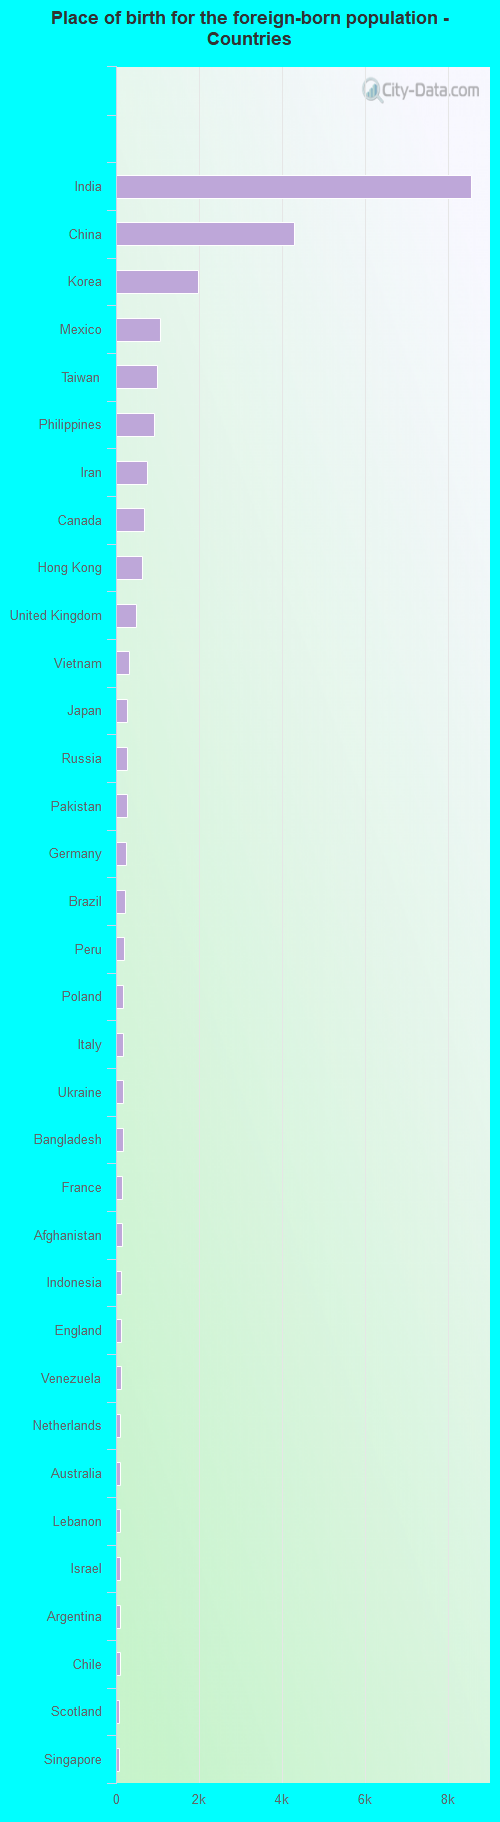
Place of birth for residents in Pleasanton 20,282 Asia9,920 South Central Asia8,185 Eastern Asia5,924 China2,843 Americas2,744 Europe2,176 Latin America1,587 South Eastern Asia1,284 Central America1,021 Eastern Europe861 Northern Europe740 South America666 Northern America568 Western Europe490 Western Asia360 Africa292 Southern Europe271 Oceania163 Australia and New Zealand Subregion151 Caribbean150 Eastern Africa90 Western Africa75 Northern Africa26 Southern Africa8,572 India4,294 China1,982 Korea1,058 Mexico993 Taiwan928 Philippines738 Iran666 Canada636 Hong Kong492 United Kingdom311 Vietnam272 Japan271 Russia256 Pakistan250 Germany214 Brazil187 Peru175 Poland175 Italy174 Ukraine159 Bangladesh144 France138 Afghanistan123 Indonesia117 England110 Venezuela107 Netherlands106 Australia106 Lebanon90 Israel88 Argentina85 Chile83 Scotland82 Singapore77 Ethiopia76 Moldova75 Romania72 Kenya70 El Salvador67 Honduras66 Denmark63 Micronesia57 Burma56 New Zealand52 Egypt51 Lithuania50 Belize48 Bulgaria47 Ireland46 Jordan46 Switzerland45 Thailand44 Portugal43 Bolivia43 Greece41 Sweden39 Belarus37 Malaysia36 Hungary36 Trinidad and Tobago32 Iraq32 Turkey32 Jamaica31 Uzbekistan31 Nicaragua29 Spain26 Armenia26 Kuwait26 South Africa26 Nigeria26 Cuba23 Sri Lanka23 Morocco20 Grenada19 Belgium19 Albania18 Serbia17 Croatia13 Azores Islands13 Norway11 Colombia11 Ghana11 Dominican Republic11 Fiji9 Syria5 Guatemala
Grandparents responsible for own grandchildren in Pleasanton
Grandparents (30 to 59 years) White / Caucasian 44 59.7% Responsible for grandchildren30 40.3% Not responsible for grandchildrenAmerican Indian / Alaska Native 8 100.0% Not responsible for grandchildrenAsian 64 100.0% Not responsible for grandchildrenWhite alone, not Hispanic / Latino 26 47.2% Responsible for grandchildren29 52.8% Not responsible for grandchildrenHispanic or Latino 13 39.9% Responsible for grandchildren19 60.1% Not responsible for grandchildrenGrandparents (60 years and over) White / Caucasian 88 41.0% Responsible for grandchildren126 59.0% Not responsible for grandchildrenAmerican Indian / Alaska Native 6 100.0% Not responsible for grandchildrenAsian 457 100.0% Not responsible for grandchildrenWhite alone, not Hispanic / Latino 86 30.3% Responsible for grandchildren198 69.7% Not responsible for grandchildrenHispanic or Latino 22 54.0% Responsible for grandchildren18 46.0% Not responsible for grandchildren