Races in Pomfret, Connecticut (CT) Detailed Stats
Ancestries, Foreign-born residents, place of birth

Recent posts about races in Pomfret, Connecticut on our local forum with over 2,400,000 registered users:
 | 2024 Connecticut Town Tournament VI (Celebrating the 10-Year Anniversary & Dazzleman's Memorial) (852 replies) |
| Desegregate Connecticut---Raised CT Zoning Bill (2519 replies) |
| Connecticut TOWN TOURNAMENT IV (2020) (849 replies) |
| Retirement Move from Newton, MA to CT (44 replies) |
| Windham County genealogy (2 replies) |
| So... If you own a $1M house, what the heck do you do? (46 replies) |
Latest news about races in Pomfret, CT collected exclusively by city-data.com from local newspapers, TV, and radio stations
2.5% of Pomfret, CT residents are foreign-born (1.9% born in Europe, 0.4% born in Africa), which is 506.1% less than the foreign-born rate of 15.0% across the entire state of Connecticut.
Race distribution in Pomfret

- 3,65496.2%White alone
- 611.6%Hispanic
- 330.9%Two or more races
- 280.7%Asian alone
- 130.3%Black alone
- 40.1%Other race alone
- 50.1%American Indian alone
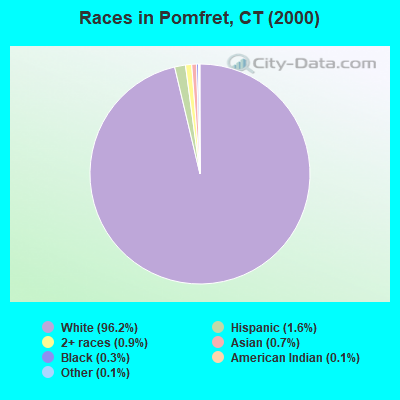
2000
2022
-
- 2,638,84577.5%White alone
- 320,3239.4%Hispanic
- 295,5718.7%Black alone
- 81,5642.4%Asian alone
- 52,8961.6%Two or more races
- 8,1410.2%Other race alone
- 7,2670.2%American Indian alone
- 9580.03%Native Hawaiian and Other
Pacific Islander alone

-
- 2,246,91362.0%White alone
- 658,97818.2%Hispanic
- 353,9739.8%Black alone
- 172,9294.8%Asian alone
- 159,6314.4%Two or more races
- 29,7610.8%Other race alone
- 3,4280.09%American Indian alone
- 5920.02%Native Hawaiian and Other
Pacific Islander alone

Income and house value in Pomfret
- Median household income in 2022
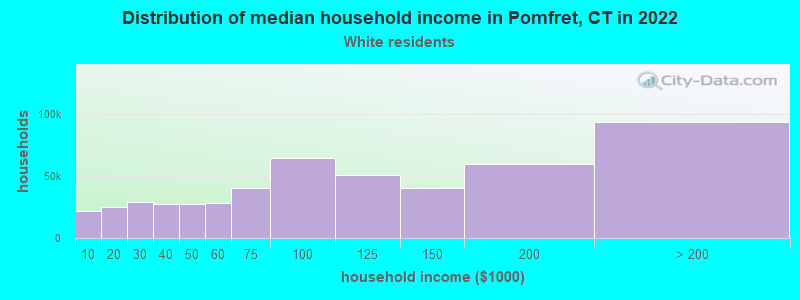
- $100,012White non-Hispanic householders
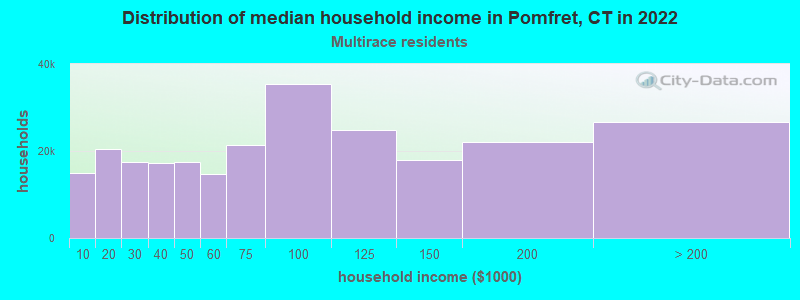
- $168,628Two or more races householders
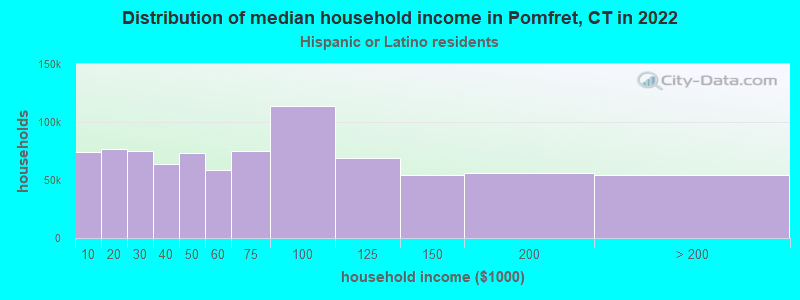
- $194,644Hispanic or Latino race householders
- Median 2022 house value
- $339,200White Non-Hispanic householders
- $486,425Two or more races householders
- $405,354Hispanic or Latino householders
Household income for White non-Hispanic householders
Household income for Two or more races householders
Household income for Hispanic or Latino race householders
Foreign-born residents in Pomfret
94 residents are foreign born (1.9% Europe, 0.4% Africa).
| This city: | 2.5% |
| Connecticut: | 10.9% |
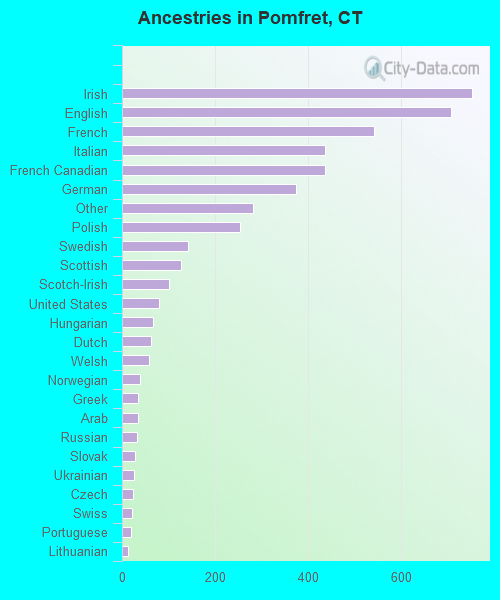
Ancestries in Pomfret

- 75116.0%Irish
- 70615.0%English
- 54211.6%French
- 4379.3%Italian
- 4369.3%French Canadian
- 3748.0%German
- 2826.0%Other
- 2535.4%Polish
- 1413.0%Swedish
- 1262.7%Scottish
- 1012.2%Scotch-Irish
- 791.7%United States
- 661.4%Hungarian
- 621.3%Dutch
- 591.3%Welsh
- 380.8%Norwegian
- 350.7%Greek
- 340.7%Arab
- 330.7%Russian
- 270.6%Slovak
- 260.6%Ukrainian
- 240.5%Czech
- 210.4%Swiss
- 200.4%Portuguese
- 130.3%Lithuanian
- 60.1%Danish
Zip codes: 06259.