Races in Pontiac, Illinois (IL) Detailed Stats
Data:
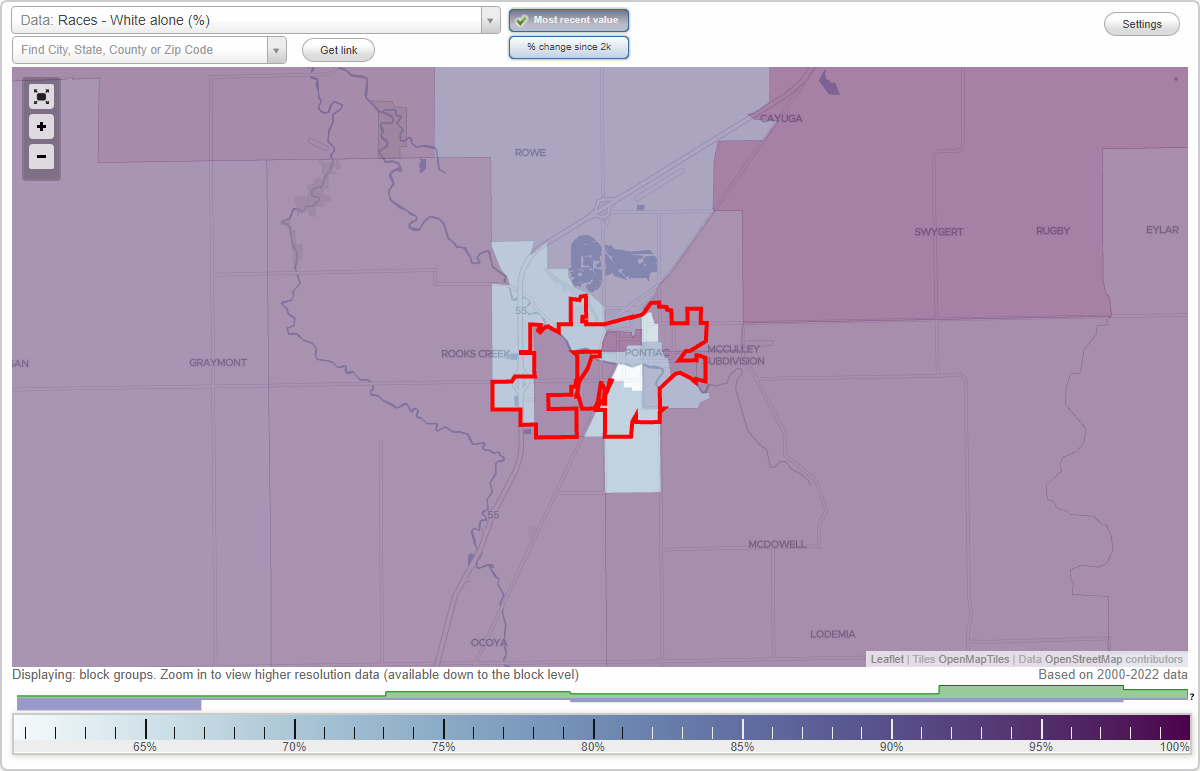
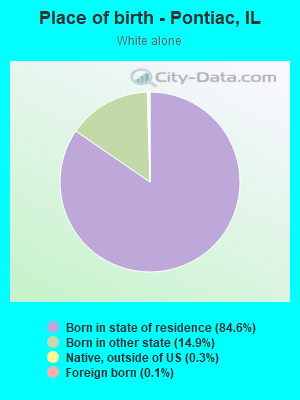
Races - White alone (%)
Races - White alone (% change since 2000)
Races - Black alone (%)
Races - Black alone (% change since 2000)
Races - American Indian alone (%)
Races - American Indian alone (% change since 2000)
Races - Asian alone (%)
Races - Asian alone (% change since 2000)
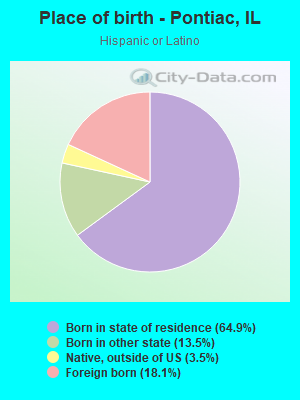
Races - Hispanic (%)
Races - Hispanic (% change since 2000)
Races - Native Hawaiian and Other Pacific Islander alone (%)
Races - Native Hawaiian and Other Pacific Islander alone (% change since 2000)
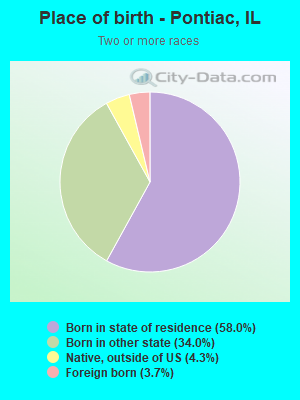
Races - Two or more races(%)
Races - Two or more races(% change since 2000)
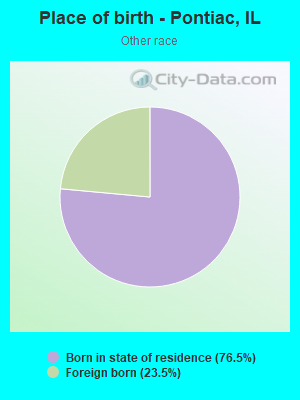
Races - Other race alone (%)
Races - Other race alone (% change since 2000)
Racial diversity
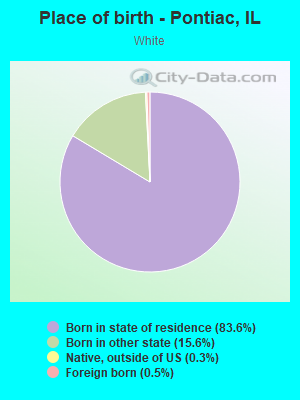
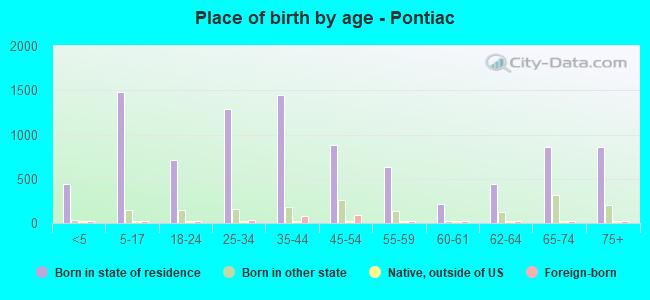
Place of birth - Born in state of residence (%)
Place of birth - Born in state of residence (%) - White
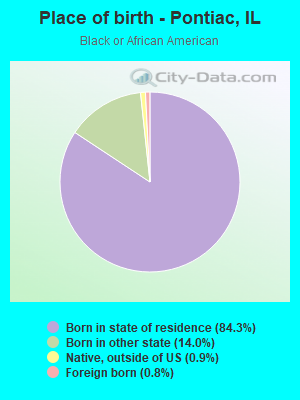
Place of birth - Born in state of residence (%) - Black or African American
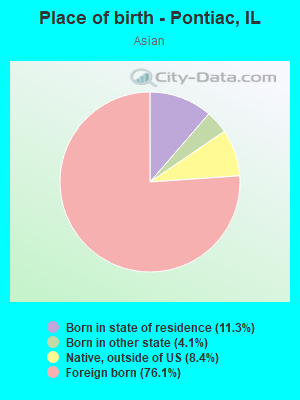
Place of birth - Born in state of residence (%) - Asian
Place of birth - Born in state of residence (%) - Hispanic or Latino
Place of birth - Born in state of residence (%) - American Indian and Alaska Native
Place of birth - Born in state of residence (%) - Multirace
Place of birth - Born in state of residence (%) - Other Race
Place of birth - Born in other state (%)
Place of birth - Born in other state (%) - White
Place of birth - Born in other state (%) - Black or African American
Place of birth - Born in other state (%) - Asian
Place of birth - Born in other state (%) - Hispanic or Latino
Place of birth - Born in other state (%) - American Indian and Alaska Native
Place of birth - Born in other state (%) - Multirace
Place of birth - Born in other state (%) - Other Race
Place of birth - Native, outside of US (%)
Place of birth - Native, outside of US (%) - White
Place of birth - Native, outside of US (%) - Black or African American
Place of birth - Native, outside of US (%) - Asian
Place of birth - Native, outside of US (%) - Hispanic or Latino
Place of birth - Native, outside of US (%) - American Indian and Alaska Native
Place of birth - Native, outside of US (%) - Multirace
Place of birth - Native, outside of US (%) - Other Race
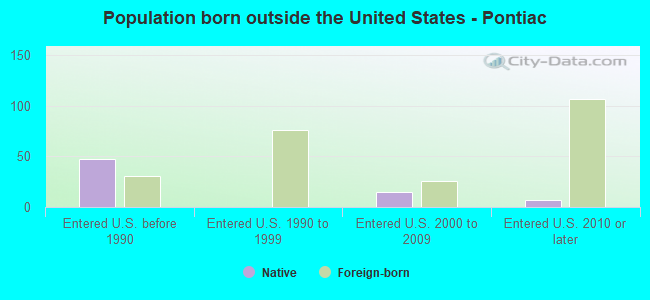
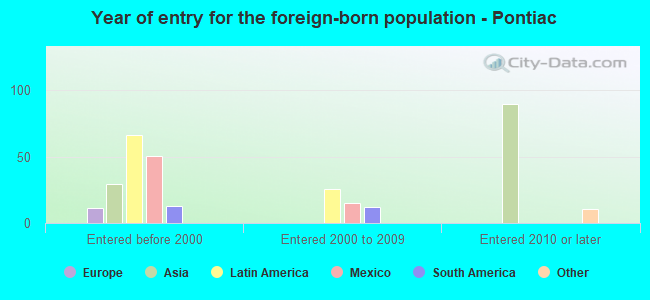
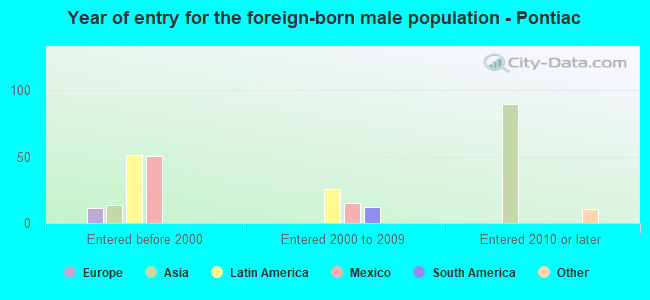
Place of birth - Foreign born (%)
Place of birth - Foreign born (%) - White
Place of birth - Foreign born (%) - Black or African American
Place of birth - Foreign born (%) - Asian
Place of birth - Foreign born (%) - Hispanic or Latino
Place of birth - Foreign born (%) - American Indian and Alaska Native
Place of birth - Foreign born (%) - Multirace
Place of birth - Foreign born (%) - Other Race
Residents speaking English at home (%)
Residents speaking English at home - Born in the United States (%)
Residents speaking English at home - Native, born elsewhere (%)
Residents speaking English at home - Foreign born (%)
Residents speaking Spanish at home (%)
Residents speaking Spanish at home - Born in the United States (%)
Residents speaking Spanish at home - Native, born elsewhere (%)
Residents speaking Spanish at home - Foreign born (%)
Residents speaking other language at home (%)
Residents speaking other language at home - Born in the United States (%)
Residents speaking other language at home - Native, born elsewhere (%)
Residents speaking other language at home - Foreign born (%)
Marital status - Never married (%)
Marital status - Now married (%)
Marital status - Separated (%)
Marital status - Widowed (%)
Marital status - Divorced (%)
Ancestries Reported - Arab (%)
Ancestries Reported - Czech (%)
Ancestries Reported - Danish (%)
Ancestries Reported - Dutch (%)
Ancestries Reported - English (%)
Ancestries Reported - French (%)
Ancestries Reported - French Canadian (%)
Ancestries Reported - German (%)
Ancestries Reported - Greek (%)
Ancestries Reported - Hungarian (%)
Ancestries Reported - Irish (%)
Ancestries Reported - Italian (%)
Ancestries Reported - Lithuanian (%)
Ancestries Reported - Norwegian (%)
Ancestries Reported - Polish (%)
Ancestries Reported - Portuguese (%)
Ancestries Reported - Russian (%)
Ancestries Reported - Scotch-Irish (%)
Ancestries Reported - Scottish (%)
Ancestries Reported - Slovak (%)
Ancestries Reported - Subsaharan African (%)
Ancestries Reported - Swedish (%)
Ancestries Reported - Swiss (%)
Ancestries Reported - Ukrainian (%)
Ancestries Reported - United States (%)
Ancestries Reported - Welsh (%)
Ancestries Reported - West Indian (%)
Ancestries Reported - Other (%)
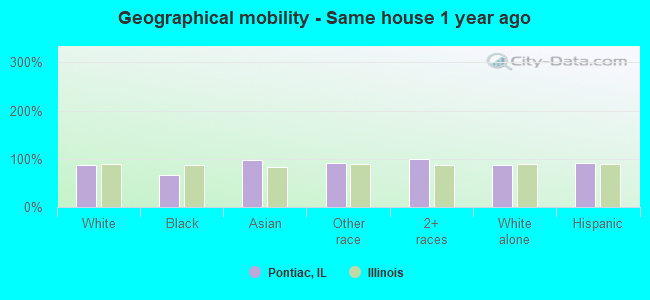
Geographical mobility - Same house 1 year ago (%)
Geographical mobility - Same house 1 year ago (%) - White
Geographical mobility - Same house 1 year ago (%) - Black or African American
Geographical mobility - Same house 1 year ago (%) - Asian
Geographical mobility - Same house 1 year ago (%) - Hispanic or Latino
Geographical mobility - Same house 1 year ago (%) - American Indian and Alaska Native
Geographical mobility - Same house 1 year ago (%) - Multirace
Geographical mobility - Same house 1 year ago (%) - Other Race
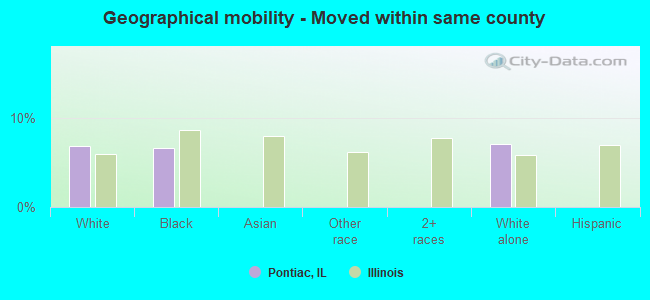
Geographical mobility - Moved within same county (%)
Geographical mobility - Moved within same county (%) - White
Geographical mobility - Moved within same county (%) - Black or African American
Geographical mobility - Moved within same county (%) - Asian
Geographical mobility - Moved within same county (%) - Hispanic or Latino
Geographical mobility - Moved within same county (%) - American Indian and Alaska Native
Geographical mobility - Moved within same county (%) - Multirace
Geographical mobility - Moved within same county (%) - Other Race
Geographical mobility - Moved from different county within same state (%)
Geographical mobility - Moved from different county within same state (%) - White
Geographical mobility - Moved from different county within same state (%) - Black or African American
Geographical mobility - Moved from different county within same state (%) - Asian
Geographical mobility - Moved from different county within same state (%) - Hispanic or Latino
Geographical mobility - Moved from different county within same state (%) - American Indian and Alaska Native
Geographical mobility - Moved from different county within same state (%) - Multirace
Geographical mobility - Moved from different county within same state (%) - Other Race
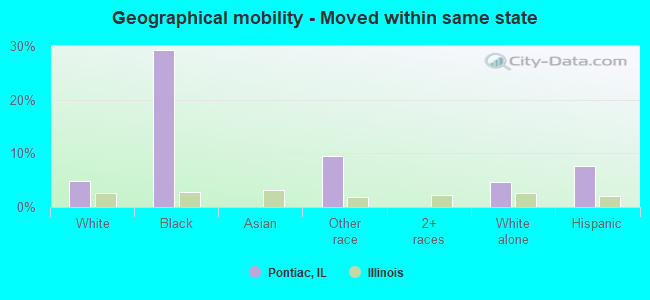
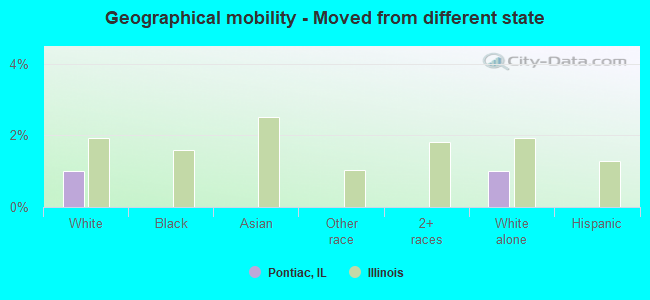
Geographical mobility - Moved from different state (%)
Geographical mobility - Moved from different state (%) - White
Geographical mobility - Moved from different state (%) - Black or African American
Geographical mobility - Moved from different state (%) - Asian
Geographical mobility - Moved from different state (%) - Hispanic or Latino
Geographical mobility - Moved from different state (%) - American Indian and Alaska Native
Geographical mobility - Moved from different state (%) - Multirace
Geographical mobility - Moved from different state (%) - Other Race
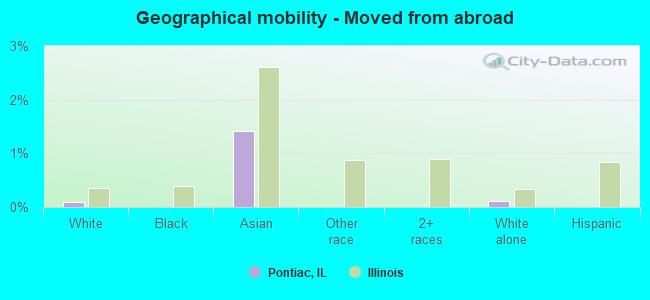
Geographical mobility - Moved from abroad (%)
Geographical mobility - Moved from abroad (%) - White
Geographical mobility - Moved from abroad (%) - Black or African American
Geographical mobility - Moved from abroad (%) - Asian
Geographical mobility - Moved from abroad (%) - Hispanic or Latino
Geographical mobility - Moved from abroad (%) - American Indian and Alaska Native
Geographical mobility - Moved from abroad (%) - Multirace
Geographical mobility - Moved from abroad (%) - Other Race
Place of birth for the foreign-born population - Ireland (%)
Place of birth for the foreign-born population - Denmark (%)
Place of birth for the foreign-born population - Norway (%)
Place of birth for the foreign-born population - Sweden (%)
Place of birth for the foreign-born population - United Kingdom (%)
Place of birth for the foreign-born population - England (%)
Place of birth for the foreign-born population - Scotland (%)
Place of birth for the foreign-born population - Other Northern Europe (%)
Place of birth for the foreign-born population - Austria (%)
Place of birth for the foreign-born population - Belgium (%)
Place of birth for the foreign-born population - France (%)
Place of birth for the foreign-born population - Germany (%)
Place of birth for the foreign-born population - Netherlands (%)
Place of birth for the foreign-born population - Switzerland (%)
Place of birth for the foreign-born population - Other Western Europe (%)
Place of birth for the foreign-born population - Greece (%)
Place of birth for the foreign-born population - Italy (%)
Place of birth for the foreign-born population - Portugal (%)
Place of birth for the foreign-born population - Spain (%)
Place of birth for the foreign-born population - Other Southern Europe (%)
Place of birth for the foreign-born population - Albania (%)
Place of birth for the foreign-born population - Belarus (%)
Place of birth for the foreign-born population - Bosnia and Herzegovina (%)
Place of birth for the foreign-born population - Bulgaria (%)
Place of birth for the foreign-born population - Croatia (%)
Place of birth for the foreign-born population - Czechoslovakia (%)
Place of birth for the foreign-born population - Hungary (%)
Place of birth for the foreign-born population - Latvia (%)
Place of birth for the foreign-born population - Lithuania (%)
Place of birth for the foreign-born population - North Macedonia (Macedonia) (%)
Place of birth for the foreign-born population - Moldova (%)
Place of birth for the foreign-born population - Poland (%)
Place of birth for the foreign-born population - Romania (%)
Place of birth for the foreign-born population - Russia (%)
Place of birth for the foreign-born population - Serbia (%)
Place of birth for the foreign-born population - Ukraine (%)
Place of birth for the foreign-born population - Other Eastern Europe (%)
Place of birth for the foreign-born population - China (%)
Place of birth for the foreign-born population - Hong Kong (%)
Place of birth for the foreign-born population - Taiwan (%)
Place of birth for the foreign-born population - Japan (%)
Place of birth for the foreign-born population - Korea (%)
Place of birth for the foreign-born population - Other Eastern Asia (%)
Place of birth for the foreign-born population - Afghanistan (%)
Place of birth for the foreign-born population - Bangladesh (%)
Place of birth for the foreign-born population - India (%)
Place of birth for the foreign-born population - Iran (%)
Place of birth for the foreign-born population - Kazakhstan (%)
Place of birth for the foreign-born population - Nepal (%)
Place of birth for the foreign-born population - Pakistan (%)
Place of birth for the foreign-born population - Sri Lanka (%)
Place of birth for the foreign-born population - Uzbekistan (%)
Place of birth for the foreign-born population - Other South Central Asia (%)
Place of birth for the foreign-born population - Burma (%)
Place of birth for the foreign-born population - Cambodia (%)
Place of birth for the foreign-born population - Indonesia (%)
Place of birth for the foreign-born population - Laos (%)
Place of birth for the foreign-born population - Malaysia (%)
Place of birth for the foreign-born population - Philippines (%)
Place of birth for the foreign-born population - Singapore (%)
Place of birth for the foreign-born population - Thailand (%)
Place of birth for the foreign-born population - Vietnam (%)
Place of birth for the foreign-born population - Other South Eastern Asia (%)
Place of birth for the foreign-born population - Armenia (%)
Place of birth for the foreign-born population - Iraq (%)
Place of birth for the foreign-born population - Israel (%)
Place of birth for the foreign-born population - Jordan (%)
Place of birth for the foreign-born population - Kuwait (%)
Place of birth for the foreign-born population - Lebanon (%)
Place of birth for the foreign-born population - Saudi Arabia (%)
Place of birth for the foreign-born population - Syria (%)
Place of birth for the foreign-born population - Turkey (%)
Place of birth for the foreign-born population - Yemen (%)
Place of birth for the foreign-born population - Other Western Asia (%)
Place of birth for the foreign-born population - Eritrea (%)
Place of birth for the foreign-born population - Ethiopia (%)
Place of birth for the foreign-born population - Kenya (%)
Place of birth for the foreign-born population - Somalia (%)
Place of birth for the foreign-born population - Uganda (%)
Place of birth for the foreign-born population - Zimbabwe (%)
Place of birth for the foreign-born population - Other Eastern Africa (%)
Place of birth for the foreign-born population - Cameroon (%)
Place of birth for the foreign-born population - Congo (%)
Place of birth for the foreign-born population - Democratic Republic of Congo (Zaire) (%)
Place of birth for the foreign-born population - Other Middle Africa (%)
Place of birth for the foreign-born population - Egypt (%)
Place of birth for the foreign-born population - Morocco (%)
Place of birth for the foreign-born population - Sudan (%)
Place of birth for the foreign-born population - Other Northern Africa (%)
Place of birth for the foreign-born population - South Africa (%)
Place of birth for the foreign-born population - Other Southern Africa (%)
Place of birth for the foreign-born population - Cabo Verde (%)
Place of birth for the foreign-born population - Ghana (%)
Place of birth for the foreign-born population - Liberia (%)
Place of birth for the foreign-born population - Nigeria (%)
Place of birth for the foreign-born population - Senegal (%)
Place of birth for the foreign-born population - Sierra Leone (%)
Place of birth for the foreign-born population - Other Western Africa (%)
Place of birth for the foreign-born population - Australia (%)
Place of birth for the foreign-born population - New Zealand (%)
Place of birth for the foreign-born population - Fiji (%)
Place of birth for the foreign-born population - Micronesia (%)
Place of birth for the foreign-born population - Bahamas (%)
Place of birth for the foreign-born population - Barbados (%)
Place of birth for the foreign-born population - Cuba (%)
Place of birth for the foreign-born population - Dominica (%)
Place of birth for the foreign-born population - Dominican Republic (%)
Place of birth for the foreign-born population - Grenada (%)
Place of birth for the foreign-born population - Haiti (%)
Place of birth for the foreign-born population - Jamaica (%)
Place of birth for the foreign-born population - St. Vincent and the Grenadines (%)
Place of birth for the foreign-born population - Trinidad and Tobago (%)
Place of birth for the foreign-born population - West Indies (%)
Place of birth for the foreign-born population - Other Caribbean (%)
Place of birth for the foreign-born population - Belize (%)
Place of birth for the foreign-born population - Costa Rica (%)
Place of birth for the foreign-born population - El Salvador (%)
Place of birth for the foreign-born population - Guatemala (%)
Place of birth for the foreign-born population - Honduras (%)
Place of birth for the foreign-born population - Mexico (%)
Place of birth for the foreign-born population - Nicaragua (%)
Place of birth for the foreign-born population - Panama (%)
Place of birth for the foreign-born population - Other Central America (%)
Place of birth for the foreign-born population - Argentina (%)
Place of birth for the foreign-born population - Bolivia (%)
Place of birth for the foreign-born population - Brazil (%)
Place of birth for the foreign-born population - Chile (%)
Place of birth for the foreign-born population - Colombia (%)
Place of birth for the foreign-born population - Ecuador (%)
Place of birth for the foreign-born population - Guyana (%)
Place of birth for the foreign-born population - Peru (%)
Place of birth for the foreign-born population - Uruguay (%)
Place of birth for the foreign-born population - Venezuela (%)
Place of birth for the foreign-born population - Other South America (%)
Place of birth for the foreign-born population - Canada (%)
Place of birth for the foreign-born population - Other Northern America (%)
Place of birth for the foreign-born population - Other (%)
Latest news about races in Pontiac, IL collected exclusively by city-data.com from local newspapers, TV, and radio stations
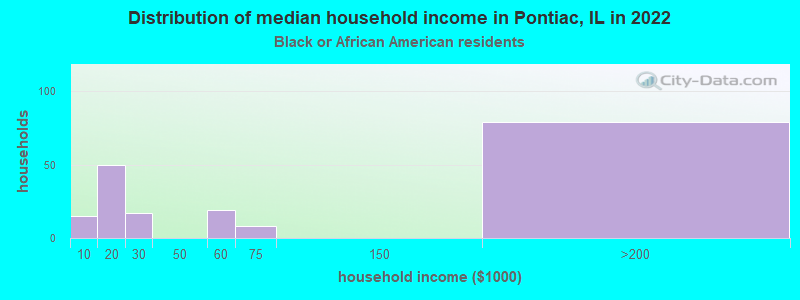
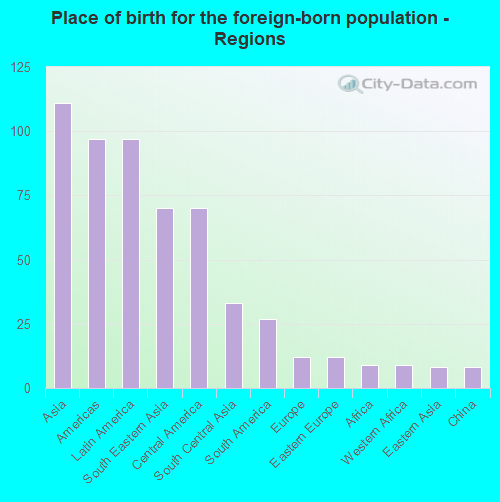
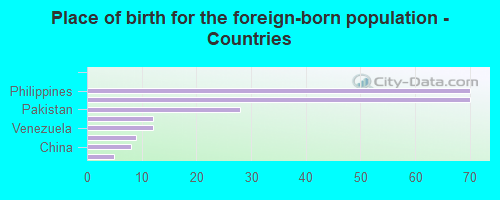
According to 2022 data, the most numerous races in Pontiac, IL are White alone (9,143 residents), Hispanic (541 residents), and Black alone (1,003 residents). 95.6% of Pontiac residents speak English at home. 2.0% of Pontiac, IL residents are foreign-born (1.0% born in Asia, 0.8% born in Latin America), which is 590.4% less than the foreign-born rate of 14.0% across the entire state of Illinois.
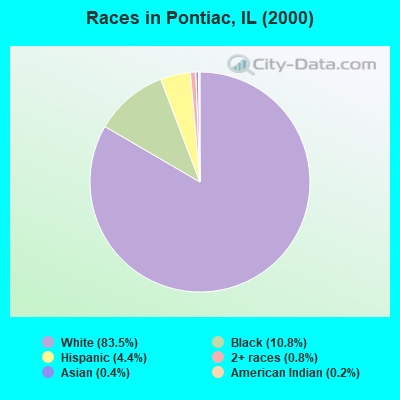
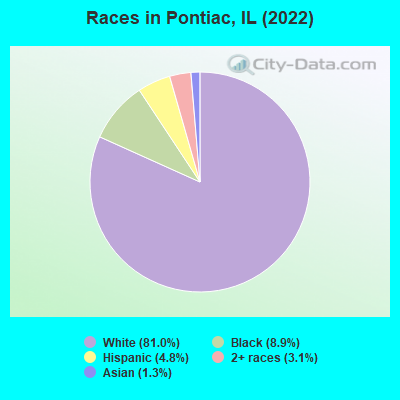
Race distribution in Pontiac
2000 2022
8,424,140 67.8% White alone 1,856,152 14.9% Black alone 1,530,262 12.3% Hispanic 419,916 3.4% Asian alone 153,996 1.2% Two or more races 13,479 0.1% Other race alone 18,232 0.1% American Indian alone 3,116 0.03% Native Hawaiian and Other
7,356,301 58.5% White alone 2,299,726 18.3% Hispanic 1,660,423 13.2% Black alone 747,296 5.9% Asian alone 458,599 3.6% Two or more races 45,386 0.4% Other race alone 10,405 0.08% American Indian alone 3,896 0.03% Native Hawaiian and Other
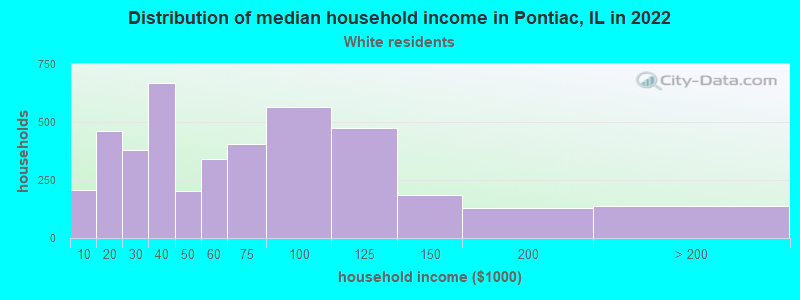
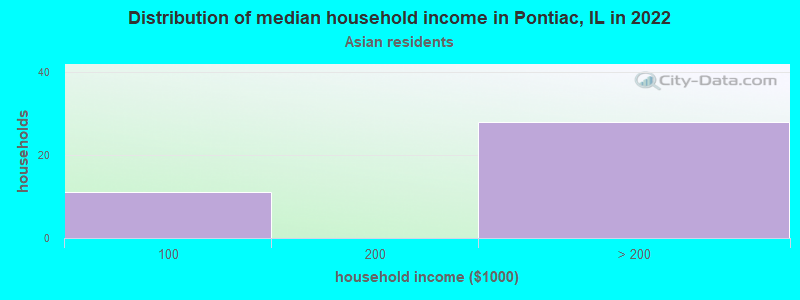
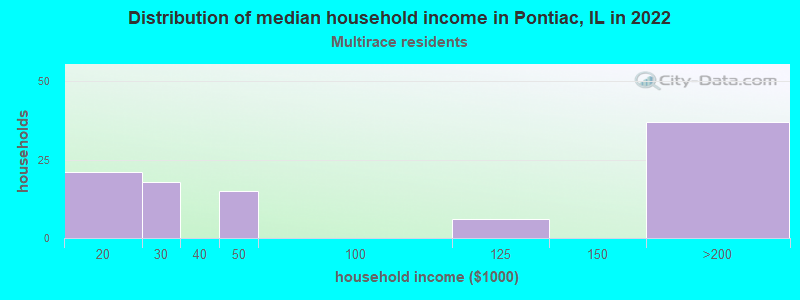
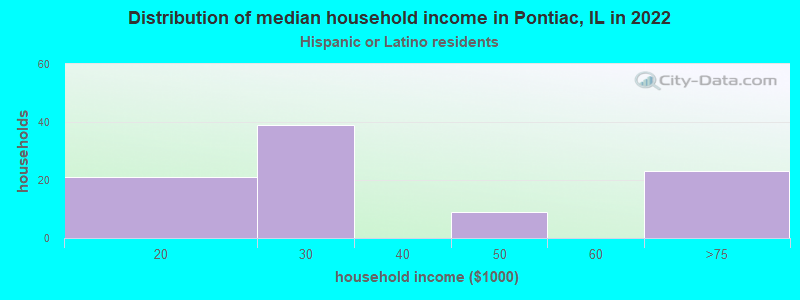
Income and house value in Pontiac Median household income in 2022 $53,309 White non-Hispanic householdersover $200,000 Asian householders$28,882 Hispanic or Latino race householdersMedian 2022 house value $120,548 White Non-Hispanic householders$114,341 Black or African American householders$89,840 American Indian or Alaska Native householders $306,272 Asian householders$119,732 Some other race householders$166,285 Two or more races householders$125,285 Hispanic or Latino householders
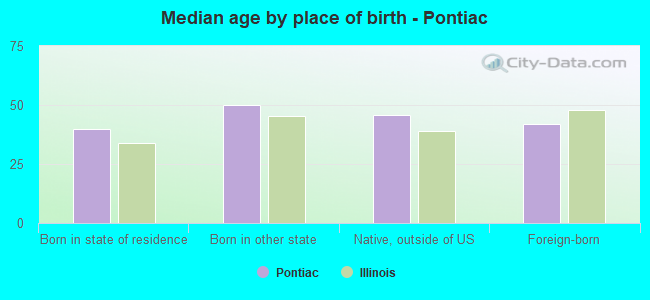
Median age by race in Pontiac
44.0 Median age for White residents41.9 46.6 41.8 Median age for Black or African American residents38.6 42.9 -696,696,696.0 Median age for American Indian / Alaska Native residents-720,238,094.5 -688,956,432.9 46.3 Median age for Asian residents46.4 36.4 -593,236,714.4 Median age for Native Hawaiian / Pacific Islander residents-658,536,584.7 -576,015,108.0 42.1 Median age for Other race residents42.4 34.0 20.4 Median age for Two or more races residents23.0 20.1 43.4 Median age for White alone residents41.2 46.1 35.9 Median age for Hispanic or Latino residents36.6 26.8
Owner/renter occupied households by race in Pontiac
House owners and renters - White residents 2,553 62.3% Owner occupied1,545 37.7% Renter occupiedHouse owners and renters - Black or African American residents 108 55.9% Owner occupied85 44.1% Renter occupiedHouse owners and renters - Asian residents 39 100.0% Owner occupiedHouse owners and renters - Other race residents 34 100.0% Owner occupiedHouse owners and renters - Two or more races residents 47 48.7% Owner occupied50 51.3% Renter occupiedHouse owners and renters - White alone residents 2,596 61.5% Owner occupied1,628 38.5% Renter occupiedHouse owners and renters - Hispanic or Latino residents 69 68.2% Owner occupied32 31.8% Renter occupied
Language usage in Pontiac
English speakers - Total 95.6% of residents of Pontiac speak English at home.
3.2% of residents speak Spanish at home 248 72.1% Speak English very well96 27.9% Speak English less than very well0.7% of residents speak other language at home 72 100.0% Speak English very well
English speakers - Born in the United States 92.6% of residents of Pontiac speak English at home.
6.9% of residents speak Spanish at home 115 97.5% Speak English very well3 2.5% Speak English less than very well
English speakers - Native, born elsewhere 75.0% of residents of Pontiac speak English at home.
26.4% of residents speak Spanish at home 19 100.0% Speak English very well
English speakers - Foreign-born 44.1% of residents of Pontiac speak English at home.
31.0% of residents speak Spanish at home 71 100.0% Speak English less than very well22.3% of residents speak other language at home 51 100.0% Speak English very well
White (Caucasian) - Speak only English Native:
99.6% (8,542)Foreign-born:
20.5% (10)
White (Caucasian) - Speak another language Native:
1.9% (161)Foreign-born:
79.9% (39)
Asian - Speak only English Native:
98.7% (22)Foreign-born:
63.9% (72)
Other race - Speak another language Native:
7.2% (8)Foreign-born:
99.9% (34)
Two or more races - Speak only English Native:
84.7% (431)Foreign-born:
95.3% (21)
White alone - Speak only English Native:
98.6% (8,602)Foreign-born:
92.8% (11)
Hispanic or Latino - Speak only English Native:
52.7% (197)Foreign-born:
15.1% (15)
Hispanic or Latino - Speak another language Native:
48.1% (179)Foreign-born:
84.7% (83)
Foreign-born residents in Pontiac 229 residents are foreign born (1.0% Asia , 0.8% Latin America ).
This city:
2.0%Illinois:
14.1%
Marital status for residents in Pontiac Marital status - White (Caucasian) population 15 years and over
Males 34.1% Never married45.1% Now married1.8% Separated3.8% Widowed15.2% DivorcedFemales 25.1% Never married41.1% Now married1.3% Separated16.2% Widowed16.3% DivorcedWomen who gave birth in the past 12 months Now married:
52.9% (56)Unmarried:
47.1% (50)
Women who did not give birth in the past 12 months Now married:
40.0% (677)Unmarried:
60.0% (1,017)
Marital status - Black or African American population 15 years and over
Males 67.0% Never married15.4% Now married9.3% Separated2.4% Widowed5.9% DivorcedFemales 62.6% Never married0.0% Now married0.0% Separated22.7% Widowed14.7% DivorcedWomen who did not give birth in the past 12 months Now married:
0.0% (0)Unmarried:
100.0% (125)
Marital status - Asian population 15 years and over
Males 0.0% Never married100.0% Now married0.0% Separated0.0% Widowed0.0% DivorcedFemales 0.0% Never married100.0% Now married0.0% Separated0.0% Widowed0.0% DivorcedWomen who did not give birth in the past 12 months Now married:
100.0% (17)Unmarried:
0.0% (0)
Marital status - Other race population 15 years and over
Males 47.8% Never married42.0% Now married0.0% Separated10.1% Widowed0.0% DivorcedFemales 30.8% Never married0.0% Now married0.0% Separated0.0% Widowed69.2% DivorcedWomen who did not give birth in the past 12 months Now married:
0.0% (0)Unmarried:
100.0% (45)
Marital status - Two or more races population 15 years and over
Males 82.4% Never married15.4% Now married0.0% Separated0.0% Widowed2.2% DivorcedFemales 76.4% Never married18.5% Now married0.0% Separated0.0% Widowed5.1% DivorcedWomen who did not give birth in the past 12 months Now married:
16.3% (36)Unmarried:
83.7% (186)
Marital status - White alone, not Hispanic / Latino population 15 years and over
Males 32.2% Never married46.8% Now married1.9% Separated3.6% Widowed15.4% DivorcedFemales 25.2% Never married40.8% Now married1.3% Separated16.3% Widowed16.4% DivorcedWomen who gave birth in the past 12 months Now married:
48.1% (50)Unmarried:
51.9% (53)
Women who did not give birth in the past 12 months Now married:
40.0% (721)Unmarried:
60.0% (1,084)
Marital status - Hispanic or Latino population 15 years and over
Males 67.2% Never married18.7% Now married0.0% Separated7.1% Widowed7.1% DivorcedFemales 51.4% Never married16.5% Now married0.0% Separated0.0% Widowed32.1% DivorcedWomen who gave birth in the past 12 months Now married:
100.0% (11)Unmarried:
0.0% (0)
Women who did not give birth in the past 12 months Now married:
0.0% (0)Unmarried:
100.0% (92)
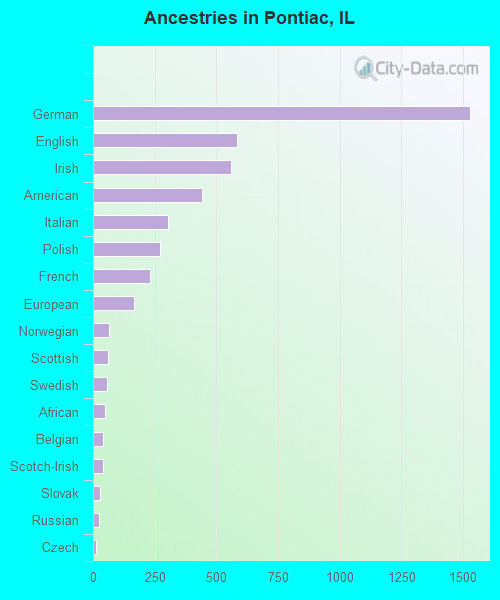
Ancestries in Pontiac
1,529 24.4% German583 9.3% English561 9.0% Irish440 7.0% American305 4.9% Italian271 4.3% Polish230 3.7% French165 2.6% European65 1.0% Norwegian60 1.0% Scottish57 0.9% Swedish48 0.8% African41 0.7% Belgian40 0.6% Scotch-Irish29 0.5% Slovak26 0.4% Russian14 0.2% Czech13 0.2% French Canadian10 0.2% Eastern European9 0.1% Austrian9 0.1% Nigerian8 0.1% Hungarian7 0.1% Slavic2 0.03% Dutch
Children Nativity (place of birth) in Pontiac
Children under 6 years - Living with two parents Both parents native 253 100.0% NativeBoth parents foreign-born 10 100.0% NativeChildren under 6 years - Living with one parent Native parent 358 100.0% Native
Children 6 to 17 years - Living with two parents Both parents native 803 99.0% Native8 1.0% Foreign-bornOne native, one foreign-born parent 62 100.0% NativeChildren 6 to 17 years - Living with one parent Native parent 551 100.0% Native
Grandparents responsible for own grandchildren in Pontiac
Grandparents (30 to 59 years) White / Caucasian 19 53.2% Responsible for grandchildren16 46.8% Not responsible for grandchildrenWhite alone, not Hispanic / Latino 20 50.4% Responsible for grandchildren20 49.6% Not responsible for grandchildrenGrandparents (60 years and over) White / Caucasian 8 33.1% Responsible for grandchildren16 66.9% Not responsible for grandchildrenWhite alone, not Hispanic / Latino 9 32.1% Responsible for grandchildren18 67.9% Not responsible for grandchildren