Races in Port Angeles, Washington (WA) Detailed Stats
Data:
Races - White alone (%)
Races - White alone (% change since 2000)
Races - Black alone (%)
Races - Black alone (% change since 2000)
Races - American Indian alone (%)
Races - American Indian alone (% change since 2000)
Races - Asian alone (%)
Races - Asian alone (% change since 2000)
Races - Hispanic (%)
Races - Hispanic (% change since 2000)
Races - Native Hawaiian and Other Pacific Islander alone (%)
Races - Native Hawaiian and Other Pacific Islander alone (% change since 2000)
Races - Two or more races(%)
Races - Two or more races(% change since 2000)
Races - Other race alone (%)
Races - Other race alone (% change since 2000)
Racial diversity
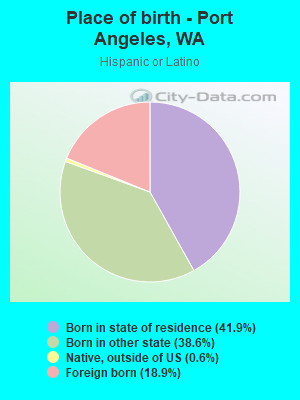
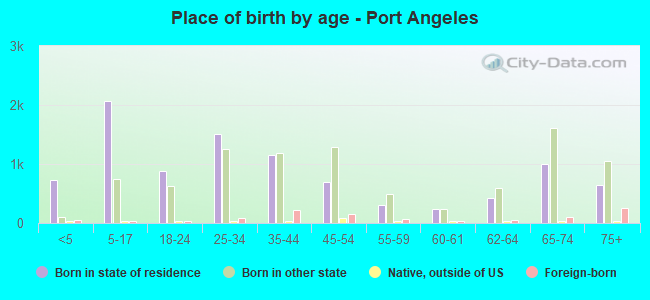
Place of birth - Born in state of residence (%)
Place of birth - Born in state of residence (%) - White
Place of birth - Born in state of residence (%) - Black or African American
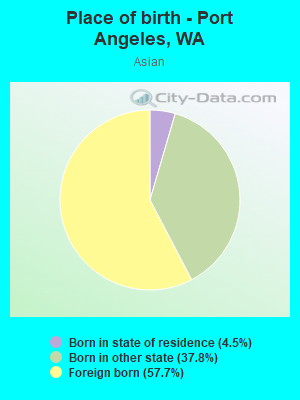
Place of birth - Born in state of residence (%) - Asian
Place of birth - Born in state of residence (%) - Hispanic or Latino
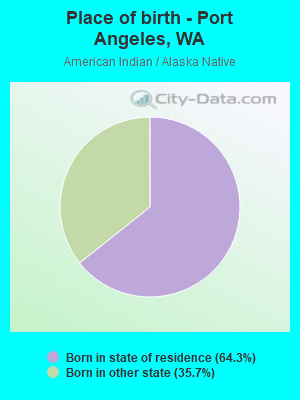
Place of birth - Born in state of residence (%) - American Indian and Alaska Native
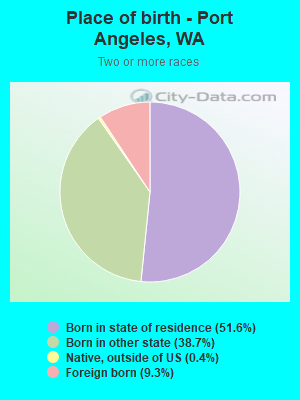
Place of birth - Born in state of residence (%) - Multirace
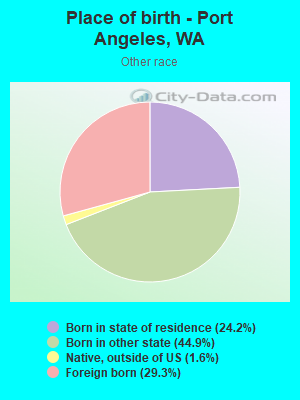
Place of birth - Born in state of residence (%) - Other Race
Place of birth - Born in other state (%)
Place of birth - Born in other state (%) - White
Place of birth - Born in other state (%) - Black or African American
Place of birth - Born in other state (%) - Asian
Place of birth - Born in other state (%) - Hispanic or Latino
Place of birth - Born in other state (%) - American Indian and Alaska Native
Place of birth - Born in other state (%) - Multirace
Place of birth - Born in other state (%) - Other Race
Place of birth - Native, outside of US (%)
Place of birth - Native, outside of US (%) - White
Place of birth - Native, outside of US (%) - Black or African American
Place of birth - Native, outside of US (%) - Asian
Place of birth - Native, outside of US (%) - Hispanic or Latino
Place of birth - Native, outside of US (%) - American Indian and Alaska Native
Place of birth - Native, outside of US (%) - Multirace
Place of birth - Native, outside of US (%) - Other Race
Place of birth - Foreign born (%)
Place of birth - Foreign born (%) - White
Place of birth - Foreign born (%) - Black or African American
Place of birth - Foreign born (%) - Asian
Place of birth - Foreign born (%) - Hispanic or Latino
Place of birth - Foreign born (%) - American Indian and Alaska Native
Place of birth - Foreign born (%) - Multirace
Place of birth - Foreign born (%) - Other Race
Residents speaking English at home (%)
Residents speaking English at home - Born in the United States (%)
Residents speaking English at home - Native, born elsewhere (%)
Residents speaking English at home - Foreign born (%)
Residents speaking Spanish at home (%)
Residents speaking Spanish at home - Born in the United States (%)
Residents speaking Spanish at home - Native, born elsewhere (%)
Residents speaking Spanish at home - Foreign born (%)
Residents speaking other language at home (%)
Residents speaking other language at home - Born in the United States (%)
Residents speaking other language at home - Native, born elsewhere (%)
Residents speaking other language at home - Foreign born (%)
Marital status - Never married (%)
Marital status - Now married (%)
Marital status - Separated (%)
Marital status - Widowed (%)
Marital status - Divorced (%)
Ancestries Reported - Arab (%)
Ancestries Reported - Czech (%)
Ancestries Reported - Danish (%)
Ancestries Reported - Dutch (%)
Ancestries Reported - English (%)
Ancestries Reported - French (%)
Ancestries Reported - French Canadian (%)
Ancestries Reported - German (%)
Ancestries Reported - Greek (%)
Ancestries Reported - Hungarian (%)
Ancestries Reported - Irish (%)
Ancestries Reported - Italian (%)
Ancestries Reported - Lithuanian (%)
Ancestries Reported - Norwegian (%)
Ancestries Reported - Polish (%)
Ancestries Reported - Portuguese (%)
Ancestries Reported - Russian (%)
Ancestries Reported - Scotch-Irish (%)
Ancestries Reported - Scottish (%)
Ancestries Reported - Slovak (%)
Ancestries Reported - Subsaharan African (%)
Ancestries Reported - Swedish (%)
Ancestries Reported - Swiss (%)
Ancestries Reported - Ukrainian (%)
Ancestries Reported - United States (%)
Ancestries Reported - Welsh (%)
Ancestries Reported - West Indian (%)
Ancestries Reported - Other (%)
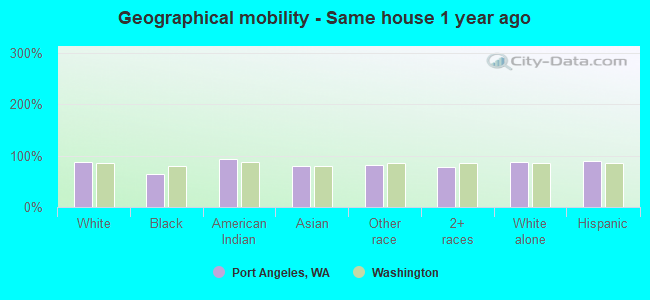
Geographical mobility - Same house 1 year ago (%)
Geographical mobility - Same house 1 year ago (%) - White
Geographical mobility - Same house 1 year ago (%) - Black or African American
Geographical mobility - Same house 1 year ago (%) - Asian
Geographical mobility - Same house 1 year ago (%) - Hispanic or Latino
Geographical mobility - Same house 1 year ago (%) - American Indian and Alaska Native
Geographical mobility - Same house 1 year ago (%) - Multirace
Geographical mobility - Same house 1 year ago (%) - Other Race
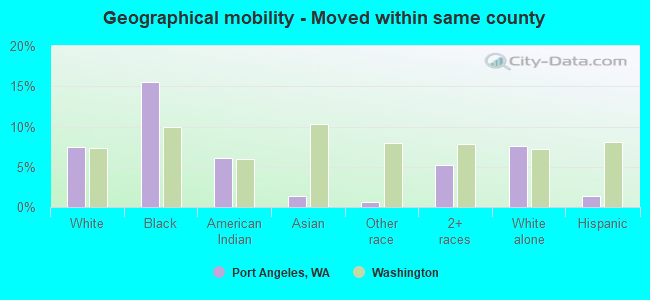
Geographical mobility - Moved within same county (%)
Geographical mobility - Moved within same county (%) - White
Geographical mobility - Moved within same county (%) - Black or African American
Geographical mobility - Moved within same county (%) - Asian
Geographical mobility - Moved within same county (%) - Hispanic or Latino
Geographical mobility - Moved within same county (%) - American Indian and Alaska Native
Geographical mobility - Moved within same county (%) - Multirace
Geographical mobility - Moved within same county (%) - Other Race
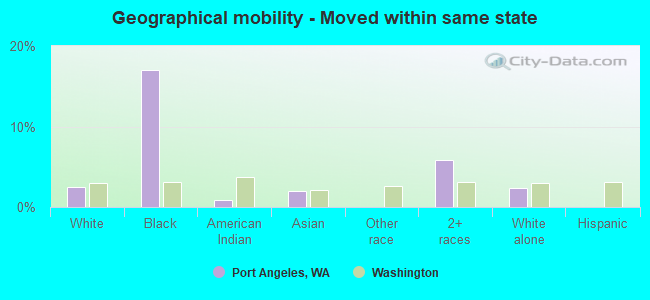
Geographical mobility - Moved from different county within same state (%)
Geographical mobility - Moved from different county within same state (%) - White
Geographical mobility - Moved from different county within same state (%) - Black or African American
Geographical mobility - Moved from different county within same state (%) - Asian
Geographical mobility - Moved from different county within same state (%) - Hispanic or Latino
Geographical mobility - Moved from different county within same state (%) - American Indian and Alaska Native
Geographical mobility - Moved from different county within same state (%) - Multirace
Geographical mobility - Moved from different county within same state (%) - Other Race
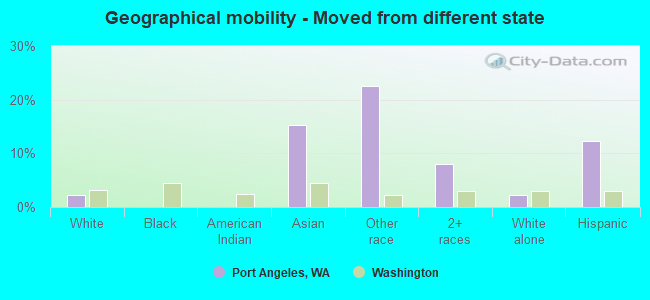
Geographical mobility - Moved from different state (%)
Geographical mobility - Moved from different state (%) - White
Geographical mobility - Moved from different state (%) - Black or African American
Geographical mobility - Moved from different state (%) - Asian
Geographical mobility - Moved from different state (%) - Hispanic or Latino
Geographical mobility - Moved from different state (%) - American Indian and Alaska Native
Geographical mobility - Moved from different state (%) - Multirace
Geographical mobility - Moved from different state (%) - Other Race
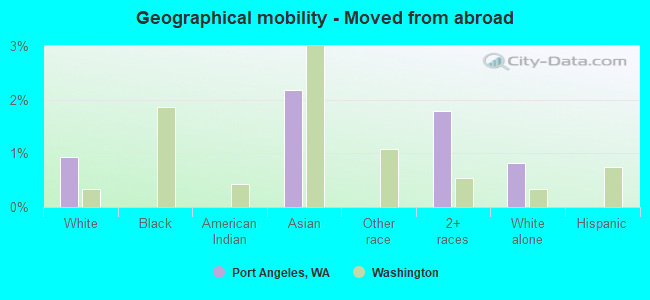
Geographical mobility - Moved from abroad (%)
Geographical mobility - Moved from abroad (%) - White
Geographical mobility - Moved from abroad (%) - Black or African American
Geographical mobility - Moved from abroad (%) - Asian
Geographical mobility - Moved from abroad (%) - Hispanic or Latino
Geographical mobility - Moved from abroad (%) - American Indian and Alaska Native
Geographical mobility - Moved from abroad (%) - Multirace
Geographical mobility - Moved from abroad (%) - Other Race
Place of birth for the foreign-born population - Ireland (%)
Place of birth for the foreign-born population - Denmark (%)
Place of birth for the foreign-born population - Norway (%)
Place of birth for the foreign-born population - Sweden (%)
Place of birth for the foreign-born population - United Kingdom (%)
Place of birth for the foreign-born population - England (%)
Place of birth for the foreign-born population - Scotland (%)
Place of birth for the foreign-born population - Other Northern Europe (%)
Place of birth for the foreign-born population - Austria (%)
Place of birth for the foreign-born population - Belgium (%)
Place of birth for the foreign-born population - France (%)
Place of birth for the foreign-born population - Germany (%)
Place of birth for the foreign-born population - Netherlands (%)
Place of birth for the foreign-born population - Switzerland (%)
Place of birth for the foreign-born population - Other Western Europe (%)
Place of birth for the foreign-born population - Greece (%)
Place of birth for the foreign-born population - Italy (%)
Place of birth for the foreign-born population - Portugal (%)
Place of birth for the foreign-born population - Spain (%)
Place of birth for the foreign-born population - Other Southern Europe (%)
Place of birth for the foreign-born population - Albania (%)
Place of birth for the foreign-born population - Belarus (%)
Place of birth for the foreign-born population - Bosnia and Herzegovina (%)
Place of birth for the foreign-born population - Bulgaria (%)
Place of birth for the foreign-born population - Croatia (%)
Place of birth for the foreign-born population - Czechoslovakia (%)
Place of birth for the foreign-born population - Hungary (%)
Place of birth for the foreign-born population - Latvia (%)
Place of birth for the foreign-born population - Lithuania (%)
Place of birth for the foreign-born population - North Macedonia (Macedonia) (%)
Place of birth for the foreign-born population - Moldova (%)
Place of birth for the foreign-born population - Poland (%)
Place of birth for the foreign-born population - Romania (%)
Place of birth for the foreign-born population - Russia (%)
Place of birth for the foreign-born population - Serbia (%)
Place of birth for the foreign-born population - Ukraine (%)
Place of birth for the foreign-born population - Other Eastern Europe (%)
Place of birth for the foreign-born population - China (%)
Place of birth for the foreign-born population - Hong Kong (%)
Place of birth for the foreign-born population - Taiwan (%)
Place of birth for the foreign-born population - Japan (%)
Place of birth for the foreign-born population - Korea (%)
Place of birth for the foreign-born population - Other Eastern Asia (%)
Place of birth for the foreign-born population - Afghanistan (%)
Place of birth for the foreign-born population - Bangladesh (%)
Place of birth for the foreign-born population - India (%)
Place of birth for the foreign-born population - Iran (%)
Place of birth for the foreign-born population - Kazakhstan (%)
Place of birth for the foreign-born population - Nepal (%)
Place of birth for the foreign-born population - Pakistan (%)
Place of birth for the foreign-born population - Sri Lanka (%)
Place of birth for the foreign-born population - Uzbekistan (%)
Place of birth for the foreign-born population - Other South Central Asia (%)
Place of birth for the foreign-born population - Burma (%)
Place of birth for the foreign-born population - Cambodia (%)
Place of birth for the foreign-born population - Indonesia (%)
Place of birth for the foreign-born population - Laos (%)
Place of birth for the foreign-born population - Malaysia (%)
Place of birth for the foreign-born population - Philippines (%)
Place of birth for the foreign-born population - Singapore (%)
Place of birth for the foreign-born population - Thailand (%)
Place of birth for the foreign-born population - Vietnam (%)
Place of birth for the foreign-born population - Other South Eastern Asia (%)
Place of birth for the foreign-born population - Armenia (%)
Place of birth for the foreign-born population - Iraq (%)
Place of birth for the foreign-born population - Israel (%)
Place of birth for the foreign-born population - Jordan (%)
Place of birth for the foreign-born population - Kuwait (%)
Place of birth for the foreign-born population - Lebanon (%)
Place of birth for the foreign-born population - Saudi Arabia (%)
Place of birth for the foreign-born population - Syria (%)
Place of birth for the foreign-born population - Turkey (%)
Place of birth for the foreign-born population - Yemen (%)
Place of birth for the foreign-born population - Other Western Asia (%)
Place of birth for the foreign-born population - Eritrea (%)
Place of birth for the foreign-born population - Ethiopia (%)
Place of birth for the foreign-born population - Kenya (%)
Place of birth for the foreign-born population - Somalia (%)
Place of birth for the foreign-born population - Uganda (%)
Place of birth for the foreign-born population - Zimbabwe (%)
Place of birth for the foreign-born population - Other Eastern Africa (%)
Place of birth for the foreign-born population - Cameroon (%)
Place of birth for the foreign-born population - Congo (%)
Place of birth for the foreign-born population - Democratic Republic of Congo (Zaire) (%)
Place of birth for the foreign-born population - Other Middle Africa (%)
Place of birth for the foreign-born population - Egypt (%)
Place of birth for the foreign-born population - Morocco (%)
Place of birth for the foreign-born population - Sudan (%)
Place of birth for the foreign-born population - Other Northern Africa (%)
Place of birth for the foreign-born population - South Africa (%)
Place of birth for the foreign-born population - Other Southern Africa (%)
Place of birth for the foreign-born population - Cabo Verde (%)
Place of birth for the foreign-born population - Ghana (%)
Place of birth for the foreign-born population - Liberia (%)
Place of birth for the foreign-born population - Nigeria (%)
Place of birth for the foreign-born population - Senegal (%)
Place of birth for the foreign-born population - Sierra Leone (%)
Place of birth for the foreign-born population - Other Western Africa (%)
Place of birth for the foreign-born population - Australia (%)
Place of birth for the foreign-born population - New Zealand (%)
Place of birth for the foreign-born population - Fiji (%)
Place of birth for the foreign-born population - Micronesia (%)
Place of birth for the foreign-born population - Bahamas (%)
Place of birth for the foreign-born population - Barbados (%)
Place of birth for the foreign-born population - Cuba (%)
Place of birth for the foreign-born population - Dominica (%)
Place of birth for the foreign-born population - Dominican Republic (%)
Place of birth for the foreign-born population - Grenada (%)
Place of birth for the foreign-born population - Haiti (%)
Place of birth for the foreign-born population - Jamaica (%)
Place of birth for the foreign-born population - St. Vincent and the Grenadines (%)
Place of birth for the foreign-born population - Trinidad and Tobago (%)
Place of birth for the foreign-born population - West Indies (%)
Place of birth for the foreign-born population - Other Caribbean (%)
Place of birth for the foreign-born population - Belize (%)
Place of birth for the foreign-born population - Costa Rica (%)
Place of birth for the foreign-born population - El Salvador (%)
Place of birth for the foreign-born population - Guatemala (%)
Place of birth for the foreign-born population - Honduras (%)
Place of birth for the foreign-born population - Mexico (%)
Place of birth for the foreign-born population - Nicaragua (%)
Place of birth for the foreign-born population - Panama (%)
Place of birth for the foreign-born population - Other Central America (%)
Place of birth for the foreign-born population - Argentina (%)
Place of birth for the foreign-born population - Bolivia (%)
Place of birth for the foreign-born population - Brazil (%)
Place of birth for the foreign-born population - Chile (%)
Place of birth for the foreign-born population - Colombia (%)
Place of birth for the foreign-born population - Ecuador (%)
Place of birth for the foreign-born population - Guyana (%)
Place of birth for the foreign-born population - Peru (%)
Place of birth for the foreign-born population - Uruguay (%)
Place of birth for the foreign-born population - Venezuela (%)
Place of birth for the foreign-born population - Other South America (%)
Place of birth for the foreign-born population - Canada (%)
Place of birth for the foreign-born population - Other Northern America (%)
Place of birth for the foreign-born population - Other (%)
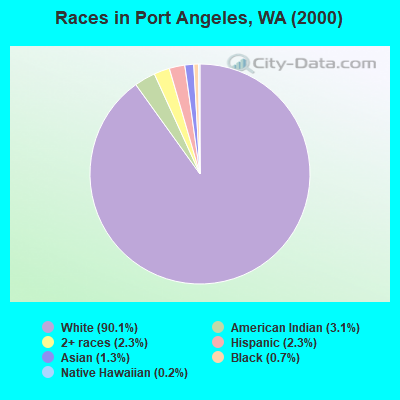
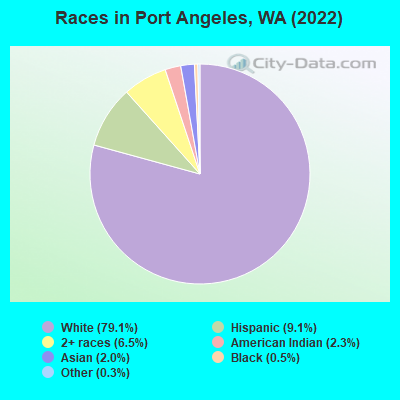
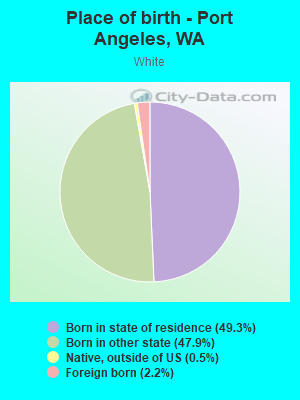
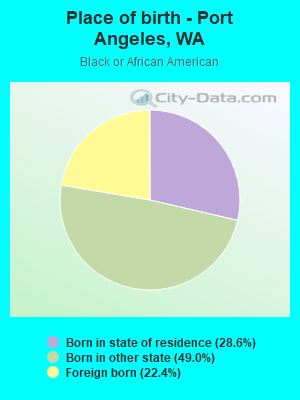
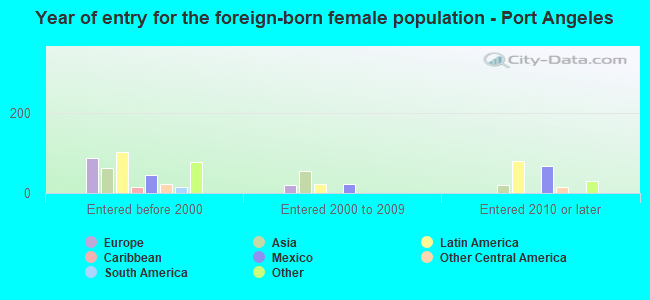
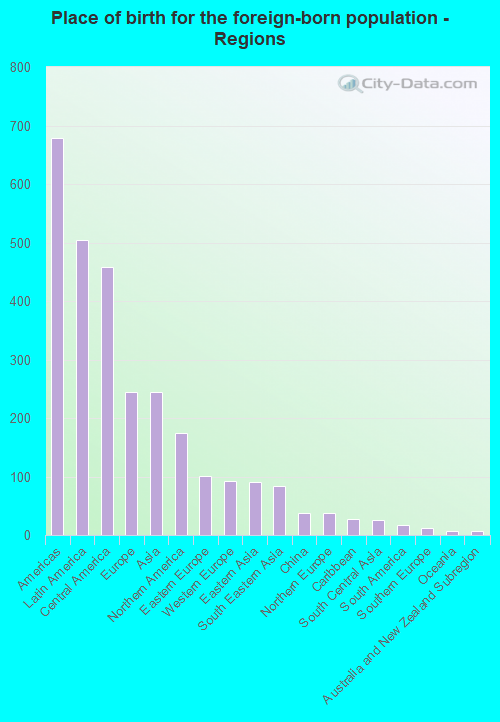
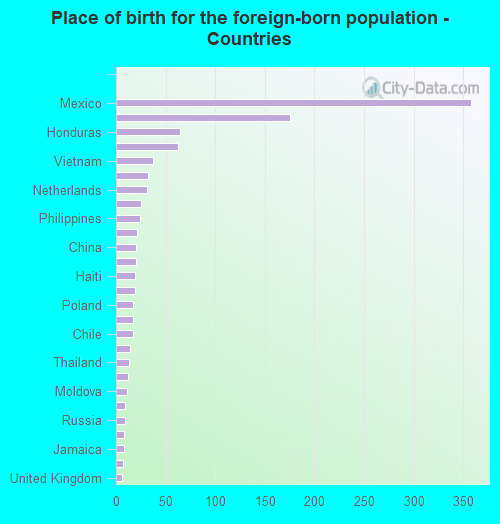
According to 2022 data, the most numerous races in Port Angeles, WA are White alone (15,913 residents), Hispanic (1,833 residents), and Asian alone (404 residents). 94.3% of Port Angeles residents speak English at home. 5.8% of Port Angeles, WA residents are foreign-born (2.4% born in Latin America, 1.2% born in Europe, 1.2% born in Asia, 0.8% born in North America), which is 156.7% less than the foreign-born rate of 15.0% across the entire state of Washington.
Race distribution in Port Angeles
2000 2022
4,652,490 78.9% White alone 441,509 7.5% Hispanic 319,401 5.4% Asian alone 184,631 3.1% Black alone 175,926 3.0% Two or more races 85,396 1.4% American Indian alone 22,779 0.4% Native Hawaiian and Other 11,989 0.2% Other race alone
4,941,456 63.5% White alone 1,093,313 14.0% Hispanic 755,832 9.7% Asian alone 523,448 6.7% Two or more races 299,537 3.8% Black alone 69,024 0.9% American Indian alone 52,231 0.7% Native Hawaiian and Other 50,945 0.7% Other race alone
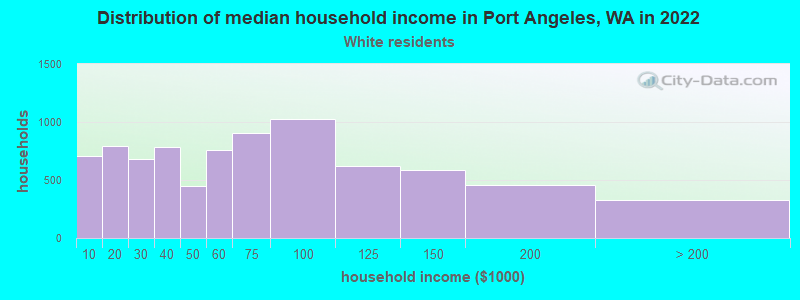
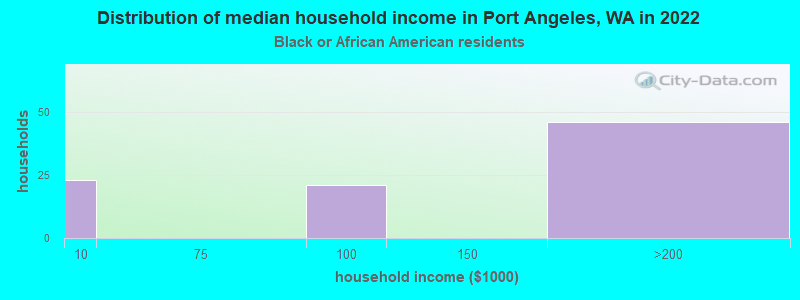
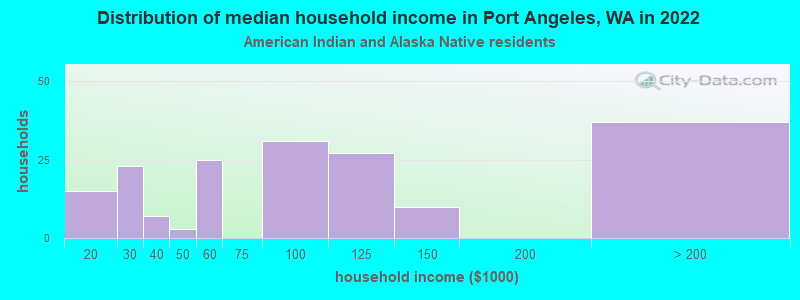
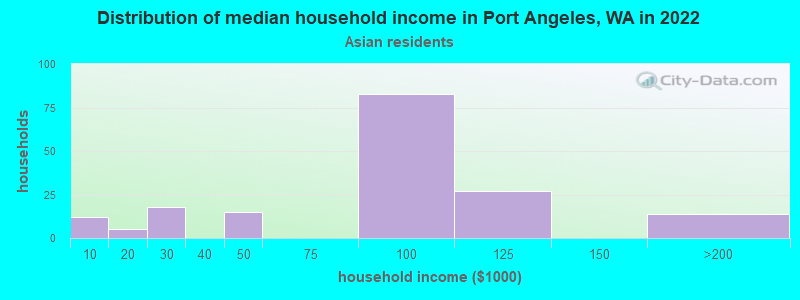
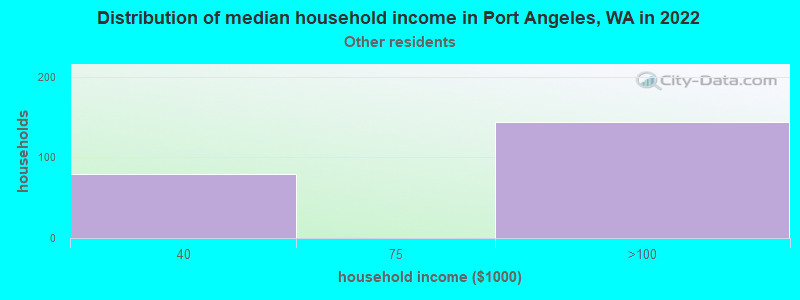
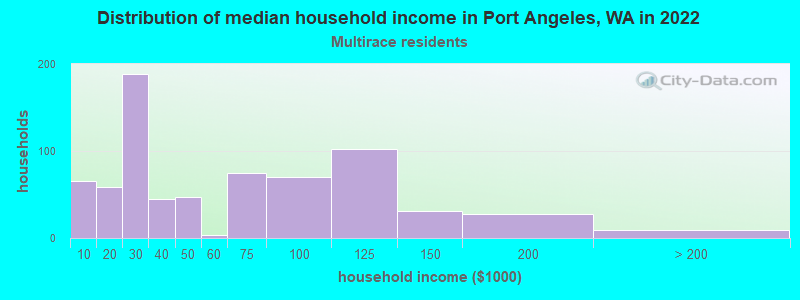
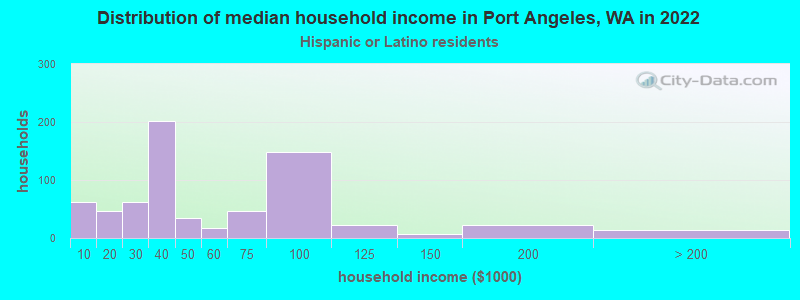
Income and house value in Port Angeles Median household income in 2022 $58,489 White non-Hispanic householders$155,116 Black householders$87,823 American Indian and Alaska Native householders$144,700 Asian householders$81,160 Some other race householders$35,783 Two or more races householders$49,361 Hispanic or Latino race householdersMedian 2022 house value $363,646 White Non-Hispanic householders$276,475 Black or African American householders$437,156 American Indian or Alaska Native householders $386,415 Asian householders$304,448 Two or more races householders$313,881 Hispanic or Latino householders
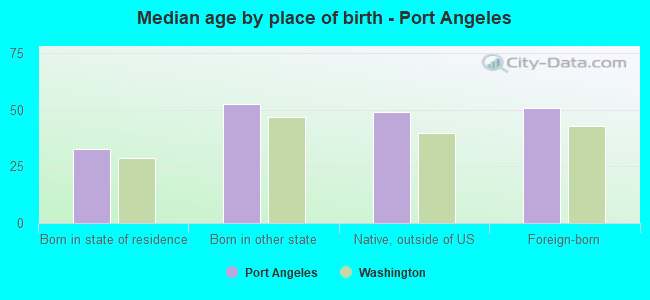
Median age by race in Port Angeles
45.7 Median age for White residents44.0 47.7 40.9 Median age for Black or African American residents40.5 30.4 36.3 Median age for American Indian / Alaska Native residents40.2 28.7 42.7 Median age for Asian residents34.0 40.3 -666,666,666.0 Median age for Native Hawaiian / Pacific Islander residents-666,666,666.0 -666,666,666.0 37.6 Median age for Other race residents35.5 40.1 28.9 Median age for Two or more races residents25.0 28.4 45.6 Median age for White alone residents43.7 48.2 30.2 Median age for Hispanic or Latino residents36.0 37.4
Owner/renter occupied households by race in Port Angeles
House owners and renters - White residents 4,790 58.8% Owner occupied3,360 41.2% Renter occupiedHouse owners and renters - Black or African American residents 61 75.0% Owner occupied20 25.0% Renter occupiedHouse owners and renters - American Indian / Alaska Native residents 74 48.9% Owner occupied77 51.1% Renter occupiedHouse owners and renters - Asian residents 64 37.7% Owner occupied106 62.3% Renter occupiedHouse owners and renters - Other race residents 88 36.0% Owner occupied157 64.0% Renter occupiedHouse owners and renters - Two or more races residents 302 52.2% Owner occupied277 47.8% Renter occupiedHouse owners and renters - White alone residents 4,643 59.1% Owner occupied3,211 40.9% Renter occupiedHouse owners and renters - Hispanic or Latino residents 313 45.9% Owner occupied368 54.1% Renter occupied
Language usage in Port Angeles
English speakers - Total 94.3% of residents of Port Angeles speak English at home.
4.0% of residents speak Spanish at home 340 44.2% Speak English very well429 55.8% Speak English less than very well1.8% of residents speak other language at home 267 78.5% Speak English very well73 21.5% Speak English less than very well
English speakers - Born in the United States 96.5% of residents of Port Angeles speak English at home.
2.5% of residents speak Spanish at home 203 89.4% Speak English very well24 10.6% Speak English less than very well1.0% of residents speak other language at home 65 70.7% Speak English very well27 29.3% Speak English less than very well
English speakers - Native, born elsewhere 50.0% of residents of Port Angeles speak English at home.
4.9% of residents speak Spanish at home 9 100.0% Speak English very well
English speakers - Foreign-born 40.4% of residents of Port Angeles speak English at home.
31.2% of residents speak Spanish at home 103 36.4% Speak English very well180 63.6% Speak English less than very well25.7% of residents speak other language at home 162 69.5% Speak English very well71 30.5% Speak English less than very well
White (Caucasian) - Speak only English Native:
99.0% (15,132)Foreign-born:
59.9% (221)
White (Caucasian) - Speak another language Native:
1.1% (162)Foreign-born:
36.2% (133)
Black or African American - Speak only English Native:
100.0% (100)Foreign-born:
100.0% (28)
Asian - Speak only English Native:
50.5% (60)Foreign-born:
46.1% (99)
Asian - Speak another language Native:
49.9% (59)Foreign-born:
55.7% (120)
Other race - Speak another language Native:
51.6% (210)Foreign-born:
100.0% (252)
Two or more races - Speak only English Native:
91.2% (1,786)Foreign-born:
9.4% (18)
Two or more races - Speak another language Native:
8.3% (162)Foreign-born:
51.2% (100)
White alone - Speak only English Native:
99.1% (14,875)Foreign-born:
73.3% (237)
White alone - Speak another language Native:
0.9% (140)Foreign-born:
27.0% (87)
Hispanic or Latino - Speak only English Native:
68.9% (958)Foreign-born:
3.4% (9)
Hispanic or Latino - Speak another language Native:
30.5% (424)Foreign-born:
96.5% (270)
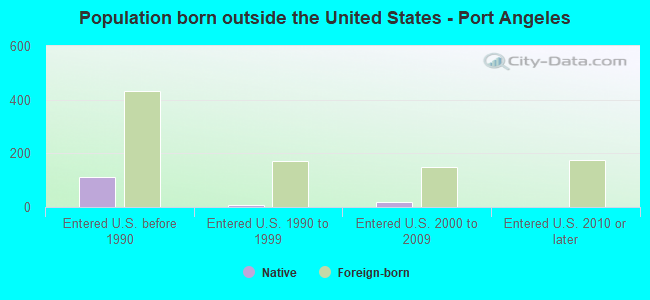
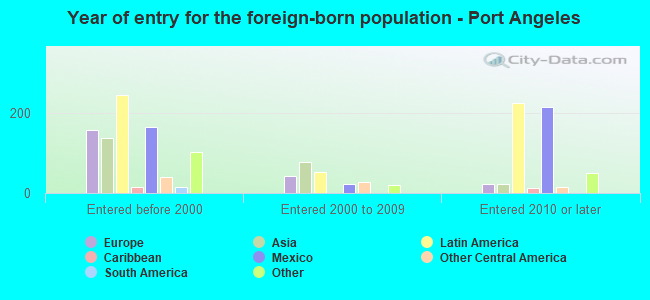
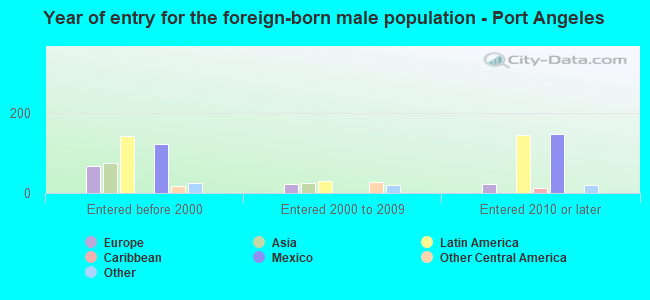
Foreign-born residents in Port Angeles 1,176 residents are foreign born (2.4% Latin America , 1.2% Europe , 1.2% Asia , 0.8% North America ).
This city:
5.8%Washington:
14.9%
Marital status for residents in Port Angeles Marital status - White (Caucasian) population 15 years and over
Males 31.4% Never married45.2% Now married1.4% Separated3.4% Widowed18.6% DivorcedFemales 25.6% Never married45.4% Now married1.3% Separated8.8% Widowed18.9% DivorcedWomen who gave birth in the past 12 months Now married:
66.2% (138)Unmarried:
33.8% (70)
Women who did not give birth in the past 12 months Now married:
40.2% (1,219)Unmarried:
59.8% (1,811)
Marital status - Black or African American population 15 years and over
Males 31.4% Never married68.6% Now married0.0% Separated0.0% Widowed0.0% DivorcedFemales 100.0% Never married0.0% Now married0.0% Separated0.0% Widowed0.0% DivorcedWomen who did not give birth in the past 12 months Now married:
0.0% (0)Unmarried:
100.0% (21)
Marital status - American Indian / Alaska Native population 15 years and over
Males 68.3% Never married19.0% Now married10.9% Separated0.0% Widowed1.8% DivorcedFemales 36.1% Never married10.9% Now married0.0% Separated0.0% Widowed53.0% DivorcedWomen who gave birth in the past 12 months Now married:
0.0% (0)Unmarried:
100.0% (56)
Women who did not give birth in the past 12 months Now married:
0.0% (0)Unmarried:
100.0% (82)
Marital status - Asian population 15 years and over
Males 60.6% Never married26.6% Now married6.4% Separated0.0% Widowed6.4% DivorcedFemales 60.6% Never married22.7% Now married0.0% Separated10.3% Widowed6.4% DivorcedWomen who did not give birth in the past 12 months Now married:
19.6% (35)Unmarried:
80.4% (143)
Marital status - Other race population 15 years and over
Males 44.6% Never married28.5% Now married0.0% Separated0.8% Widowed26.0% DivorcedFemales 28.0% Never married65.9% Now married0.0% Separated6.1% Widowed0.0% DivorcedWomen who did not give birth in the past 12 months Now married:
61.3% (86)Unmarried:
38.7% (54)
Marital status - Two or more races population 15 years and over
Males 43.8% Never married37.0% Now married0.0% Separated0.0% Widowed19.2% DivorcedFemales 52.3% Never married32.5% Now married0.0% Separated3.2% Widowed12.0% DivorcedWomen who did not give birth in the past 12 months Now married:
30.1% (163)Unmarried:
69.9% (379)
Marital status - White alone, not Hispanic / Latino population 15 years and over
Males 30.8% Never married45.7% Now married1.5% Separated3.5% Widowed18.5% DivorcedFemales 25.3% Never married45.4% Now married1.2% Separated8.8% Widowed19.3% DivorcedWomen who gave birth in the past 12 months Now married:
66.2% (139)Unmarried:
33.8% (71)
Women who did not give birth in the past 12 months Now married:
40.2% (1,178)Unmarried:
59.8% (1,756)
Marital status - Hispanic or Latino population 15 years and over
Males 49.1% Never married28.5% Now married0.0% Separated0.4% Widowed22.0% DivorcedFemales 47.3% Never married39.2% Now married1.7% Separated7.6% Widowed4.3% DivorcedWomen who did not give birth in the past 12 months Now married:
30.5% (141)Unmarried:
69.5% (321)
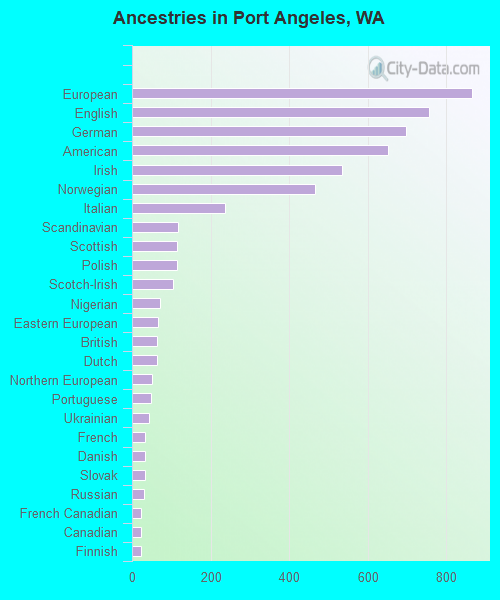
Ancestries in Port Angeles
865 11.0% European756 9.6% English698 8.9% German652 8.3% American534 6.8% Irish465 5.9% Norwegian236 3.0% Italian117 1.5% Scandinavian115 1.5% Scottish115 1.5% Polish104 1.3% Scotch-Irish70 0.9% Nigerian67 0.9% Eastern European64 0.8% British63 0.8% Dutch50 0.6% Northern European49 0.6% Portuguese42 0.5% Ukrainian34 0.4% French34 0.4% Danish34 0.4% Slovak30 0.4% Russian24 0.3% French Canadian23 0.3% Canadian23 0.3% Finnish20 0.3% Croatian19 0.2% Welsh17 0.2% Swedish14 0.2% Swiss12 0.2% Haitian12 0.2% Jamaican9 0.1% Czech8 0.1% Maltese3 0.04% Pennsylvania German
Geographical mobility in Port Angeles Same house 1 year ago 14,088 87.1% White (Caucasian)83 65.0% Black or African American449 93.6% American Indian / Alaska Native264 79.4% Asian587 80.9% Other race1,653 78.7% Two or more races13,703 87.0% White alone, not Hispanic / Latino1,642 90.0% Hispanic or LatinoMoved within same county 1,207 7.5% White / Caucasian20 15.5% Black or African American29 6.1% American Indian / Alaska Native5 1.4% Asian5 0.7% Other race109 5.2% Two or more races1,199 7.6% White alone, not Hispanic / Latino26 1.4% Hispanic or LatinoMoved within same state 398 2.5% White / Caucasian22 17.0% Black or African American4 0.8% American Indian / Alaska Native7 2.0% Asian123 5.9% Two or more races380 2.4% White alone, not Hispanic / LatinoMoved from different state 367 2.3% White / Caucasian51 15.3% Asian163 22.5% Other race169 8.0% Two or more races354 2.2% White alone, not Hispanic / Latino225 12.3% Hispanic or LatinoMoved from abroad 150 0.9% White7 2.2% Asian38 1.8% Two or more races130 0.8% White alone, not Hispanic / Latino
Children Nativity (place of birth) in Port Angeles
Children under 6 years - Living with two parents Both parents native 551 100.0% NativeBoth parents foreign-born 9 15.8% Native47 84.2% Foreign-bornOne native, one foreign-born parent 93 100.0% NativeChildren under 6 years - Living with one parent Native parent 336 100.0% NativeForeign-born parent 7 100.0% NativeChildren 6 to 17 years - Living with two parents Both parents native 1,203 100.0% NativeBoth parents foreign-born 47 60.0% Native31 40.0% Foreign-bornOne native, one foreign-born parent 15 52.1% Native14 47.9% Foreign-bornChildren 6 to 17 years - Living with one parent Native parent 1,067 100.0% NativeForeign-born parent 63 50.6% Native61 49.4% Foreign-born
Grandparents responsible for own grandchildren in Port Angeles
Grandparents (30 to 59 years) White / Caucasian 11 100.0% Responsible for grandchildrenAmerican Indian / Alaska Native 10 100.0% Responsible for grandchildrenWhite alone, not Hispanic / Latino 11 100.0% Responsible for grandchildrenGrandparents (60 years and over) White / Caucasian 32 46.0% Responsible for grandchildren37 54.0% Not responsible for grandchildrenWhite alone, not Hispanic / Latino 32 45.6% Responsible for grandchildren39 54.4% Not responsible for grandchildren