Races in Portola Hills, California (CA) Detailed Stats
Ancestries, Foreign-born residents, place of birth

Recent posts about races in Portola Hills, California on our local forum with over 2,400,000 registered users:
 | Irvine: One of the most underrated cities in California and the West Coast (69 replies) |
| Questions about Ladera and Coto de Caza - Please Help! (21 replies) |
| 1st time homebuyer - Not looking so good right now (139 replies) |
| When to buy a home (40 replies) |
| Half-asian/hapa populations (25 replies) |
| Moving to Santa Ana for 1 year. Need to rent a house in a nice area (16 replies) |
13.0% of Portola Hills, CA residents are foreign-born (5.8% born in Asia, 2.8% born in Europe, 2.5% born in Latin America), which is 100.7% less than the foreign-born rate of 26.0% across the entire state of California.
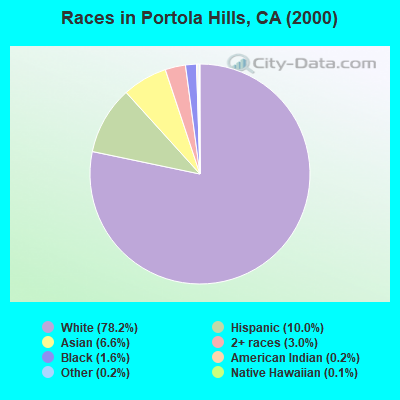
Race distribution in Portola Hills

- 4,99878.2%White alone
- 64110.0%Hispanic
- 4256.6%Asian alone
- 1913.0%Two or more races
- 1011.6%Black alone
- 130.2%Other race alone
- 140.2%American Indian alone
- 80.1%Native Hawaiian and Other
Pacific Islander alone
2000
2022
-
- 15,816,79046.7%White alone
- 10,966,55632.4%Hispanic
- 3,648,86010.8%Asian alone
- 2,181,9266.4%Black alone
- 903,1152.7%Two or more races
- 178,9840.5%American Indian alone
- 103,7360.3%Native Hawaiian and Other
Pacific Islander alone - 71,6810.2%Other race alone

-
- 15,732,18440.3%Hispanic
- 13,160,42633.7%White alone
- 5,957,86715.3%Asian alone
- 2,025,2185.2%Black alone
- 1,663,2224.3%Two or more races
- 251,6180.6%Other race alone
- 135,7770.3%Native Hawaiian and Other
Pacific Islander alone - 103,0300.3%American Indian alone

Income and house value in Portola Hills
- Median household income in 2022
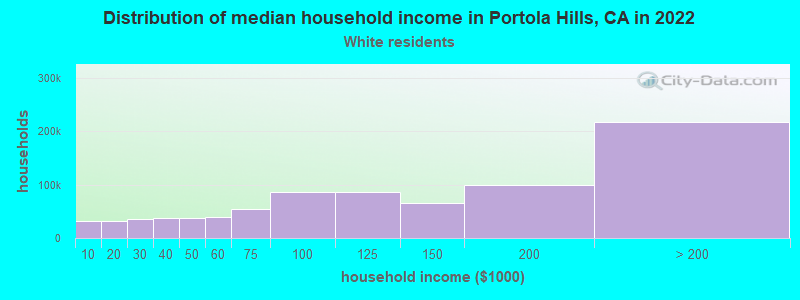
- $181,606White non-Hispanic householders
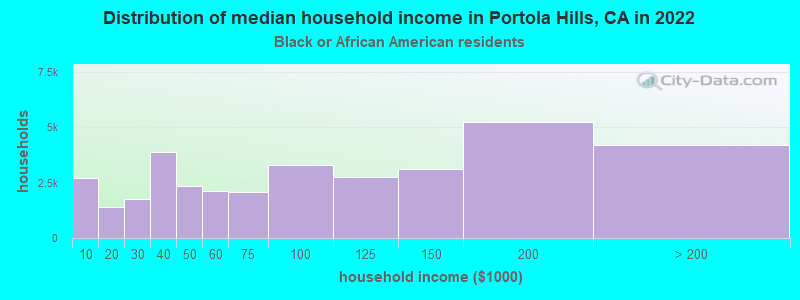
- $167,209Black householders
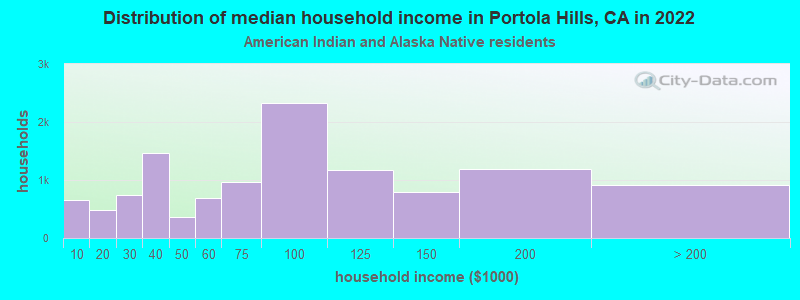
- $136,334American Indian and Alaska Native householders
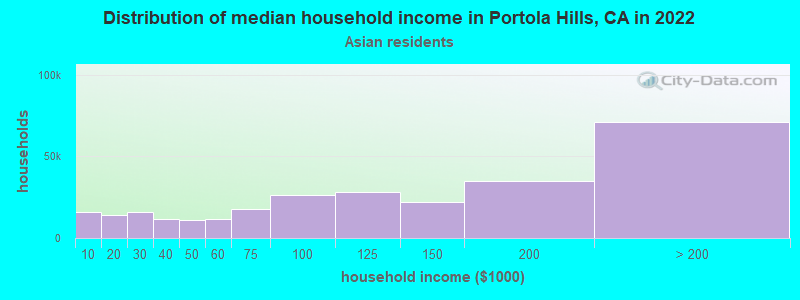
- $149,232Asian householders
- $153,072Some other race householders
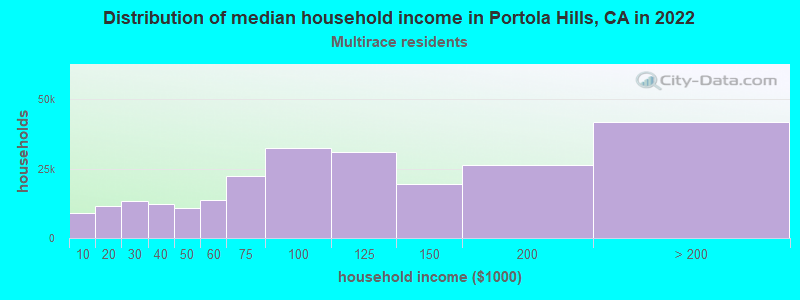
- $167,682Two or more races householders
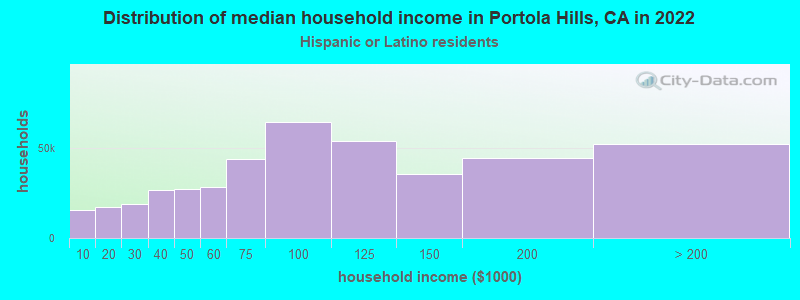
- $143,430Hispanic or Latino race householders
- Median 2022 house value
- $992,685White Non-Hispanic householders
- $612,960Black or African American householders
- $674,868American Indian or Alaska Native householders
- $993,765Asian householders
- $740,015Some other race householders
- over $1,000,000Two or more races householders
- $791,485Hispanic or Latino householders
Household income for White non-Hispanic householders
Household income for Black householders
Household income for American Indian and Alaska Native householders
Household income for Asian householders
Household income for Two or more races householders
Household income for Hispanic or Latino race householders
Foreign-born residents in Portola Hills
828 residents are foreign born (5.8% Asia, 2.8% Europe, 2.5% Latin America).
| This city: | 13.0% |
| California: | 26.2% |
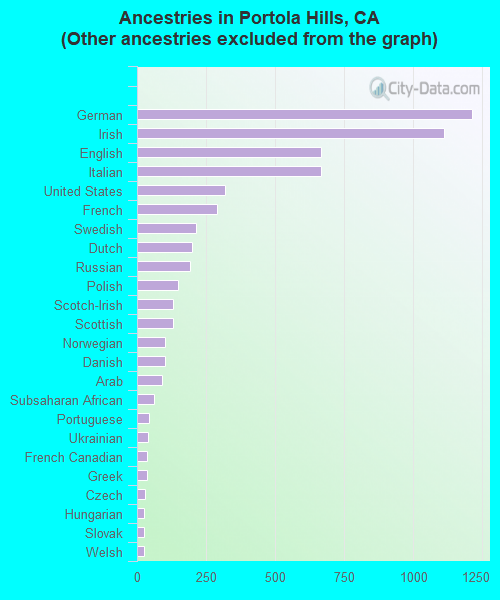
Ancestries in Portola Hills

- 1,93424.7%Other
- 1,21315.5%German
- 1,11014.2%Irish
- 6678.5%English
- 6668.5%Italian
- 3184.1%United States
- 2893.7%French
- 2142.7%Swedish
- 2002.6%Dutch
- 1922.5%Russian
- 1491.9%Polish
- 1301.7%Scotch-Irish
- 1301.7%Scottish
- 1031.3%Norwegian
- 1011.3%Danish
- 891.1%Arab
- 600.8%Subsaharan African
- 440.6%Portuguese
- 380.5%Ukrainian
- 360.5%French Canadian
- 360.5%Greek
- 300.4%Czech
- 270.3%Hungarian
- 250.3%Slovak
- 240.3%Welsh
- 110.1%Lithuanian
Zip codes: 92679.