Races in Reading, Vermont (VT) Detailed Stats
Ancestries, Foreign-born residents, place of birth
1.8% of Reading, VT residents are foreign-born , which is 117.5% less than the foreign-born rate of 4.0% across the entire state of Vermont.
Race distribution in Reading

- 69297.9%White alone
- 71.0%Two or more races
- 71.0%Hispanic
- 10.1%Asian alone
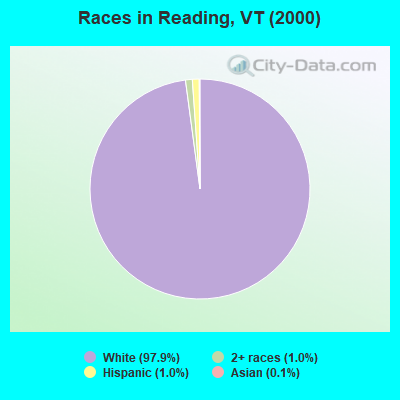
2000
2022
-
- 585,43196.2%White alone
- 6,8091.1%Two or more races
- 5,5040.9%Hispanic
- 5,1600.8%Asian alone
- 2,9210.5%Black alone
- 2,3250.4%American Indian alone
- 5570.09%Other race alone
- 1200.02%Native Hawaiian and Other
Pacific Islander alone

-
- 583,54690.2%White alone
- 27,3404.2%Two or more races
- 14,7702.3%Hispanic
- 11,5121.8%Asian alone
- 6,2641.0%Black alone
- 2,5210.4%Other race alone
- 1,0520.2%American Indian alone
- 590.01%Native Hawaiian and Other
Pacific Islander alone

Income and house value in Reading
- Median household income in 2022
- $80,293White non-Hispanic householders
- $39,550Two or more races householders
- $45,354Hispanic or Latino race householders
- Median 2022 house value
- $291,268White Non-Hispanic householders
- $342,594Hispanic or Latino householders
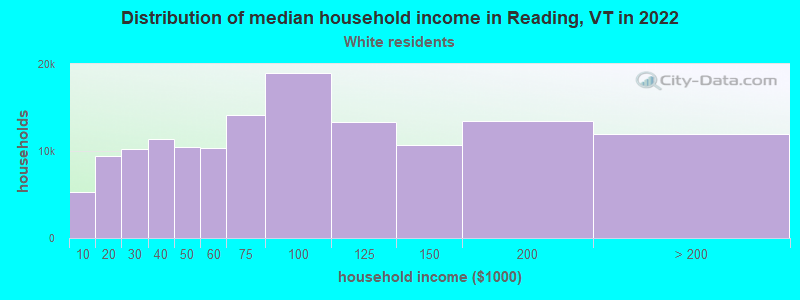
Household income for White non-Hispanic householders
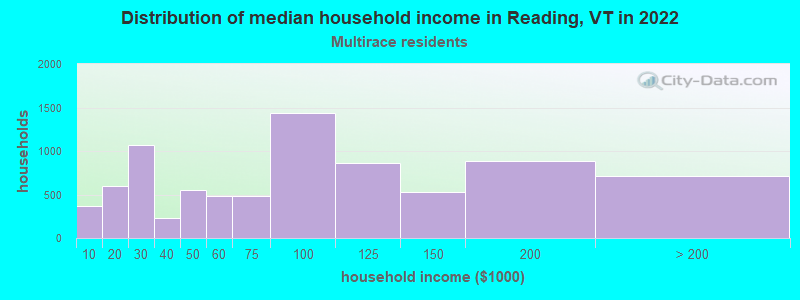
Household income for Two or more races householders
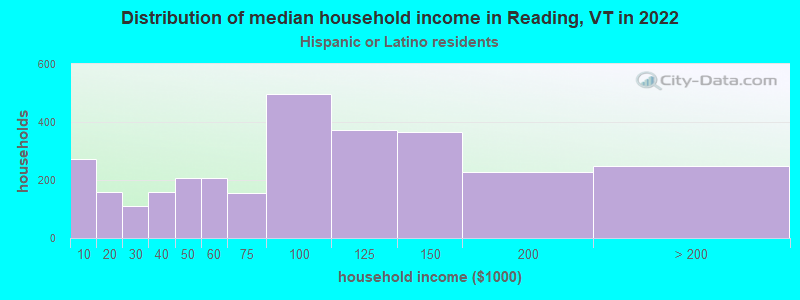
Household income for Hispanic or Latino race householders
Foreign-born residents in Reading
13 residents are foreign born
| This city: | 1.8% |
| Vermont: | 3.8% |
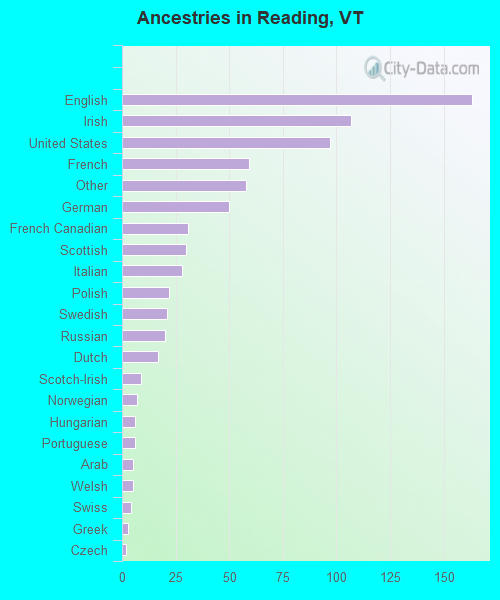
Ancestries in Reading

- 16321.7%English
- 10714.3%Irish
- 9712.9%United States
- 597.9%French
- 587.7%Other
- 506.7%German
- 314.1%French Canadian
- 304.0%Scottish
- 283.7%Italian
- 222.9%Polish
- 212.8%Swedish
- 202.7%Russian
- 172.3%Dutch
- 91.2%Scotch-Irish
- 70.9%Norwegian
- 60.8%Hungarian
- 60.8%Portuguese
- 50.7%Arab
- 50.7%Welsh
- 40.5%Swiss
- 30.4%Greek
- 20.3%Czech
Zip codes: 05062.