Races in Ripton, Vermont (VT) Detailed Stats
Ancestries, Foreign-born residents, place of birth

Recent posts about races in Ripton, Vermont on our local forum with over 2,400,000 registered users:
 | Stowe vacation ideas (14 replies) |
| Thoughts on Middlebury? (25 replies) |
| Looking for a fab Vt. town for summer home! (18 replies) |
Latest news about races in Ripton, VT collected exclusively by city-data.com from local newspapers, TV, and radio stations
2.0% of Ripton, VT residents are foreign-born , which is 102.2% less than the foreign-born rate of 4.0% across the entire state of Vermont.
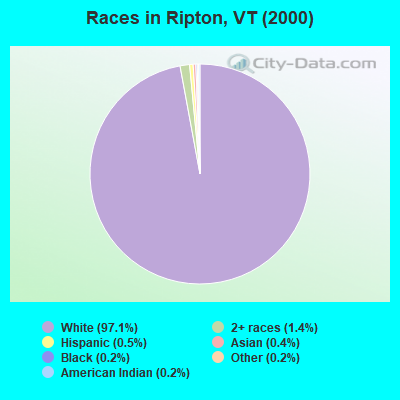
Race distribution in Ripton

- 54097.1%White alone
- 81.4%Two or more races
- 30.5%Hispanic
- 20.4%Asian alone
- 10.2%Black alone
- 10.2%Other race alone
- 10.2%American Indian alone
2000
2022
-
- 585,43196.2%White alone
- 6,8091.1%Two or more races
- 5,5040.9%Hispanic
- 5,1600.8%Asian alone
- 2,9210.5%Black alone
- 2,3250.4%American Indian alone
- 5570.09%Other race alone
- 1200.02%Native Hawaiian and Other
Pacific Islander alone

-
- 583,54690.2%White alone
- 27,3404.2%Two or more races
- 14,7702.3%Hispanic
- 11,5121.8%Asian alone
- 6,2641.0%Black alone
- 2,5210.4%Other race alone
- 1,0520.2%American Indian alone
- 590.01%Native Hawaiian and Other
Pacific Islander alone

Income and house value in Ripton
- Median household income in 2022
- $72,991White non-Hispanic householders
- $48,290American Indian and Alaska Native householders
- $47,510Some other race householders
- $30,760Two or more races householders
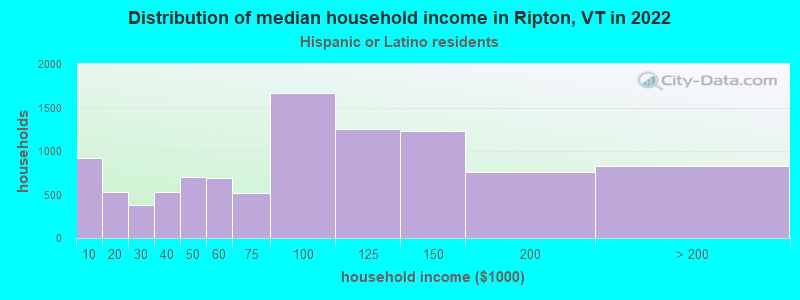
- $152,070Hispanic or Latino race householders
- Median 2022 house value
- $332,822White Non-Hispanic householders
- $164,763American Indian or Alaska Native householders
- $112,338Two or more races householders
- $411,909Hispanic or Latino householders
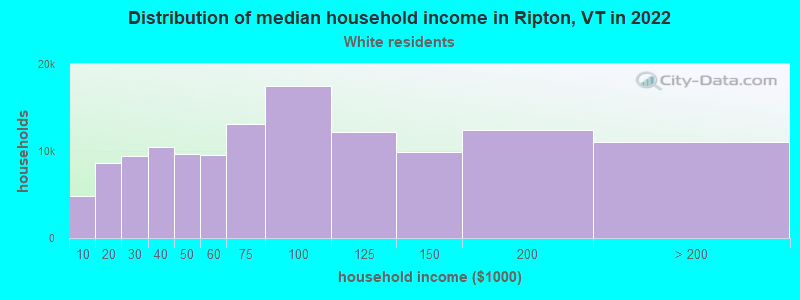
Household income for White non-Hispanic householders
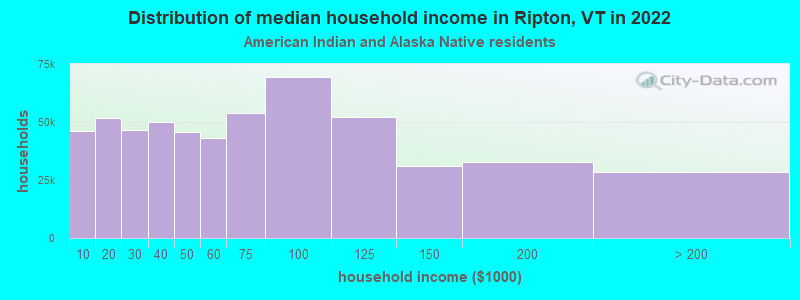
Household income for American Indian and Alaska Native householders
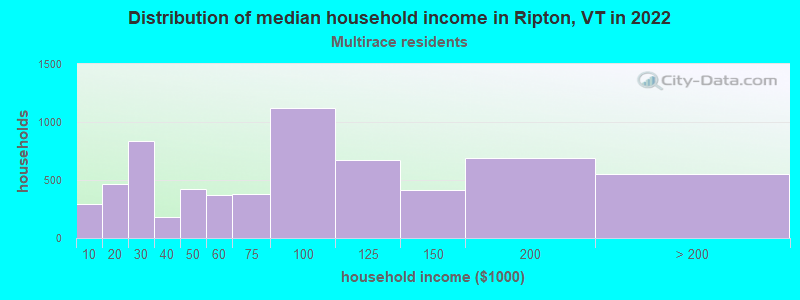
Household income for Two or more races householders
Household income for Hispanic or Latino race householders
Foreign-born residents in Ripton
11 residents are foreign born
| This city: | 2.0% |
| Vermont: | 3.8% |
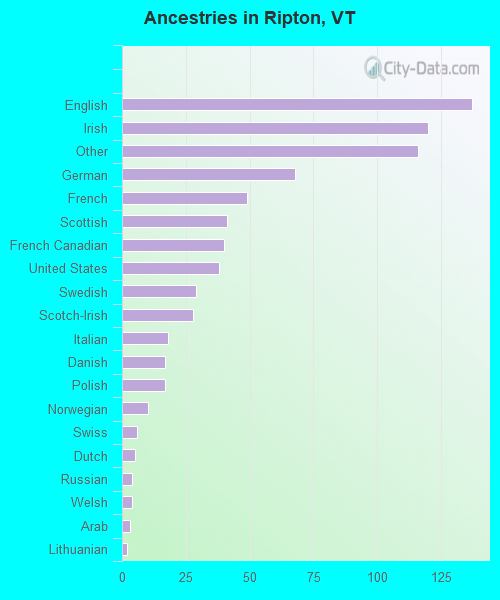
Ancestries in Ripton

- 13718.2%English
- 12016.0%Irish
- 11615.4%Other
- 689.0%German
- 496.5%French
- 415.5%Scottish
- 405.3%French Canadian
- 385.1%United States
- 293.9%Swedish
- 283.7%Scotch-Irish
- 182.4%Italian
- 172.3%Danish
- 172.3%Polish
- 101.3%Norwegian
- 60.8%Swiss
- 50.7%Dutch
- 40.5%Russian
- 40.5%Welsh
- 30.4%Arab
- 20.3%Lithuanian
Zip codes: 05766.