Races in Riverside, Connecticut (CT) Detailed Stats
Data:
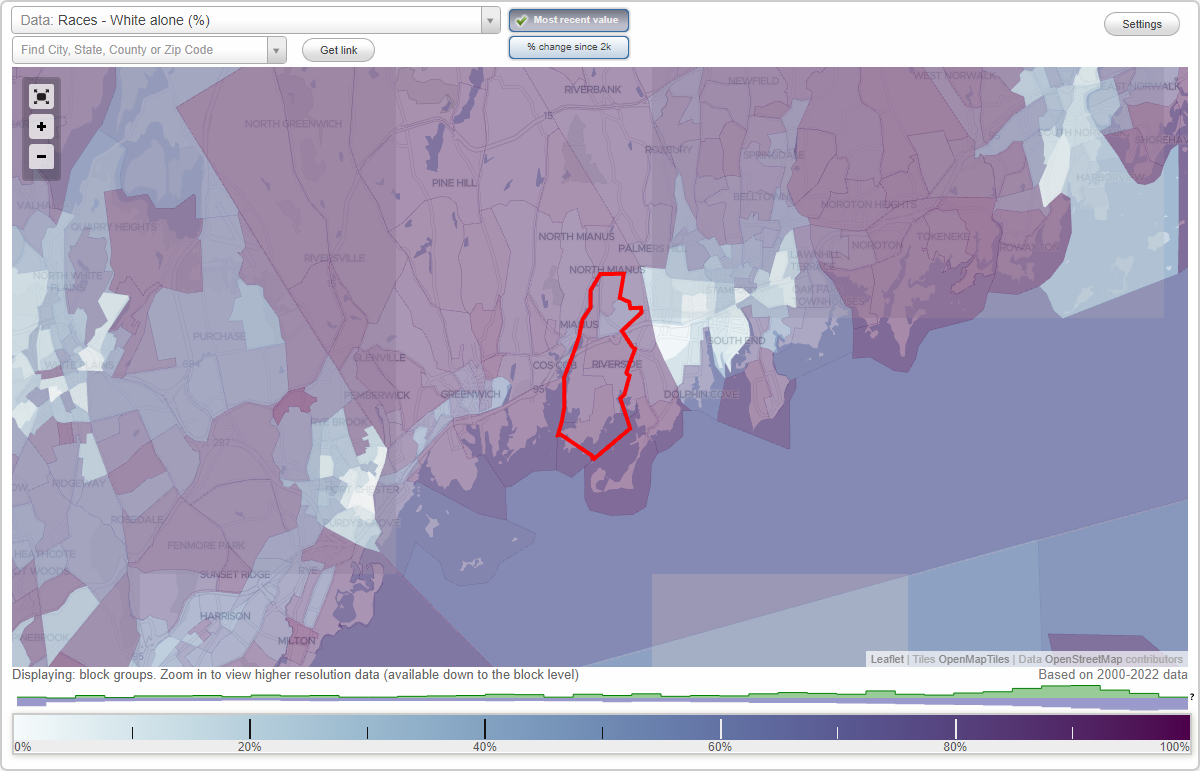
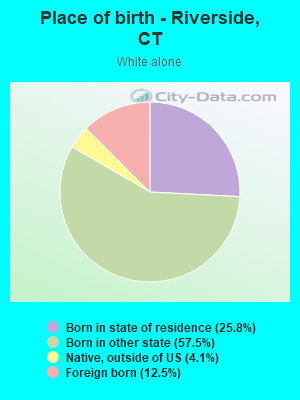
Races - White alone (%)
Races - White alone (% change since 2000)
Races - Black alone (%)
Races - Black alone (% change since 2000)
Races - American Indian alone (%)
Races - American Indian alone (% change since 2000)
Races - Asian alone (%)
Races - Asian alone (% change since 2000)
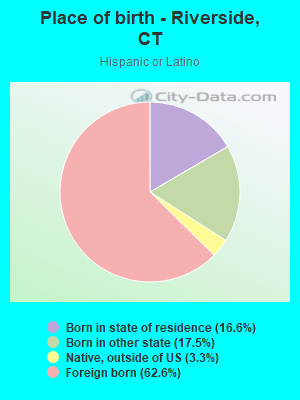
Races - Hispanic (%)
Races - Hispanic (% change since 2000)
Races - Native Hawaiian and Other Pacific Islander alone (%)
Races - Native Hawaiian and Other Pacific Islander alone (% change since 2000)
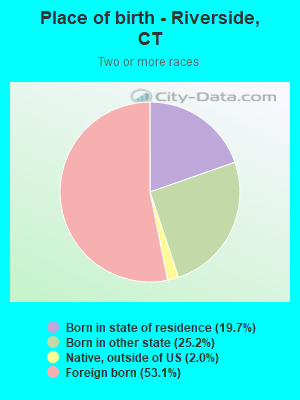
Races - Two or more races(%)
Races - Two or more races(% change since 2000)
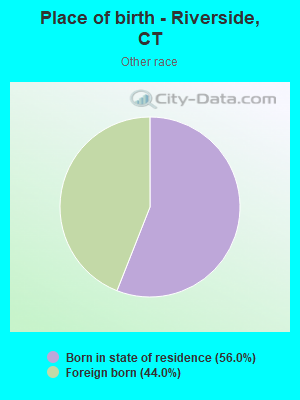
Races - Other race alone (%)
Races - Other race alone (% change since 2000)
Racial diversity
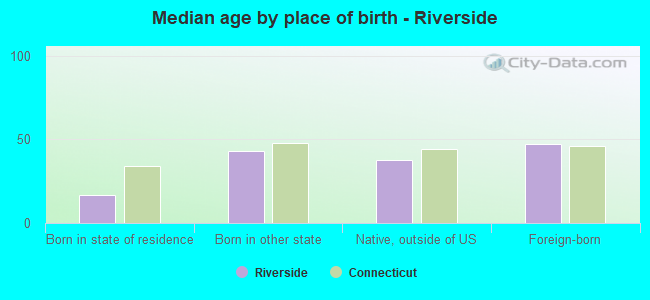
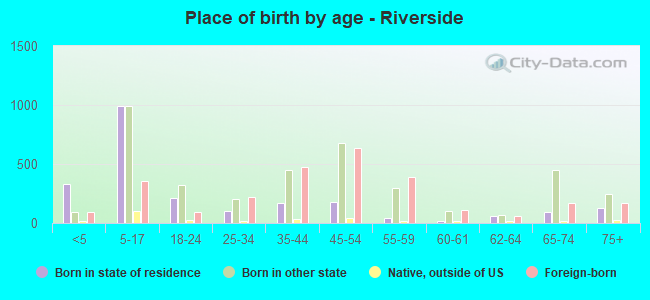
Place of birth - Born in state of residence (%)
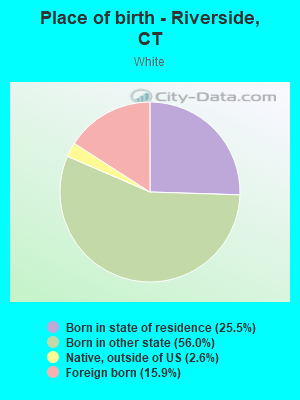
Place of birth - Born in state of residence (%) - White
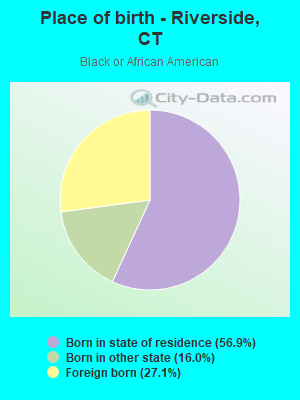
Place of birth - Born in state of residence (%) - Black or African American
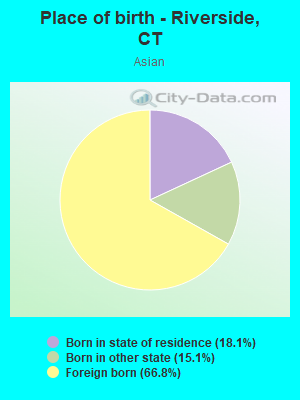
Place of birth - Born in state of residence (%) - Asian
Place of birth - Born in state of residence (%) - Hispanic or Latino
Place of birth - Born in state of residence (%) - American Indian and Alaska Native
Place of birth - Born in state of residence (%) - Multirace
Place of birth - Born in state of residence (%) - Other Race
Place of birth - Born in other state (%)
Place of birth - Born in other state (%) - White
Place of birth - Born in other state (%) - Black or African American
Place of birth - Born in other state (%) - Asian
Place of birth - Born in other state (%) - Hispanic or Latino
Place of birth - Born in other state (%) - American Indian and Alaska Native
Place of birth - Born in other state (%) - Multirace
Place of birth - Born in other state (%) - Other Race
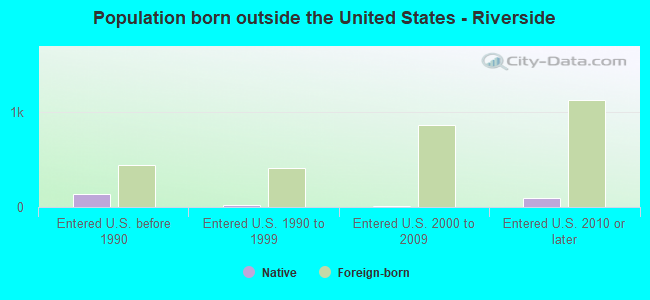
Place of birth - Native, outside of US (%)
Place of birth - Native, outside of US (%) - White
Place of birth - Native, outside of US (%) - Black or African American
Place of birth - Native, outside of US (%) - Asian
Place of birth - Native, outside of US (%) - Hispanic or Latino
Place of birth - Native, outside of US (%) - American Indian and Alaska Native
Place of birth - Native, outside of US (%) - Multirace
Place of birth - Native, outside of US (%) - Other Race
Place of birth - Foreign born (%)
Place of birth - Foreign born (%) - White
Place of birth - Foreign born (%) - Black or African American
Place of birth - Foreign born (%) - Asian
Place of birth - Foreign born (%) - Hispanic or Latino
Place of birth - Foreign born (%) - American Indian and Alaska Native
Place of birth - Foreign born (%) - Multirace
Place of birth - Foreign born (%) - Other Race
Residents speaking English at home (%)
Residents speaking English at home - Born in the United States (%)
Residents speaking English at home - Native, born elsewhere (%)
Residents speaking English at home - Foreign born (%)
Residents speaking Spanish at home (%)
Residents speaking Spanish at home - Born in the United States (%)
Residents speaking Spanish at home - Native, born elsewhere (%)
Residents speaking Spanish at home - Foreign born (%)
Residents speaking other language at home (%)
Residents speaking other language at home - Born in the United States (%)
Residents speaking other language at home - Native, born elsewhere (%)
Residents speaking other language at home - Foreign born (%)
Marital status - Never married (%)
Marital status - Now married (%)
Marital status - Separated (%)
Marital status - Widowed (%)
Marital status - Divorced (%)
Ancestries Reported - Arab (%)
Ancestries Reported - Czech (%)
Ancestries Reported - Danish (%)
Ancestries Reported - Dutch (%)
Ancestries Reported - English (%)
Ancestries Reported - French (%)
Ancestries Reported - French Canadian (%)
Ancestries Reported - German (%)
Ancestries Reported - Greek (%)
Ancestries Reported - Hungarian (%)
Ancestries Reported - Irish (%)
Ancestries Reported - Italian (%)
Ancestries Reported - Lithuanian (%)
Ancestries Reported - Norwegian (%)
Ancestries Reported - Polish (%)
Ancestries Reported - Portuguese (%)
Ancestries Reported - Russian (%)
Ancestries Reported - Scotch-Irish (%)
Ancestries Reported - Scottish (%)
Ancestries Reported - Slovak (%)
Ancestries Reported - Subsaharan African (%)
Ancestries Reported - Swedish (%)
Ancestries Reported - Swiss (%)
Ancestries Reported - Ukrainian (%)
Ancestries Reported - United States (%)
Ancestries Reported - Welsh (%)
Ancestries Reported - West Indian (%)
Ancestries Reported - Other (%)
Geographical mobility - Same house 1 year ago (%)
Geographical mobility - Same house 1 year ago (%) - White
Geographical mobility - Same house 1 year ago (%) - Black or African American
Geographical mobility - Same house 1 year ago (%) - Asian
Geographical mobility - Same house 1 year ago (%) - Hispanic or Latino
Geographical mobility - Same house 1 year ago (%) - American Indian and Alaska Native
Geographical mobility - Same house 1 year ago (%) - Multirace
Geographical mobility - Same house 1 year ago (%) - Other Race
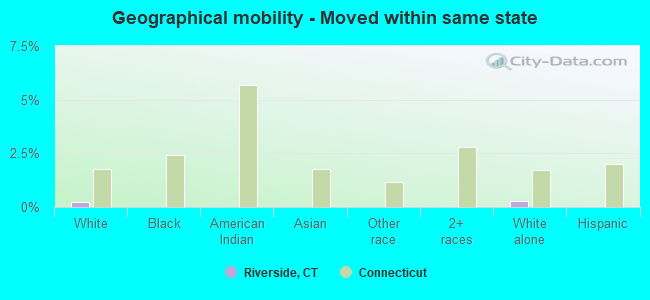
Geographical mobility - Moved within same county (%)
Geographical mobility - Moved within same county (%) - White
Geographical mobility - Moved within same county (%) - Black or African American
Geographical mobility - Moved within same county (%) - Asian
Geographical mobility - Moved within same county (%) - Hispanic or Latino
Geographical mobility - Moved within same county (%) - American Indian and Alaska Native
Geographical mobility - Moved within same county (%) - Multirace
Geographical mobility - Moved within same county (%) - Other Race
Geographical mobility - Moved from different county within same state (%)
Geographical mobility - Moved from different county within same state (%) - White
Geographical mobility - Moved from different county within same state (%) - Black or African American
Geographical mobility - Moved from different county within same state (%) - Asian
Geographical mobility - Moved from different county within same state (%) - Hispanic or Latino
Geographical mobility - Moved from different county within same state (%) - American Indian and Alaska Native
Geographical mobility - Moved from different county within same state (%) - Multirace
Geographical mobility - Moved from different county within same state (%) - Other Race
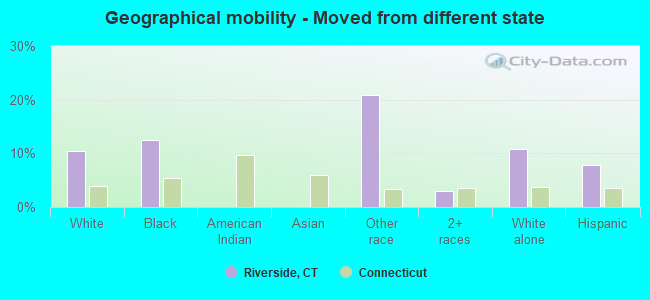
Geographical mobility - Moved from different state (%)
Geographical mobility - Moved from different state (%) - White
Geographical mobility - Moved from different state (%) - Black or African American
Geographical mobility - Moved from different state (%) - Asian
Geographical mobility - Moved from different state (%) - Hispanic or Latino
Geographical mobility - Moved from different state (%) - American Indian and Alaska Native
Geographical mobility - Moved from different state (%) - Multirace
Geographical mobility - Moved from different state (%) - Other Race
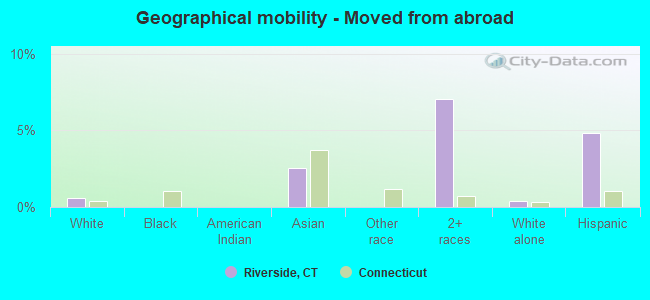
Geographical mobility - Moved from abroad (%)
Geographical mobility - Moved from abroad (%) - White
Geographical mobility - Moved from abroad (%) - Black or African American
Geographical mobility - Moved from abroad (%) - Asian
Geographical mobility - Moved from abroad (%) - Hispanic or Latino
Geographical mobility - Moved from abroad (%) - American Indian and Alaska Native
Geographical mobility - Moved from abroad (%) - Multirace
Geographical mobility - Moved from abroad (%) - Other Race
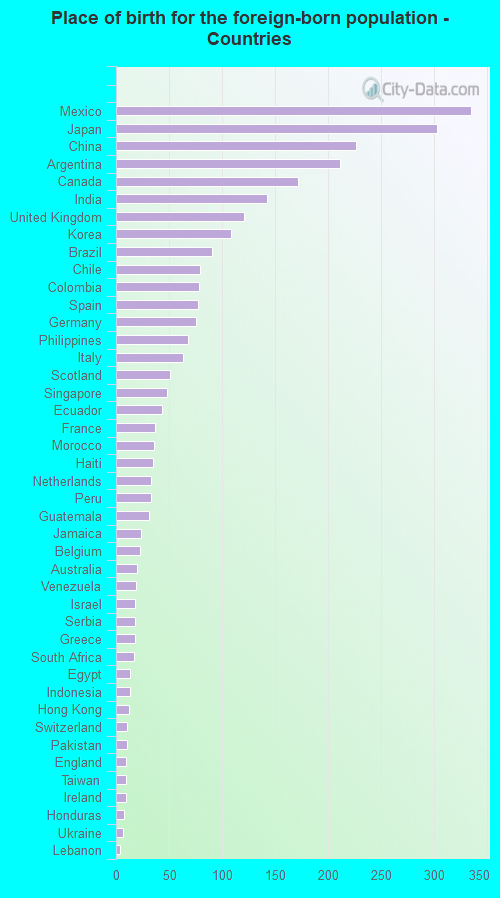
Place of birth for the foreign-born population - Ireland (%)
Place of birth for the foreign-born population - Denmark (%)
Place of birth for the foreign-born population - Norway (%)
Place of birth for the foreign-born population - Sweden (%)
Place of birth for the foreign-born population - United Kingdom (%)
Place of birth for the foreign-born population - England (%)
Place of birth for the foreign-born population - Scotland (%)
Place of birth for the foreign-born population - Other Northern Europe (%)
Place of birth for the foreign-born population - Austria (%)
Place of birth for the foreign-born population - Belgium (%)
Place of birth for the foreign-born population - France (%)
Place of birth for the foreign-born population - Germany (%)
Place of birth for the foreign-born population - Netherlands (%)
Place of birth for the foreign-born population - Switzerland (%)
Place of birth for the foreign-born population - Other Western Europe (%)
Place of birth for the foreign-born population - Greece (%)
Place of birth for the foreign-born population - Italy (%)
Place of birth for the foreign-born population - Portugal (%)
Place of birth for the foreign-born population - Spain (%)
Place of birth for the foreign-born population - Other Southern Europe (%)
Place of birth for the foreign-born population - Albania (%)
Place of birth for the foreign-born population - Belarus (%)
Place of birth for the foreign-born population - Bosnia and Herzegovina (%)
Place of birth for the foreign-born population - Bulgaria (%)
Place of birth for the foreign-born population - Croatia (%)
Place of birth for the foreign-born population - Czechoslovakia (%)
Place of birth for the foreign-born population - Hungary (%)
Place of birth for the foreign-born population - Latvia (%)
Place of birth for the foreign-born population - Lithuania (%)
Place of birth for the foreign-born population - North Macedonia (Macedonia) (%)
Place of birth for the foreign-born population - Moldova (%)
Place of birth for the foreign-born population - Poland (%)
Place of birth for the foreign-born population - Romania (%)
Place of birth for the foreign-born population - Russia (%)
Place of birth for the foreign-born population - Serbia (%)
Place of birth for the foreign-born population - Ukraine (%)
Place of birth for the foreign-born population - Other Eastern Europe (%)
Place of birth for the foreign-born population - China (%)
Place of birth for the foreign-born population - Hong Kong (%)
Place of birth for the foreign-born population - Taiwan (%)
Place of birth for the foreign-born population - Japan (%)
Place of birth for the foreign-born population - Korea (%)
Place of birth for the foreign-born population - Other Eastern Asia (%)
Place of birth for the foreign-born population - Afghanistan (%)
Place of birth for the foreign-born population - Bangladesh (%)
Place of birth for the foreign-born population - India (%)
Place of birth for the foreign-born population - Iran (%)
Place of birth for the foreign-born population - Kazakhstan (%)
Place of birth for the foreign-born population - Nepal (%)
Place of birth for the foreign-born population - Pakistan (%)
Place of birth for the foreign-born population - Sri Lanka (%)
Place of birth for the foreign-born population - Uzbekistan (%)
Place of birth for the foreign-born population - Other South Central Asia (%)
Place of birth for the foreign-born population - Burma (%)
Place of birth for the foreign-born population - Cambodia (%)
Place of birth for the foreign-born population - Indonesia (%)
Place of birth for the foreign-born population - Laos (%)
Place of birth for the foreign-born population - Malaysia (%)
Place of birth for the foreign-born population - Philippines (%)
Place of birth for the foreign-born population - Singapore (%)
Place of birth for the foreign-born population - Thailand (%)
Place of birth for the foreign-born population - Vietnam (%)
Place of birth for the foreign-born population - Other South Eastern Asia (%)
Place of birth for the foreign-born population - Armenia (%)
Place of birth for the foreign-born population - Iraq (%)
Place of birth for the foreign-born population - Israel (%)
Place of birth for the foreign-born population - Jordan (%)
Place of birth for the foreign-born population - Kuwait (%)
Place of birth for the foreign-born population - Lebanon (%)
Place of birth for the foreign-born population - Saudi Arabia (%)
Place of birth for the foreign-born population - Syria (%)
Place of birth for the foreign-born population - Turkey (%)
Place of birth for the foreign-born population - Yemen (%)
Place of birth for the foreign-born population - Other Western Asia (%)
Place of birth for the foreign-born population - Eritrea (%)
Place of birth for the foreign-born population - Ethiopia (%)
Place of birth for the foreign-born population - Kenya (%)
Place of birth for the foreign-born population - Somalia (%)
Place of birth for the foreign-born population - Uganda (%)
Place of birth for the foreign-born population - Zimbabwe (%)
Place of birth for the foreign-born population - Other Eastern Africa (%)
Place of birth for the foreign-born population - Cameroon (%)
Place of birth for the foreign-born population - Congo (%)
Place of birth for the foreign-born population - Democratic Republic of Congo (Zaire) (%)
Place of birth for the foreign-born population - Other Middle Africa (%)
Place of birth for the foreign-born population - Egypt (%)
Place of birth for the foreign-born population - Morocco (%)
Place of birth for the foreign-born population - Sudan (%)
Place of birth for the foreign-born population - Other Northern Africa (%)
Place of birth for the foreign-born population - South Africa (%)
Place of birth for the foreign-born population - Other Southern Africa (%)
Place of birth for the foreign-born population - Cabo Verde (%)
Place of birth for the foreign-born population - Ghana (%)
Place of birth for the foreign-born population - Liberia (%)
Place of birth for the foreign-born population - Nigeria (%)
Place of birth for the foreign-born population - Senegal (%)
Place of birth for the foreign-born population - Sierra Leone (%)
Place of birth for the foreign-born population - Other Western Africa (%)
Place of birth for the foreign-born population - Australia (%)
Place of birth for the foreign-born population - New Zealand (%)
Place of birth for the foreign-born population - Fiji (%)
Place of birth for the foreign-born population - Micronesia (%)
Place of birth for the foreign-born population - Bahamas (%)
Place of birth for the foreign-born population - Barbados (%)
Place of birth for the foreign-born population - Cuba (%)
Place of birth for the foreign-born population - Dominica (%)
Place of birth for the foreign-born population - Dominican Republic (%)
Place of birth for the foreign-born population - Grenada (%)
Place of birth for the foreign-born population - Haiti (%)
Place of birth for the foreign-born population - Jamaica (%)
Place of birth for the foreign-born population - St. Vincent and the Grenadines (%)
Place of birth for the foreign-born population - Trinidad and Tobago (%)
Place of birth for the foreign-born population - West Indies (%)
Place of birth for the foreign-born population - Other Caribbean (%)
Place of birth for the foreign-born population - Belize (%)
Place of birth for the foreign-born population - Costa Rica (%)
Place of birth for the foreign-born population - El Salvador (%)
Place of birth for the foreign-born population - Guatemala (%)
Place of birth for the foreign-born population - Honduras (%)
Place of birth for the foreign-born population - Mexico (%)
Place of birth for the foreign-born population - Nicaragua (%)
Place of birth for the foreign-born population - Panama (%)
Place of birth for the foreign-born population - Other Central America (%)
Place of birth for the foreign-born population - Argentina (%)
Place of birth for the foreign-born population - Bolivia (%)
Place of birth for the foreign-born population - Brazil (%)
Place of birth for the foreign-born population - Chile (%)
Place of birth for the foreign-born population - Colombia (%)
Place of birth for the foreign-born population - Ecuador (%)
Place of birth for the foreign-born population - Guyana (%)
Place of birth for the foreign-born population - Peru (%)
Place of birth for the foreign-born population - Uruguay (%)
Place of birth for the foreign-born population - Venezuela (%)
Place of birth for the foreign-born population - Other South America (%)
Place of birth for the foreign-born population - Canada (%)
Place of birth for the foreign-born population - Other Northern America (%)
Place of birth for the foreign-born population - Other (%)
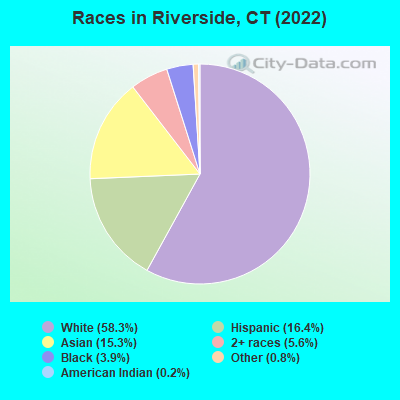
According to 2022 data, the most numerous races in Riverside, CT are White alone (5,327 residents), Hispanic (1,494 residents), and Black alone (352 residents). 63.7% of Riverside residents speak English at home.
Race distribution in Riverside 5,327 58.3% White alone 1,494 16.4% Hispanic 1,399 15.3% Asian alone 511 5.6% Two or more races 352 3.9% Black alone 76 0.8% Other race alone 17 0.2% American Indian alone
2000 2022
2,638,845 77.5% White alone 320,323 9.4% Hispanic 295,571 8.7% Black alone 81,564 2.4% Asian alone 52,896 1.6% Two or more races 8,141 0.2% Other race alone 7,267 0.2% American Indian alone 958 0.03% Native Hawaiian and Other
2,246,913 62.0% White alone 658,978 18.2% Hispanic 353,973 9.8% Black alone 172,929 4.8% Asian alone 159,631 4.4% Two or more races 29,761 0.8% Other race alone 3,428 0.09% American Indian alone 592 0.02% Native Hawaiian and Other
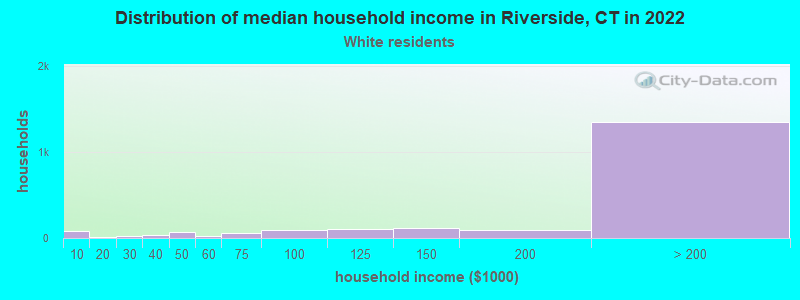
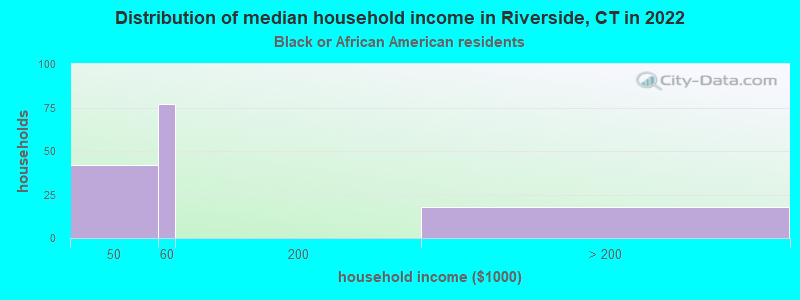
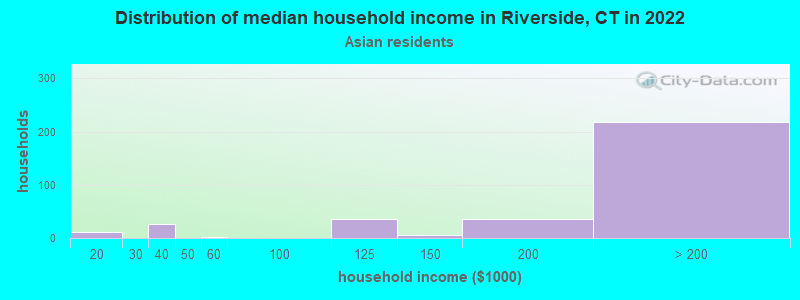
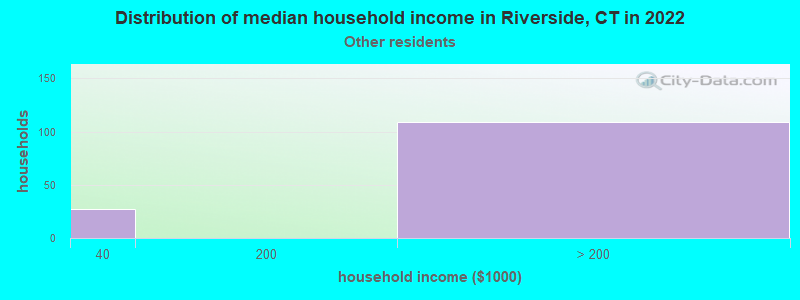
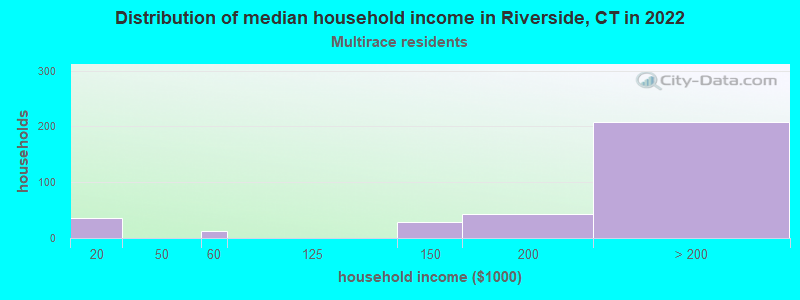
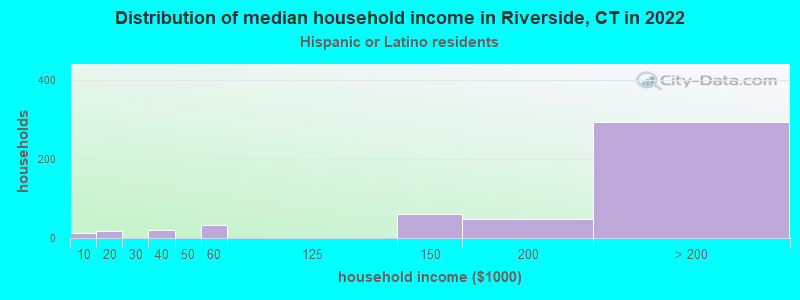
Income and house value in Riverside Median household income in 2022 over $200,000 White non-Hispanic householders$52,920 Black householdersover $200,000 Asian householdersover $200,000 Some other race householdersover $200,000 Two or more races householdersover $200,000 Hispanic or Latino race householders
Median age by race in Riverside
44.2 Median age for White residents43.9 44.5 36.6 Median age for Black or African American residents36.7 20.3 -742,173,111.6 Median age for American Indian / Alaska Native residents-701,030,927.1 -704,477,611.2 35.3 Median age for Asian residents38.6 24.9 -641,269,840.6 Median age for Native Hawaiian / Pacific Islander residents-414,239,481.8 -691,588,784.4 39.7 Median age for Other race residents36.5 45.3 28.8 Median age for Two or more races residents20.9 32.2 44.3 Median age for White alone residents43.2 46.3 41.3 Median age for Hispanic or Latino residents43.3 35.7
Owner/renter occupied households by race in Riverside
House owners and renters - White residents 1,781 84.8% Owner occupied320 15.2% Renter occupiedHouse owners and renters - Black or African American residents 48 39.2% Owner occupied75 60.8% Renter occupiedHouse owners and renters - Asian residents 240 70.1% Owner occupied102 29.9% Renter occupiedHouse owners and renters - Other race residents 83 77.9% Owner occupied24 22.1% Renter occupiedHouse owners and renters - Two or more races residents 365 100.0% Owner occupiedHouse owners and renters - White alone residents 1,628 83.9% Owner occupied313 16.1% Renter occupiedHouse owners and renters - Hispanic or Latino residents 477 89.9% Owner occupied53 10.1% Renter occupied
Language usage in Riverside
English speakers - Total 63.7% of residents of Riverside speak English at home.
16.5% of residents speak Spanish at home 1,001 70.5% Speak English very well418 29.5% Speak English less than very well20.3% of residents speak other language at home 1,300 74.2% Speak English very well451 25.8% Speak English less than very well
English speakers - Born in the United States 84.8% of residents of Riverside speak English at home.
6.6% of residents speak Spanish at home 217 86.8% Speak English very well33 13.2% Speak English less than very well8.7% of residents speak other language at home 319 96.7% Speak English very well11 3.3% Speak English less than very well
English speakers - Native, born elsewhere 92.5% of residents of Riverside speak English at home.
9.4% of residents speak Spanish at home 24 100.0% Speak English very well7.5% of residents speak other language at home 19 100.0% Speak English very well
English speakers - Foreign-born 18.3% of residents of Riverside speak English at home.
37.5% of residents speak Spanish at home 718 71.0% Speak English very well293 29.0% Speak English less than very well45.0% of residents speak other language at home 776 64.0% Speak English very well436 36.0% Speak English less than very well
White (Caucasian) - Speak only English Native:
88.1% (4,102)Foreign-born:
34.7% (315)
White (Caucasian) - Speak another language Native:
10.3% (480)Foreign-born:
66.0% (599)
Black or African American - Speak only English Native:
90.3% (264)Foreign-born:
17.4% (18)
Black or African American - Speak another language Native:
9.8% (29)Foreign-born:
70.6% (75)
Asian - Speak only English Native:
52.5% (173)Foreign-born:
9.3% (79)
Asian - Speak another language Native:
47.4% (156)Foreign-born:
91.1% (779)
Other race - Speak only English Native:
59.7% (68)Foreign-born:
15.7% (15)
Other race - Speak another language Native:
43.5% (50)Foreign-born:
82.6% (77)
Two or more races - Speak only English Native:
78.5% (400)Foreign-born:
1.6% (12)
Two or more races - Speak another language Native:
18.7% (95)Foreign-born:
100.0% (718)
White alone - Speak only English Native:
90.9% (4,079)Foreign-born:
48.8% (326)
White alone - Speak another language Native:
9.1% (409)Foreign-born:
51.7% (345)
Hispanic or Latino - Speak only English Native:
28.9% (148)Foreign-born:
0.7% (6)
Hispanic or Latino - Speak another language Native:
70.2% (359)Foreign-born:
100.0% (952)
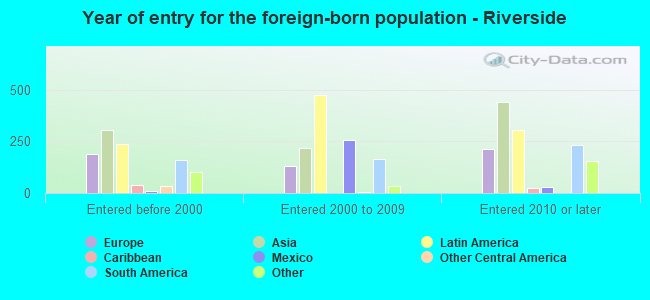
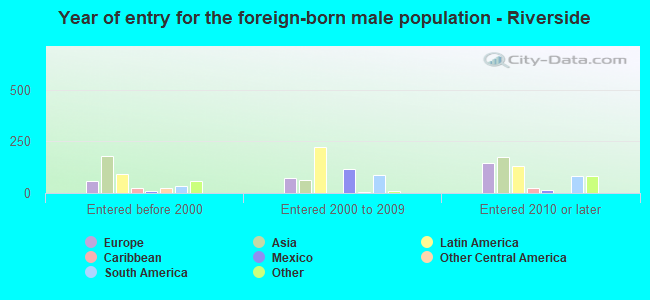
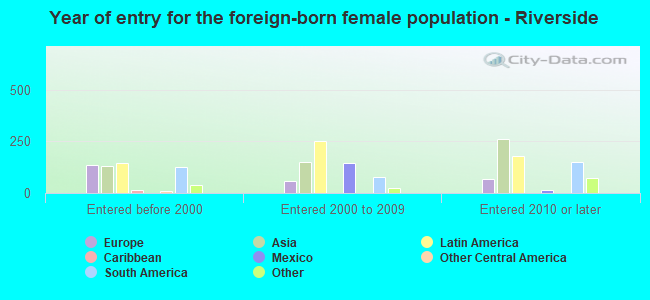
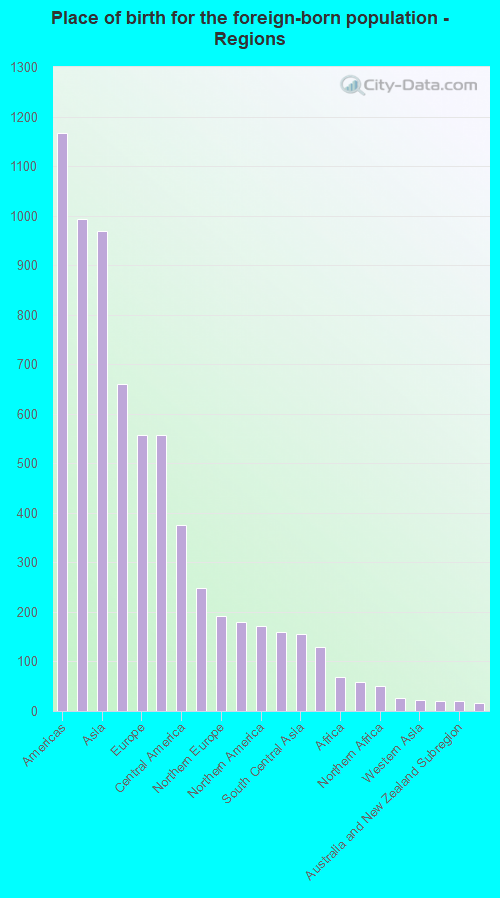
Foreign-born residents in Riverside
Marital status for residents in Riverside Marital status - White (Caucasian) population 15 years and over
Males 31.0% Never married63.4% Now married0.0% Separated0.8% Widowed4.8% DivorcedFemales 24.5% Never married61.0% Now married0.3% Separated6.5% Widowed7.6% DivorcedWomen who gave birth in the past 12 months Now married:
100.0% (54)Unmarried:
0.0% (0)
Women who did not give birth in the past 12 months Now married:
53.2% (572)Unmarried:
46.8% (502)
Marital status - Black or African American population 15 years and over
Males 60.3% Never married20.1% Now married9.2% Separated10.3% Widowed0.0% DivorcedFemales 64.9% Never married0.0% Now married0.0% Separated0.0% Widowed35.1% DivorcedWomen who did not give birth in the past 12 months Now married:
0.0% (0)Unmarried:
100.0% (114)
Marital status - Asian population 15 years and over
Males 18.1% Never married79.8% Now married0.0% Separated0.0% Widowed2.1% DivorcedFemales 12.4% Never married72.9% Now married0.0% Separated9.2% Widowed5.6% DivorcedWomen who gave birth in the past 12 months Now married:
100.0% (29)Unmarried:
0.0% (0)
Women who did not give birth in the past 12 months Now married:
81.0% (267)Unmarried:
19.0% (63)
Marital status - Other race population 15 years and over
Males 29.3% Never married44.0% Now married0.0% Separated0.0% Widowed26.7% DivorcedFemales 74.4% Never married25.6% Now married0.0% Separated0.0% Widowed0.0% DivorcedWomen who did not give birth in the past 12 months Now married:
19.0% (18)Unmarried:
81.0% (78)
Marital status - Two or more races population 15 years and over
Males 31.9% Never married68.1% Now married0.0% Separated0.0% Widowed0.0% DivorcedFemales 31.0% Never married61.1% Now married0.0% Separated5.8% Widowed2.2% DivorcedWomen who did not give birth in the past 12 months Now married:
37.6% (104)Unmarried:
62.4% (173)
Marital status - White alone, not Hispanic / Latino population 15 years and over
Males 31.7% Never married62.3% Now married0.0% Separated0.5% Widowed5.5% DivorcedFemales 23.3% Never married60.9% Now married0.4% Separated7.1% Widowed8.3% DivorcedWomen who gave birth in the past 12 months Now married:
100.0% (57)Unmarried:
0.0% (0)
Women who did not give birth in the past 12 months Now married:
51.5% (518)Unmarried:
48.5% (488)
Marital status - Hispanic or Latino population 15 years and over
Males 24.6% Never married70.5% Now married0.0% Separated1.3% Widowed3.6% DivorcedFemales 35.3% Never married60.7% Now married0.0% Separated4.0% Widowed0.0% DivorcedWomen who did not give birth in the past 12 months Now married:
48.1% (147)Unmarried:
51.9% (159)
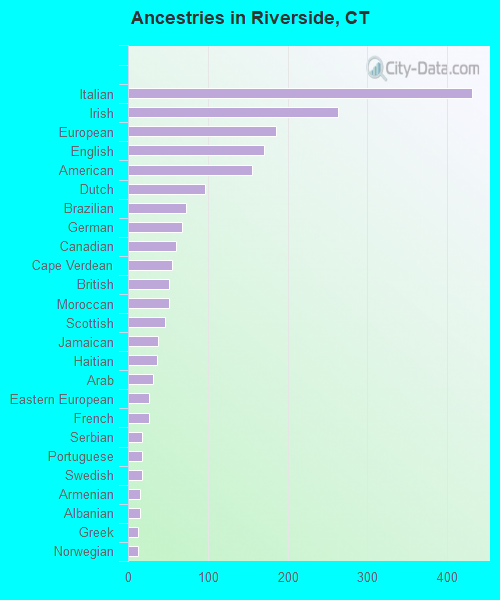
Ancestries in Riverside
431 10.7% Italian263 6.5% Irish186 4.6% European170 4.2% English156 3.9% American97 2.4% Dutch73 1.8% Brazilian68 1.7% German60 1.5% Canadian55 1.4% Cape Verdean52 1.3% British51 1.3% Moroccan46 1.1% Scottish38 0.9% Jamaican36 0.9% Haitian31 0.8% Arab26 0.6% Eastern European26 0.6% French18 0.4% Serbian17 0.4% Portuguese17 0.4% Swedish15 0.4% Armenian15 0.4% Albanian13 0.3% Greek13 0.3% Norwegian13 0.3% Polish12 0.3% Croatian12 0.3% South African12 0.3% British West Indian11 0.3% Lebanese9 0.2% Northern European8 0.2% Belgian8 0.2% Lithuanian8 0.2% French Canadian8 0.2% Ukrainian6 0.1% Australian5 0.1% Scandinavian4 0.10% Slovak3 0.07% Romanian3 0.07% Scotch-Irish
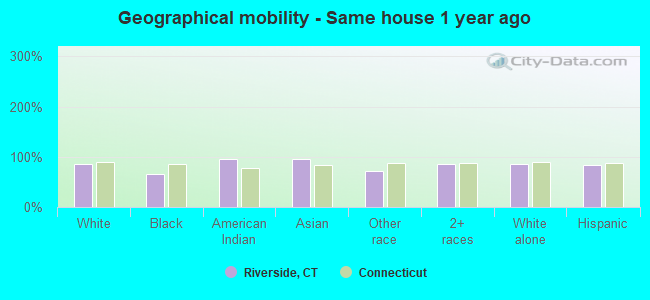
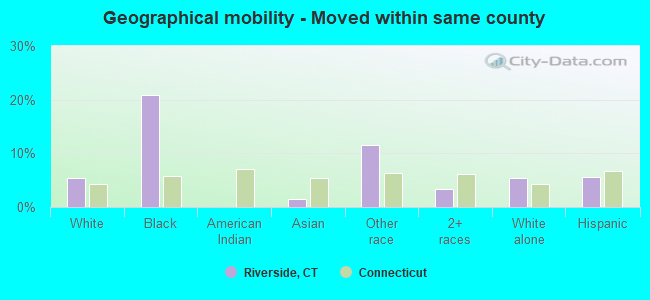
Geographical mobility in Riverside Same house 1 year ago 4,935 85.1% White (Caucasian)261 66.0% Black or African American19 94.8% American Indian / Alaska Native1,329 95.1% Asian153 71.0% Other race1,052 86.2% Two or more races4,508 85.1% White alone, not Hispanic / Latino1,236 83.0% Hispanic or LatinoMoved within same county 317 5.5% White / Caucasian82 20.8% Black or African American22 1.6% Asian25 11.6% Other race41 3.4% Two or more races284 5.4% White alone, not Hispanic / Latino83 5.6% Hispanic or LatinoMoved within same state 14 0.2% White / Caucasian14 0.3% White alone, not Hispanic / LatinoMoved from different state 608 10.5% White / Caucasian49 12.5% Black or African American45 20.9% Other race36 3.0% Two or more races577 10.9% White alone, not Hispanic / Latino117 7.9% Hispanic or LatinoMoved from abroad 35 0.6% White36 2.5% Asian86 7.0% Two or more races21 0.4% White alone, not Hispanic / Latino72 4.8% Hispanic or Latino
Children Nativity (place of birth) in Riverside
Children under 6 years - Living with two parents Both parents native 344 99.4% Native2 0.6% Foreign-bornBoth parents foreign-born 198 64.0% Native111 36.0% Foreign-bornOne native, one foreign-born parent 57 84.3% Native11 15.7% Foreign-bornChildren under 6 years - Living with one parent Native parent 15 100.0% NativeChildren 6 to 17 years - Living with two parents Both parents native 996 100.0% NativeBoth parents foreign-born 387 57.7% Native283 42.3% Foreign-bornOne native, one foreign-born parent 227 93.9% Native15 6.1% Foreign-bornChildren 6 to 17 years - Living with one parent Native parent 53 100.0% NativeForeign-born parent 75 50.8% Native72 49.2% Foreign-born