Races in Riverside, Maryland (MD) Detailed Stats
Ancestries, Foreign-born residents, place of birth
Settings
X


Recent posts about races in Riverside, Maryland on our local forum with over 2,400,000 registered users:
 | Irish couple 29-27 moving to Baltimore (96 replies) |
| They finally arrested a couple of squeegee kids... (111 replies) |
| From Florida to Baltimore! (55 replies) |
| Moving to Baltimore area - or thinking about it (21 replies) |
| Safest Bmore neighborhoods for a solo woman living alone (9 replies) |
| Possible relocation from NYC to Baltimore- How's this area in Federal Hill? (28 replies) |
Latest news about races in Riverside, MD collected exclusively by city-data.com from local newspapers, TV, and radio stations
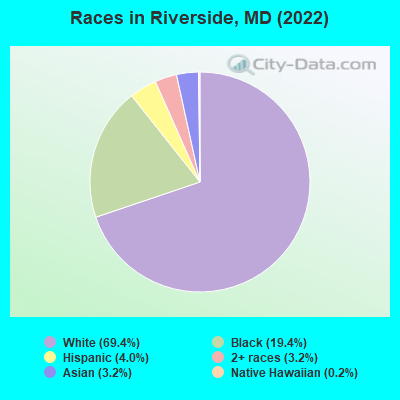
According to 2022 data, the most numerous races in Riverside, MD are White alone (4,154 residents), Black alone (1,162 residents), and Hispanic (238 residents). 89.2% of Riverside residents speak English at home. 12.9% of Riverside, MD residents are foreign-born (5.3% born in Latin America, 2.9% born in Europe, 2.3% born in Asia, 1.5% born in Africa), which is 23.9% less than the foreign-born rate of 16.0% across the entire state of Maryland.
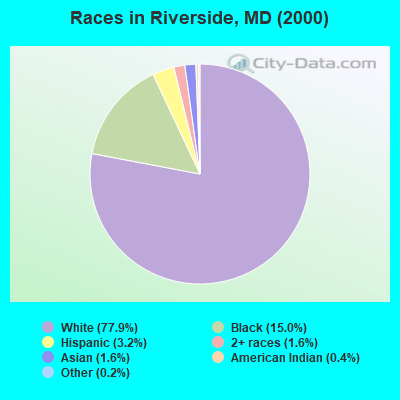
Race distribution in Riverside
2000
2022

- 4,77677.9%White alone
- 92215.0%Black alone
- 1973.2%Hispanic
- 971.6%Asian alone
- 991.6%Two or more races
- 220.4%American Indian alone
- 120.2%Other race alone
- 30.05%Native Hawaiian and Other
Pacific Islander alone
-
- 4,15469.4%White alone
- 1,16219.4%Black alone
- 2384.0%Hispanic
- 1923.2%Asian alone
- 1933.2%Two or more races
- 90.2%Native Hawaiian and Other
Pacific Islander alone
2000
2022
-
- 3,286,54762.1%White alone
- 1,464,73527.7%Black alone
- 227,9164.3%Hispanic
- 209,7384.0%Asian alone
- 82,9461.6%Two or more races
- 13,3120.3%American Indian alone
- 9,3790.2%Other race alone
- 1,9130.04%Native Hawaiian and Other
Pacific Islander alone

-
- 2,906,49247.1%White alone
- 1,800,91429.2%Black alone
- 705,84211.4%Hispanic
- 401,8186.5%Asian alone
- 291,3174.7%Two or more races
- 46,9300.8%Other race alone
- 8,9300.1%American Indian alone
- 2,4170.04%Native Hawaiian and Other
Pacific Islander alone

Income and house value in Riverside
- Median household income in 2022
- $87,903White non-Hispanic householders
- $108,531Black householders
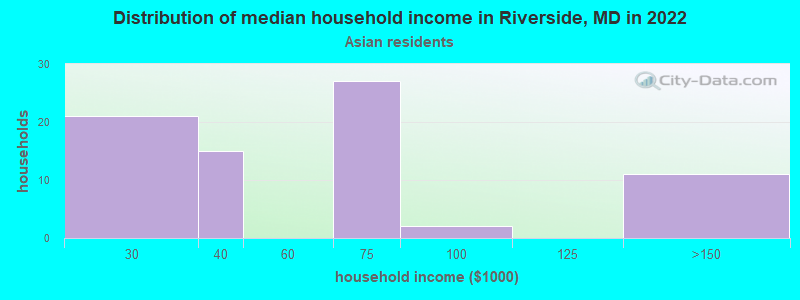
- $48,877Asian householders
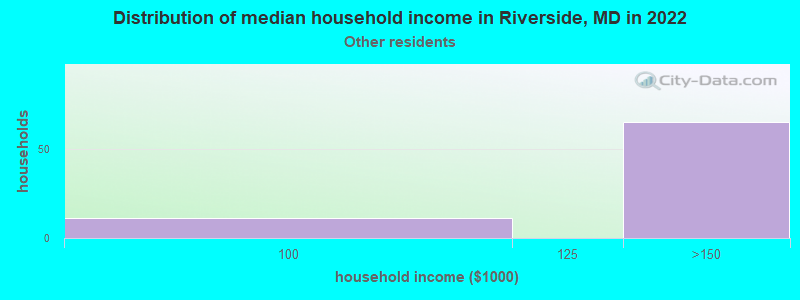
- $128,929Some other race householders
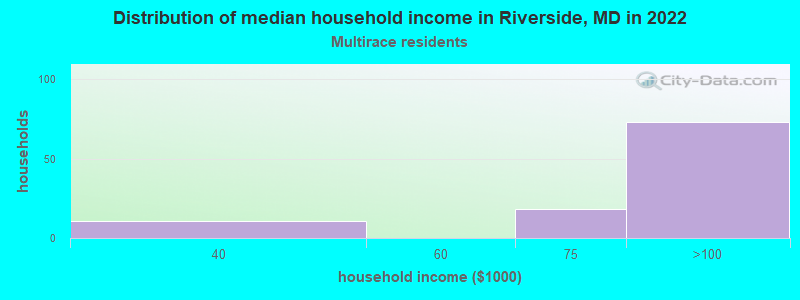
- $66,378Two or more races householders
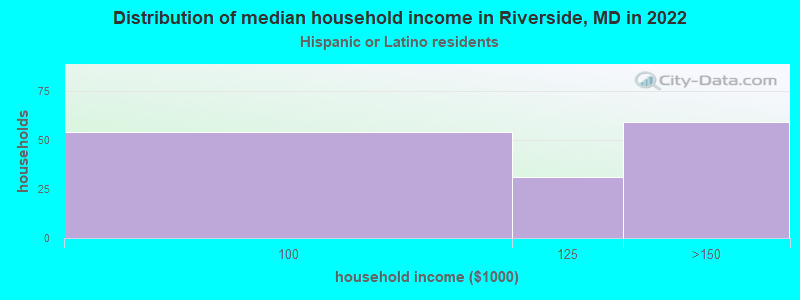
- $78,558Hispanic or Latino race householders
- Median 2022 house value
- $243,494White Non-Hispanic householders
- $268,668Black or African American householders
- $314,666American Indian or Alaska Native householders
- $371,879Some other race householders
- $388,127Two or more races householders
- $256,081Hispanic or Latino householders
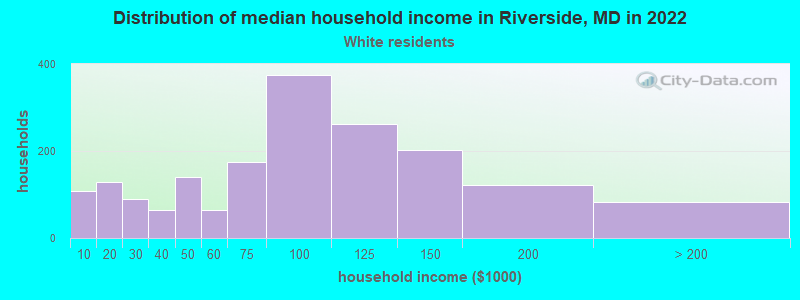
Household income for White non-Hispanic householders
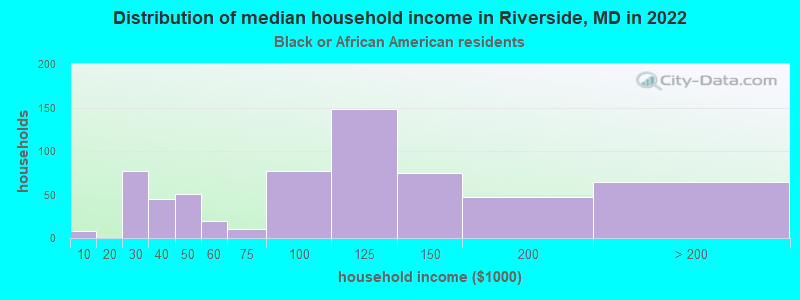
Household income for Black householders
Household income for Asian householders
Household income for Some other race householders
Household income for Two or more races householders
Household income for Hispanic or Latino race householders
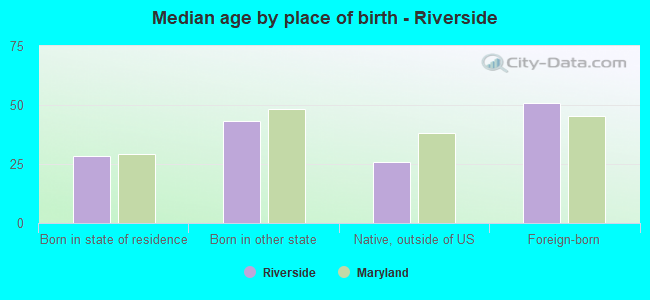
Median age by race in Riverside
- 32.4Median age for White residents
- 29.1Males
- 37.6Females
- 45.6Median age for Black or African American residents
- 43.4Males
- 49.3Females
- -647,863,247.2Median age for American Indian / Alaska Native residents
- -642,487,046.0Males
- -676,818,950.3Females
- 66.7Median age for Asian residents
- 77.3Males
- 64.4Females
- -763,333,332.6Median age for Native Hawaiian / Pacific Islander residents
- -666,666,666.0Males
- -760,942,760.2Females
- 52.6Median age for Other race residents
- -732,750,242.2Males
- 53.0Females
- 28.2Median age for Two or more races residents
- 45.4Males
- 24.1Females
- 32.3Median age for White alone residents
- 29.2Males
- 37.4Females
- 43.6Median age for Hispanic or Latino residents
- 41.0Males
- 44.4Females
Owner/renter occupied households by race in Riverside
- House owners and renters - White residents
- 1,19465.9%Owner occupied
- 61634.1%Renter occupied
- House owners and renters - Black or African American residents
- 34759.3%Owner occupied
- 23840.7%Renter occupied
- House owners and renters - Asian residents
- 8086.5%Owner occupied
- 1213.5%Renter occupied
- House owners and renters - Other race residents
- 3953.1%Owner occupied
- 3546.9%Renter occupied
- House owners and renters - Two or more races residents
- 2317.8%Owner occupied
- 10682.2%Renter occupied
- House owners and renters - White alone residents
- 1,20166.3%Owner occupied
- 61233.7%Renter occupied
- House owners and renters - Hispanic or Latino residents
- 3421.9%Owner occupied
- 12178.1%Renter occupied
Language usage in Riverside
- English speakers - Total
- 89.2% of residents of Riverside speak English at home.
- 2.9% of residents speak Spanish at home
- 11870.7%Speak English very well
- 4929.3%Speak English less than very well
- 7.7% of residents speak other language at home
- 28965.2%Speak English very well
- 15434.8%Speak English less than very well
- English speakers - Born in the United States
- 97.8% of residents of Riverside speak English at home.
- 0.8% of residents speak Spanish at home
- 13100.0%Speak English less than very well
- 1.7% of residents speak other language at home
- 28100.0%Speak English very well
All residents speak only English at home
- English speakers - Foreign-born
- 46.1% of residents of Riverside speak English at home.
- 20.8% of residents speak Spanish at home
- 14480.0%Speak English very well
- 3620.0%Speak English less than very well
- 37.1% of residents speak other language at home
- 17053.0%Speak English very well
- 15147.0%Speak English less than very well
White (Caucasian) - Speak only English
| Native: | 97.2% (3,646) |
| Foreign-born: | 40.1% (70) |
White (Caucasian) - Speak another language
| Native: | 2.8% (106) |
| Foreign-born: | 58.6% (102) |
Black or African American - Speak only English
| Native: | 99.6% (907) |
| Foreign-born: | 68.6% (179) |
Black or African American - Speak another language
| Native: | 0.8% (8) |
| Foreign-born: | 32.3% (84) |
Asian - Speak only English
| Native: | 36.5% (10) |
| Foreign-born: | 29.0% (48) |
Asian - Speak another language
| Native: | 61.6% (17) |
| Foreign-born: | 70.1% (116) |
Other race - Speak another language
| Native: | 90.9% (7) |
| Foreign-born: | 97.2% (118) |
White alone - Speak only English
| Native: | 96.7% (3,641) |
| Foreign-born: | 42.5% (82) |
White alone - Speak another language
| Native: | 3.5% (132) |
| Foreign-born: | 55.8% (108) |
Hispanic or Latino - Speak another language
| Native: | 7.6% (7) |
| Foreign-born: | 100.0% (155) |
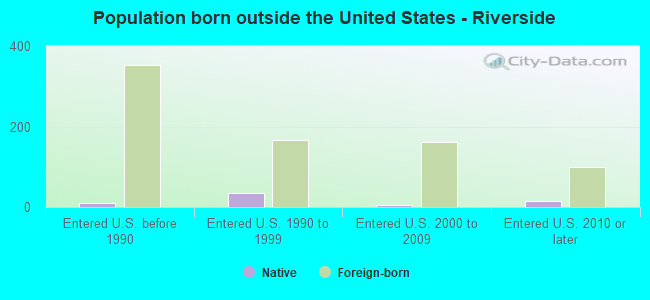
Foreign-born residents in Riverside
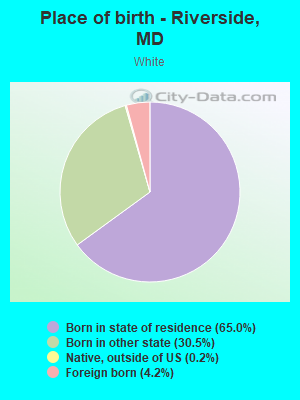
773 residents are foreign born (5.3% Latin America, 2.9% Europe, 2.3% Asia, 1.5% Africa).
| This city: | 12.9% |
| Maryland: | 15.7% |
Marital status for residents in Riverside
Marital status - White (Caucasian) population 15 years and over
- Males
- 47.7%Never married
- 43.9%Now married
- 1.9%Separated
- 1.5%Widowed
- 5.0%Divorced
- Females
- 32.2%Never married
- 48.2%Now married
- 0.5%Separated
- 10.0%Widowed
- 9.1%Divorced
Women who gave birth in the past 12 months
| Now married: | 100.0% (82) |
| Unmarried: | 0.0% (0) |
Women who did not give birth in the past 12 months
| Now married: | 47.8% (468) |
| Unmarried: | 52.2% (511) |
Marital status - Black or African American population 15 years and over
- Males
- 35.6%Never married
- 51.3%Now married
- 0.0%Separated
- 0.0%Widowed
- 13.1%Divorced
- Females
- 49.6%Never married
- 36.2%Now married
- 1.1%Separated
- 2.0%Widowed
- 11.1%Divorced
Women who gave birth in the past 12 months
| Now married: | 100.0% (30) |
| Unmarried: | 0.0% (0) |
Women who did not give birth in the past 12 months
| Now married: | 24.0% (86) |
| Unmarried: | 76.0% (272) |
Marital status - Asian population 15 years and over
- Males
- 3.2%Never married
- 96.8%Now married
- 0.0%Separated
- 0.0%Widowed
- 0.0%Divorced
- Females
- 0.0%Never married
- 100.0%Now married
- 0.0%Separated
- 0.0%Widowed
- 0.0%Divorced
Women who did not give birth in the past 12 months
| Now married: | 100.0% (32) |
| Unmarried: | 0.0% (0) |
Marital status - Other race population 15 years and over
- Males
- 0.0%Never married
- 100.0%Now married
- 0.0%Separated
- 0.0%Widowed
- 0.0%Divorced
- Females
- 12.7%Never married
- 27.0%Now married
- 0.0%Separated
- 0.0%Widowed
- 60.3%Divorced
Women who did not give birth in the past 12 months
| Now married: | 0.0% (0) |
| Unmarried: | 100.0% (58) |
Marital status - Two or more races population 15 years and over
- Males
- 6.2%Never married
- 93.8%Now married
- 0.0%Separated
- 0.0%Widowed
- 0.0%Divorced
- Females
- 63.1%Never married
- 27.7%Now married
- 0.0%Separated
- 0.0%Widowed
- 9.2%Divorced
Women who did not give birth in the past 12 months
| Now married: | 0.0% (0) |
| Unmarried: | 100.0% (57) |
Marital status - White alone, not Hispanic / Latino population 15 years and over
- Males
- 47.7%Never married
- 43.9%Now married
- 1.9%Separated
- 1.5%Widowed
- 5.0%Divorced
- Females
- 32.2%Never married
- 48.2%Now married
- 0.5%Separated
- 10.0%Widowed
- 9.1%Divorced
Women who gave birth in the past 12 months
| Now married: | 100.0% (84) |
| Unmarried: | 0.0% (0) |
Women who did not give birth in the past 12 months
| Now married: | 47.8% (474) |
| Unmarried: | 52.2% (518) |
Marital status - Hispanic or Latino population 15 years and over
- Males
- 0.0%Never married
- 100.0%Now married
- 0.0%Separated
- 0.0%Widowed
- 0.0%Divorced
- Females
- 37.6%Never married
- 29.9%Now married
- 0.0%Separated
- 0.0%Widowed
- 32.5%Divorced
Women who did not give birth in the past 12 months
| Now married: | 0.0% (0) |
| Unmarried: | 100.0% (93) |
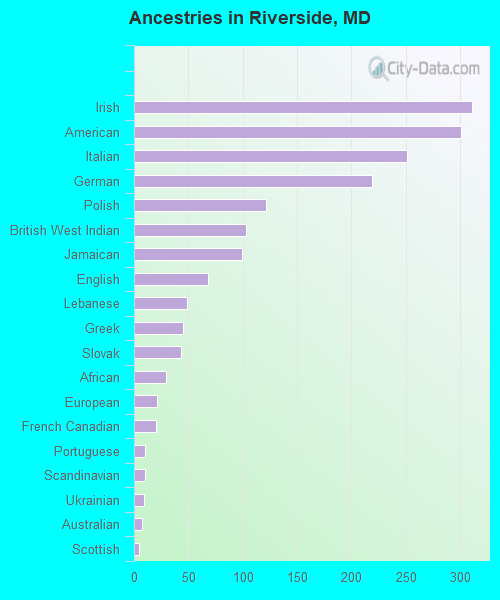
Ancestries in Riverside

- 31110.5%Irish
- 30110.1%American
- 2518.5%Italian
- 2197.4%German
- 1214.1%Polish
- 1033.5%British West Indian
- 993.3%Jamaican
- 682.3%English
- 491.7%Lebanese
- 451.5%Greek
- 431.4%Slovak
- 291.0%African
- 210.7%European
- 200.7%French Canadian
- 100.3%Portuguese
- 100.3%Scandinavian
- 90.3%Ukrainian
- 70.2%Australian
- 50.2%Scottish
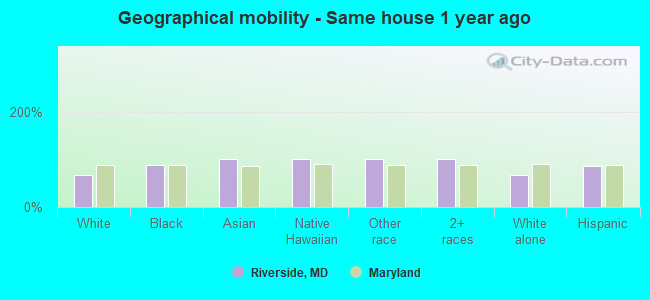
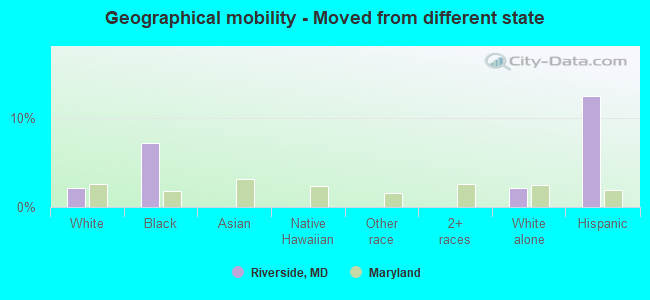
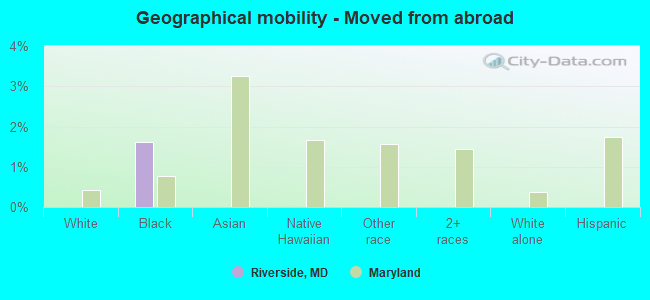
Geographical mobility in Riverside

- Same house 1 year ago
- 2,79067.9%White (Caucasian)
- 1,04687.7%Black or African American
- 17499.7%Asian
- 9100.0%Native Hawaiian / Pacific Islander
- 105100.0%Other race
- 325100.0%Two or more races
- 2,79767.8%White alone, not Hispanic / Latino
- 19986.4%Hispanic or Latino
-
- Moved within same county
- 90322.0%White / Caucasian
- 161.4%Black or African American
- 92422.4%White alone, not Hispanic / Latino

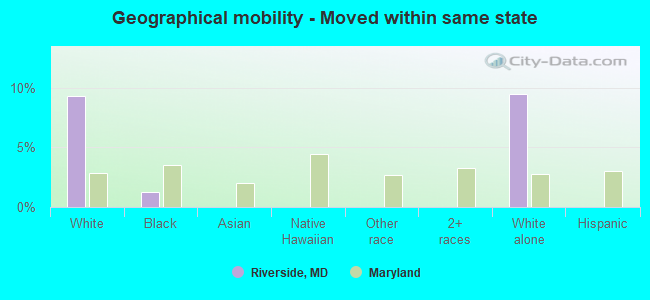
-
- Moved within same state
- 3829.3%White / Caucasian
- 151.3%Black or African American
- 3929.5%White alone, not Hispanic / Latino
-
- Moved from different state
- 872.1%White / Caucasian
- 857.1%Black or African American
- 892.2%White alone, not Hispanic / Latino
- 2912.4%Hispanic or Latino
-
- Moved from abroad
- 191.6%Black or African American
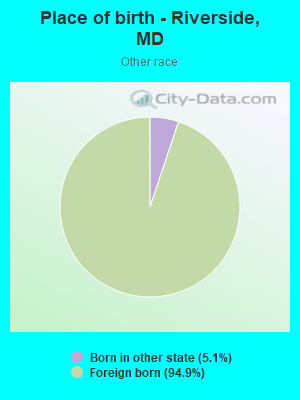
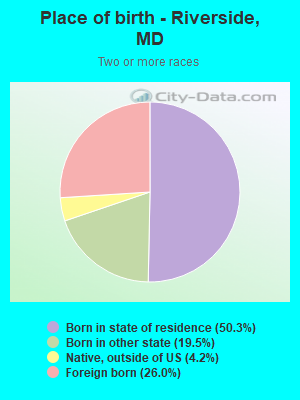
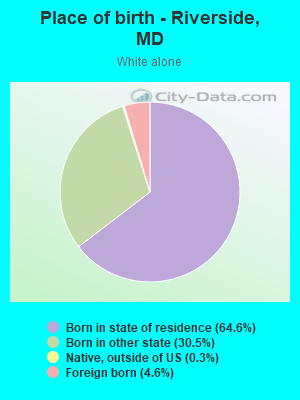
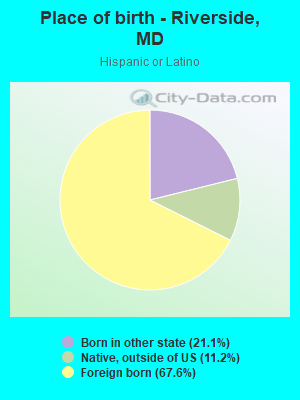
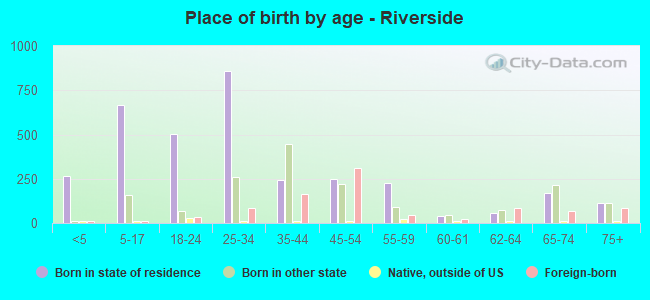
Children Nativity (place of birth) in Riverside
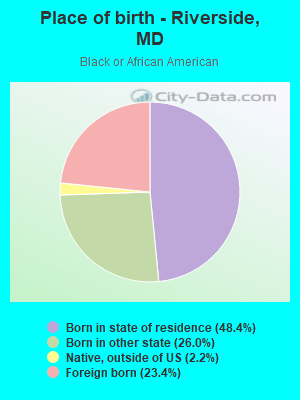
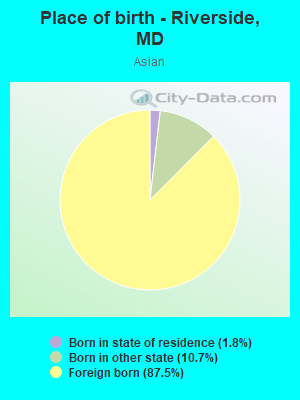
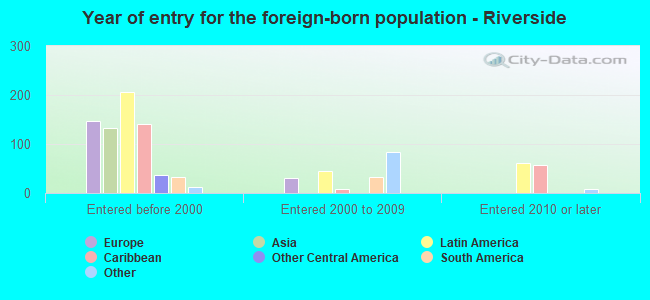
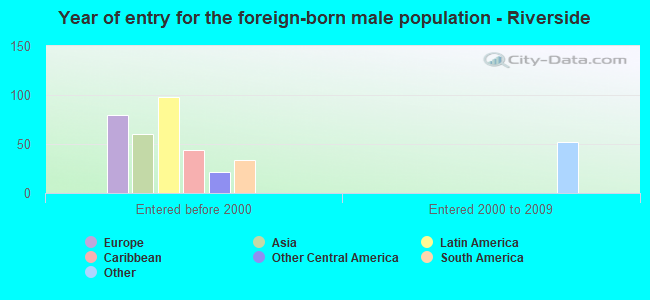
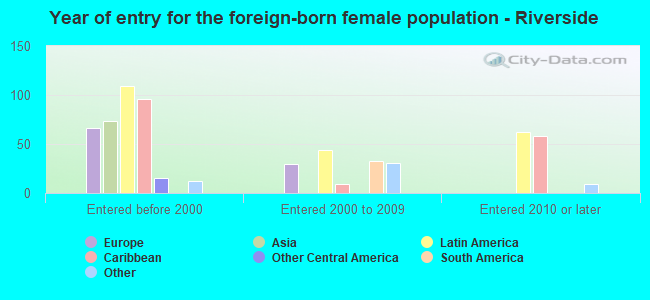
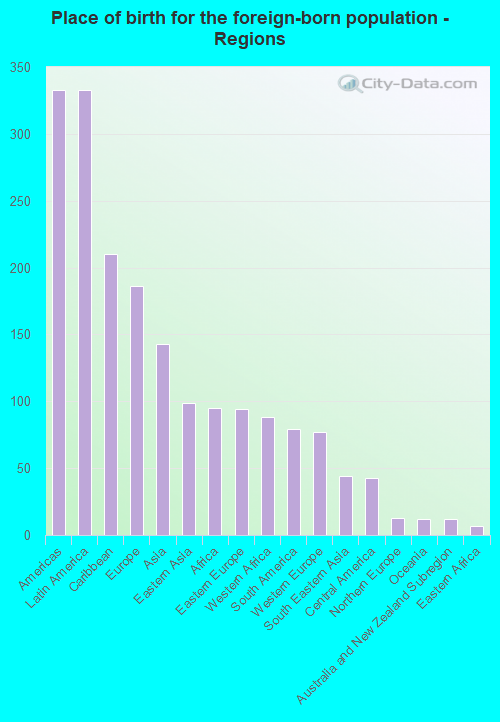
Place of birth for residents in Riverside
![Place of birth for the foreign-born population - Regions]()
- 333Americas
- 333Latin America
- 210Caribbean
- 186Europe
- 143Asia
- 99Eastern Asia
- 95Africa
- 94Eastern Europe
- 88Western Africa
- 79South America
- 77Western Europe
- 44South Eastern Asia
- 43Central America
- 13Northern Europe
- 12Oceania
- 12Australia and New Zealand Subregion
- 7Eastern Africa
- 2China
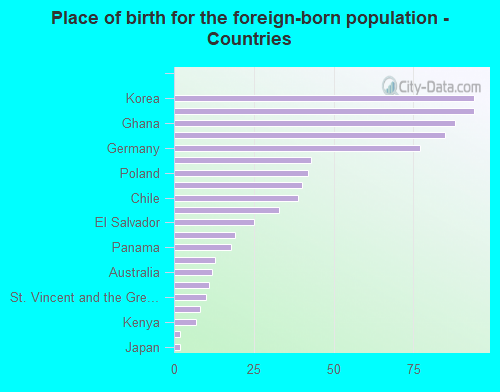
![Place of birth for the foreign-born population - Countries]()
- 94Korea
- 94St. Lucia
- 88Ghana
- 85Jamaica
- 77Germany
- 43Czechoslovakia
- 42Poland
- 40Peru
- 39Chile
- 33Philippines
- 25El Salvador
- 19Cuba
- 18Panama
- 13England
- 12Australia
- 11Vietnam
- 10St. Vincent and the Grenadines
- 8Ukraine
- 7Kenya
- 2Taiwan
- 2Japan
Zip codes: 21017.