Races in Riviera Beach, Florida (FL) Detailed Stats
Data:
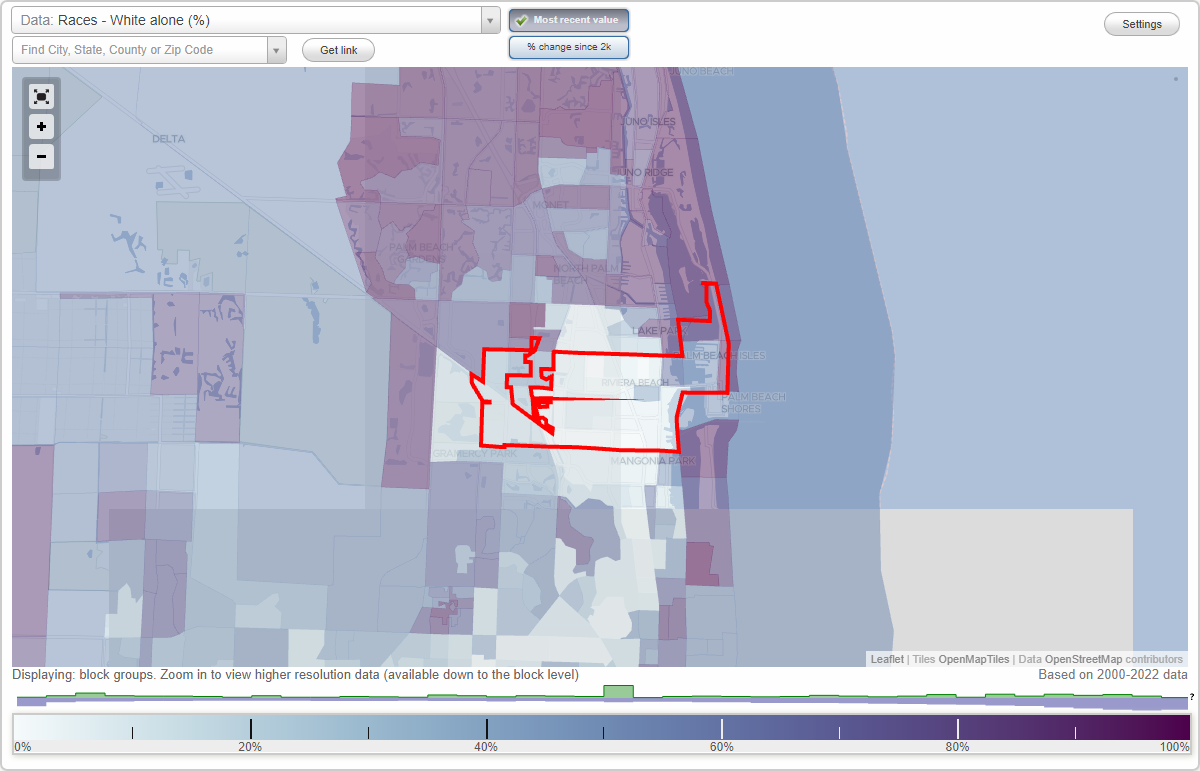
Races - White alone (%)
Races - White alone (% change since 2000)
Races - Black alone (%)
Races - Black alone (% change since 2000)
Races - American Indian alone (%)
Races - American Indian alone (% change since 2000)
Races - Asian alone (%)
Races - Asian alone (% change since 2000)
Races - Hispanic (%)
Races - Hispanic (% change since 2000)
Races - Native Hawaiian and Other Pacific Islander alone (%)
Races - Native Hawaiian and Other Pacific Islander alone (% change since 2000)
Races - Two or more races(%)
Races - Two or more races(% change since 2000)
Races - Other race alone (%)
Races - Other race alone (% change since 2000)
Racial diversity
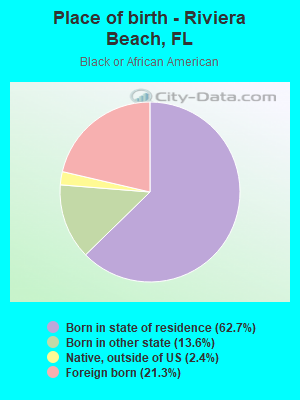
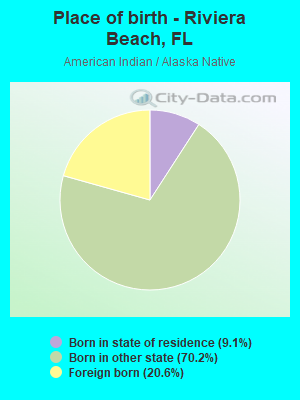
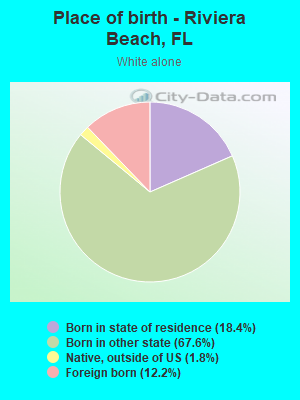
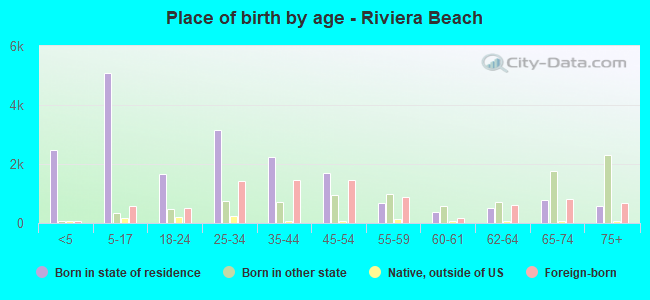
Place of birth - Born in state of residence (%)
Place of birth - Born in state of residence (%) - White
Place of birth - Born in state of residence (%) - Black or African American
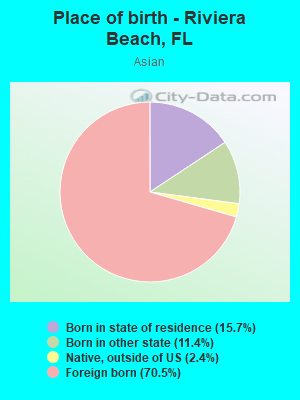
Place of birth - Born in state of residence (%) - Asian
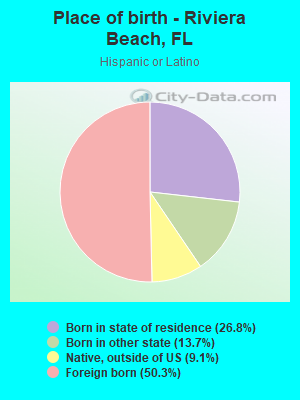
Place of birth - Born in state of residence (%) - Hispanic or Latino
Place of birth - Born in state of residence (%) - American Indian and Alaska Native
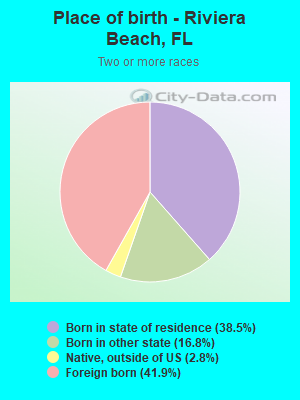
Place of birth - Born in state of residence (%) - Multirace
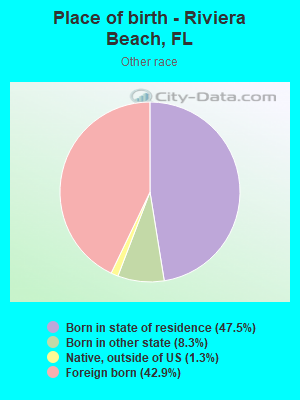
Place of birth - Born in state of residence (%) - Other Race
Place of birth - Born in other state (%)
Place of birth - Born in other state (%) - White
Place of birth - Born in other state (%) - Black or African American
Place of birth - Born in other state (%) - Asian
Place of birth - Born in other state (%) - Hispanic or Latino
Place of birth - Born in other state (%) - American Indian and Alaska Native
Place of birth - Born in other state (%) - Multirace
Place of birth - Born in other state (%) - Other Race
Place of birth - Native, outside of US (%)
Place of birth - Native, outside of US (%) - White
Place of birth - Native, outside of US (%) - Black or African American
Place of birth - Native, outside of US (%) - Asian
Place of birth - Native, outside of US (%) - Hispanic or Latino
Place of birth - Native, outside of US (%) - American Indian and Alaska Native
Place of birth - Native, outside of US (%) - Multirace
Place of birth - Native, outside of US (%) - Other Race
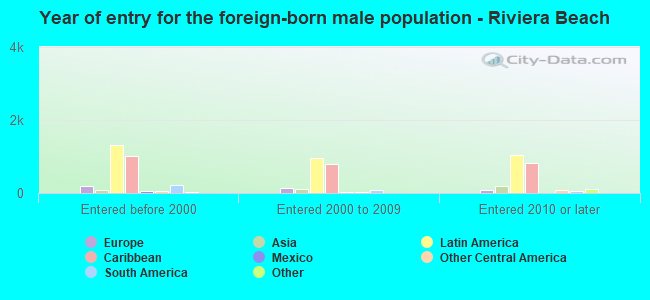
Place of birth - Foreign born (%)
Place of birth - Foreign born (%) - White
Place of birth - Foreign born (%) - Black or African American
Place of birth - Foreign born (%) - Asian
Place of birth - Foreign born (%) - Hispanic or Latino
Place of birth - Foreign born (%) - American Indian and Alaska Native
Place of birth - Foreign born (%) - Multirace
Place of birth - Foreign born (%) - Other Race
Residents speaking English at home (%)
Residents speaking English at home - Born in the United States (%)
Residents speaking English at home - Native, born elsewhere (%)
Residents speaking English at home - Foreign born (%)
Residents speaking Spanish at home (%)
Residents speaking Spanish at home - Born in the United States (%)
Residents speaking Spanish at home - Native, born elsewhere (%)
Residents speaking Spanish at home - Foreign born (%)
Residents speaking other language at home (%)
Residents speaking other language at home - Born in the United States (%)
Residents speaking other language at home - Native, born elsewhere (%)
Residents speaking other language at home - Foreign born (%)
Marital status - Never married (%)
Marital status - Now married (%)
Marital status - Separated (%)
Marital status - Widowed (%)
Marital status - Divorced (%)
Ancestries Reported - Arab (%)
Ancestries Reported - Czech (%)
Ancestries Reported - Danish (%)
Ancestries Reported - Dutch (%)
Ancestries Reported - English (%)
Ancestries Reported - French (%)
Ancestries Reported - French Canadian (%)
Ancestries Reported - German (%)
Ancestries Reported - Greek (%)
Ancestries Reported - Hungarian (%)
Ancestries Reported - Irish (%)
Ancestries Reported - Italian (%)
Ancestries Reported - Lithuanian (%)
Ancestries Reported - Norwegian (%)
Ancestries Reported - Polish (%)
Ancestries Reported - Portuguese (%)
Ancestries Reported - Russian (%)
Ancestries Reported - Scotch-Irish (%)
Ancestries Reported - Scottish (%)
Ancestries Reported - Slovak (%)
Ancestries Reported - Subsaharan African (%)
Ancestries Reported - Swedish (%)
Ancestries Reported - Swiss (%)
Ancestries Reported - Ukrainian (%)
Ancestries Reported - United States (%)
Ancestries Reported - Welsh (%)
Ancestries Reported - West Indian (%)
Ancestries Reported - Other (%)
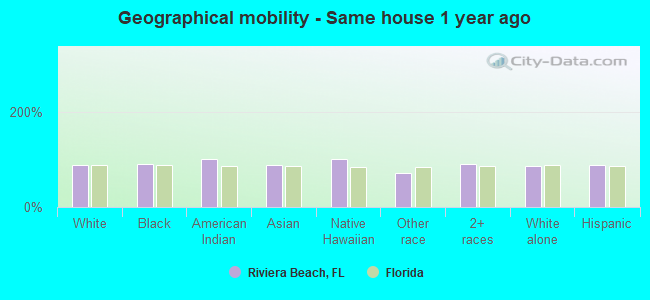
Geographical mobility - Same house 1 year ago (%)
Geographical mobility - Same house 1 year ago (%) - White
Geographical mobility - Same house 1 year ago (%) - Black or African American
Geographical mobility - Same house 1 year ago (%) - Asian
Geographical mobility - Same house 1 year ago (%) - Hispanic or Latino
Geographical mobility - Same house 1 year ago (%) - American Indian and Alaska Native
Geographical mobility - Same house 1 year ago (%) - Multirace
Geographical mobility - Same house 1 year ago (%) - Other Race
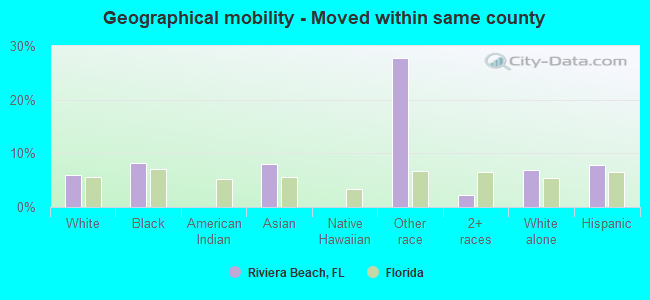
Geographical mobility - Moved within same county (%)
Geographical mobility - Moved within same county (%) - White
Geographical mobility - Moved within same county (%) - Black or African American
Geographical mobility - Moved within same county (%) - Asian
Geographical mobility - Moved within same county (%) - Hispanic or Latino
Geographical mobility - Moved within same county (%) - American Indian and Alaska Native
Geographical mobility - Moved within same county (%) - Multirace
Geographical mobility - Moved within same county (%) - Other Race
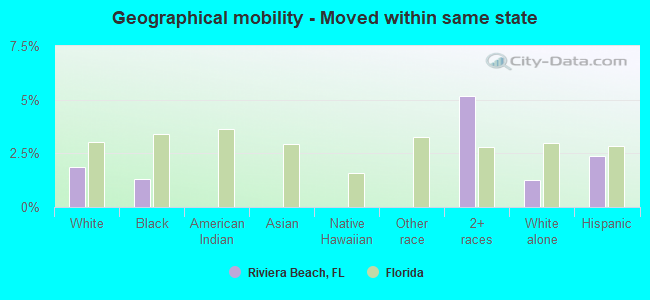
Geographical mobility - Moved from different county within same state (%)
Geographical mobility - Moved from different county within same state (%) - White
Geographical mobility - Moved from different county within same state (%) - Black or African American
Geographical mobility - Moved from different county within same state (%) - Asian
Geographical mobility - Moved from different county within same state (%) - Hispanic or Latino
Geographical mobility - Moved from different county within same state (%) - American Indian and Alaska Native
Geographical mobility - Moved from different county within same state (%) - Multirace
Geographical mobility - Moved from different county within same state (%) - Other Race
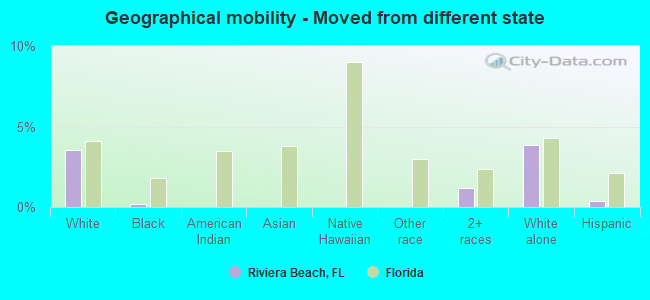
Geographical mobility - Moved from different state (%)
Geographical mobility - Moved from different state (%) - White
Geographical mobility - Moved from different state (%) - Black or African American
Geographical mobility - Moved from different state (%) - Asian
Geographical mobility - Moved from different state (%) - Hispanic or Latino
Geographical mobility - Moved from different state (%) - American Indian and Alaska Native
Geographical mobility - Moved from different state (%) - Multirace
Geographical mobility - Moved from different state (%) - Other Race
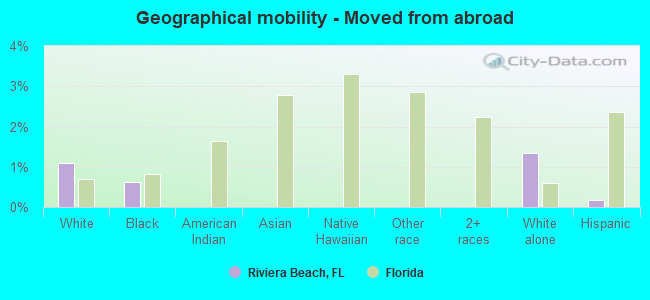
Geographical mobility - Moved from abroad (%)
Geographical mobility - Moved from abroad (%) - White
Geographical mobility - Moved from abroad (%) - Black or African American
Geographical mobility - Moved from abroad (%) - Asian
Geographical mobility - Moved from abroad (%) - Hispanic or Latino
Geographical mobility - Moved from abroad (%) - American Indian and Alaska Native
Geographical mobility - Moved from abroad (%) - Multirace
Geographical mobility - Moved from abroad (%) - Other Race
Place of birth for the foreign-born population - Ireland (%)
Place of birth for the foreign-born population - Denmark (%)
Place of birth for the foreign-born population - Norway (%)
Place of birth for the foreign-born population - Sweden (%)
Place of birth for the foreign-born population - United Kingdom (%)
Place of birth for the foreign-born population - England (%)
Place of birth for the foreign-born population - Scotland (%)
Place of birth for the foreign-born population - Other Northern Europe (%)
Place of birth for the foreign-born population - Austria (%)
Place of birth for the foreign-born population - Belgium (%)
Place of birth for the foreign-born population - France (%)
Place of birth for the foreign-born population - Germany (%)
Place of birth for the foreign-born population - Netherlands (%)
Place of birth for the foreign-born population - Switzerland (%)
Place of birth for the foreign-born population - Other Western Europe (%)
Place of birth for the foreign-born population - Greece (%)
Place of birth for the foreign-born population - Italy (%)
Place of birth for the foreign-born population - Portugal (%)
Place of birth for the foreign-born population - Spain (%)
Place of birth for the foreign-born population - Other Southern Europe (%)
Place of birth for the foreign-born population - Albania (%)
Place of birth for the foreign-born population - Belarus (%)
Place of birth for the foreign-born population - Bosnia and Herzegovina (%)
Place of birth for the foreign-born population - Bulgaria (%)
Place of birth for the foreign-born population - Croatia (%)
Place of birth for the foreign-born population - Czechoslovakia (%)
Place of birth for the foreign-born population - Hungary (%)
Place of birth for the foreign-born population - Latvia (%)
Place of birth for the foreign-born population - Lithuania (%)
Place of birth for the foreign-born population - North Macedonia (Macedonia) (%)
Place of birth for the foreign-born population - Moldova (%)
Place of birth for the foreign-born population - Poland (%)
Place of birth for the foreign-born population - Romania (%)
Place of birth for the foreign-born population - Russia (%)
Place of birth for the foreign-born population - Serbia (%)
Place of birth for the foreign-born population - Ukraine (%)
Place of birth for the foreign-born population - Other Eastern Europe (%)
Place of birth for the foreign-born population - China (%)
Place of birth for the foreign-born population - Hong Kong (%)
Place of birth for the foreign-born population - Taiwan (%)
Place of birth for the foreign-born population - Japan (%)
Place of birth for the foreign-born population - Korea (%)
Place of birth for the foreign-born population - Other Eastern Asia (%)
Place of birth for the foreign-born population - Afghanistan (%)
Place of birth for the foreign-born population - Bangladesh (%)
Place of birth for the foreign-born population - India (%)
Place of birth for the foreign-born population - Iran (%)
Place of birth for the foreign-born population - Kazakhstan (%)
Place of birth for the foreign-born population - Nepal (%)
Place of birth for the foreign-born population - Pakistan (%)
Place of birth for the foreign-born population - Sri Lanka (%)
Place of birth for the foreign-born population - Uzbekistan (%)
Place of birth for the foreign-born population - Other South Central Asia (%)
Place of birth for the foreign-born population - Burma (%)
Place of birth for the foreign-born population - Cambodia (%)
Place of birth for the foreign-born population - Indonesia (%)
Place of birth for the foreign-born population - Laos (%)
Place of birth for the foreign-born population - Malaysia (%)
Place of birth for the foreign-born population - Philippines (%)
Place of birth for the foreign-born population - Singapore (%)
Place of birth for the foreign-born population - Thailand (%)
Place of birth for the foreign-born population - Vietnam (%)
Place of birth for the foreign-born population - Other South Eastern Asia (%)
Place of birth for the foreign-born population - Armenia (%)
Place of birth for the foreign-born population - Iraq (%)
Place of birth for the foreign-born population - Israel (%)
Place of birth for the foreign-born population - Jordan (%)
Place of birth for the foreign-born population - Kuwait (%)
Place of birth for the foreign-born population - Lebanon (%)
Place of birth for the foreign-born population - Saudi Arabia (%)
Place of birth for the foreign-born population - Syria (%)
Place of birth for the foreign-born population - Turkey (%)
Place of birth for the foreign-born population - Yemen (%)
Place of birth for the foreign-born population - Other Western Asia (%)
Place of birth for the foreign-born population - Eritrea (%)
Place of birth for the foreign-born population - Ethiopia (%)
Place of birth for the foreign-born population - Kenya (%)
Place of birth for the foreign-born population - Somalia (%)
Place of birth for the foreign-born population - Uganda (%)
Place of birth for the foreign-born population - Zimbabwe (%)
Place of birth for the foreign-born population - Other Eastern Africa (%)
Place of birth for the foreign-born population - Cameroon (%)
Place of birth for the foreign-born population - Congo (%)
Place of birth for the foreign-born population - Democratic Republic of Congo (Zaire) (%)
Place of birth for the foreign-born population - Other Middle Africa (%)
Place of birth for the foreign-born population - Egypt (%)
Place of birth for the foreign-born population - Morocco (%)
Place of birth for the foreign-born population - Sudan (%)
Place of birth for the foreign-born population - Other Northern Africa (%)
Place of birth for the foreign-born population - South Africa (%)
Place of birth for the foreign-born population - Other Southern Africa (%)
Place of birth for the foreign-born population - Cabo Verde (%)
Place of birth for the foreign-born population - Ghana (%)
Place of birth for the foreign-born population - Liberia (%)
Place of birth for the foreign-born population - Nigeria (%)
Place of birth for the foreign-born population - Senegal (%)
Place of birth for the foreign-born population - Sierra Leone (%)
Place of birth for the foreign-born population - Other Western Africa (%)
Place of birth for the foreign-born population - Australia (%)
Place of birth for the foreign-born population - New Zealand (%)
Place of birth for the foreign-born population - Fiji (%)
Place of birth for the foreign-born population - Micronesia (%)
Place of birth for the foreign-born population - Bahamas (%)
Place of birth for the foreign-born population - Barbados (%)
Place of birth for the foreign-born population - Cuba (%)
Place of birth for the foreign-born population - Dominica (%)
Place of birth for the foreign-born population - Dominican Republic (%)
Place of birth for the foreign-born population - Grenada (%)
Place of birth for the foreign-born population - Haiti (%)
Place of birth for the foreign-born population - Jamaica (%)
Place of birth for the foreign-born population - St. Vincent and the Grenadines (%)
Place of birth for the foreign-born population - Trinidad and Tobago (%)
Place of birth for the foreign-born population - West Indies (%)
Place of birth for the foreign-born population - Other Caribbean (%)
Place of birth for the foreign-born population - Belize (%)
Place of birth for the foreign-born population - Costa Rica (%)
Place of birth for the foreign-born population - El Salvador (%)
Place of birth for the foreign-born population - Guatemala (%)
Place of birth for the foreign-born population - Honduras (%)
Place of birth for the foreign-born population - Mexico (%)
Place of birth for the foreign-born population - Nicaragua (%)
Place of birth for the foreign-born population - Panama (%)
Place of birth for the foreign-born population - Other Central America (%)
Place of birth for the foreign-born population - Argentina (%)
Place of birth for the foreign-born population - Bolivia (%)
Place of birth for the foreign-born population - Brazil (%)
Place of birth for the foreign-born population - Chile (%)
Place of birth for the foreign-born population - Colombia (%)
Place of birth for the foreign-born population - Ecuador (%)
Place of birth for the foreign-born population - Guyana (%)
Place of birth for the foreign-born population - Peru (%)
Place of birth for the foreign-born population - Uruguay (%)
Place of birth for the foreign-born population - Venezuela (%)
Place of birth for the foreign-born population - Other South America (%)
Place of birth for the foreign-born population - Canada (%)
Place of birth for the foreign-born population - Other Northern America (%)
Place of birth for the foreign-born population - Other (%)
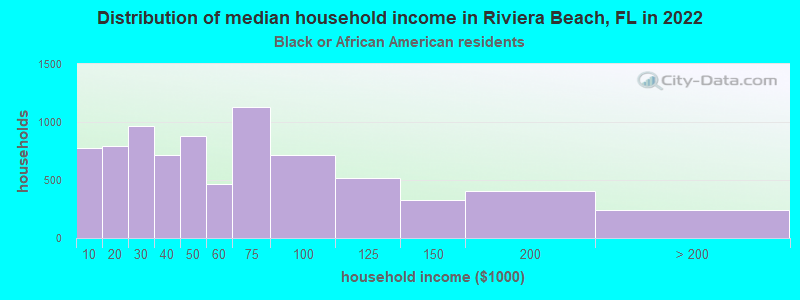
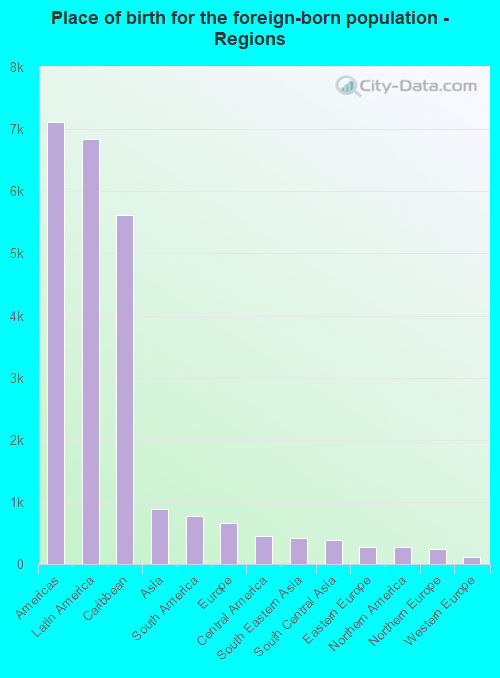
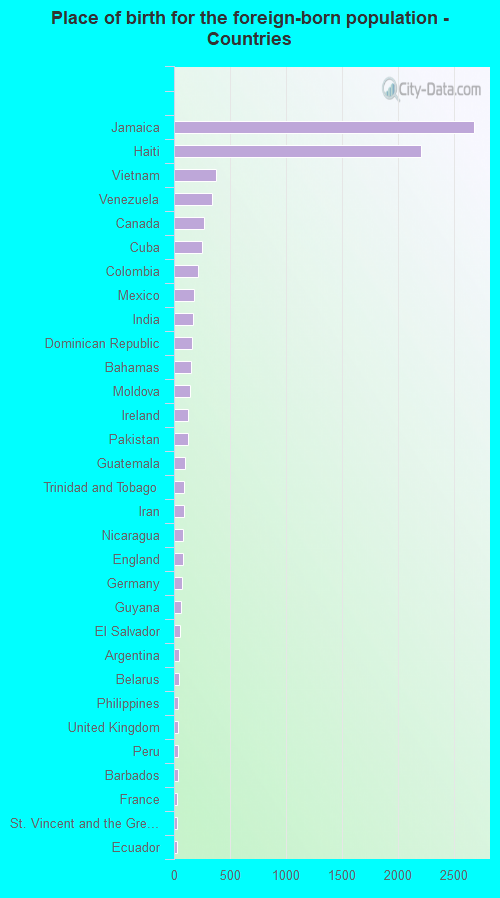
According to 2022 data, the most numerous races in Riviera Beach, FL are White alone (7,758 residents), Hispanic (2,999 residents), and Black alone (24,871 residents). 80.8% of Riviera Beach residents speak English at home. 22.6% of Riviera Beach, FL residents are foreign-born (17.6% born in Latin America, 2.3% born in Asia), which is 7.2% greater than the foreign-born rate of 21.0% across the entire state of Florida.
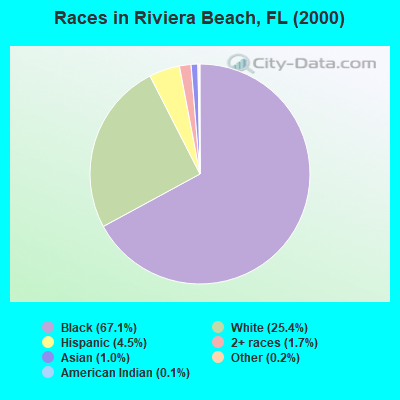
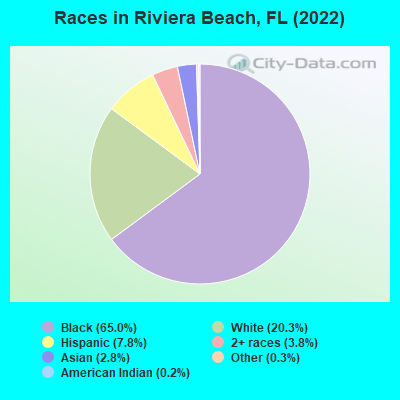
Race distribution in Riviera Beach
2000 2022
10,458,509 65.4% White alone 2,682,715 16.8% Hispanic 2,264,268 14.2% Black alone 261,693 1.6% Asian alone 236,954 1.5% Two or more races 42,358 0.3% American Indian alone 28,994 0.2% Other race alone 6,887 0.04% Native Hawaiian and Other
11,309,403 50.8% White alone 6,025,039 27.1% Hispanic 3,241,015 14.6% Black alone 861,630 3.9% Two or more races 623,692 2.8% Asian alone 152,054 0.7% Other race alone 22,504 0.1% American Indian alone 9,486 0.04% Native Hawaiian and Other
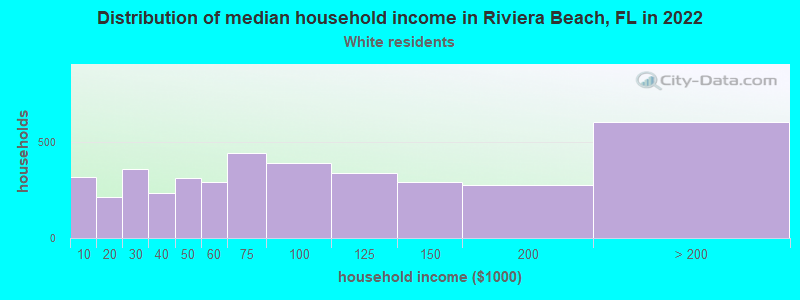
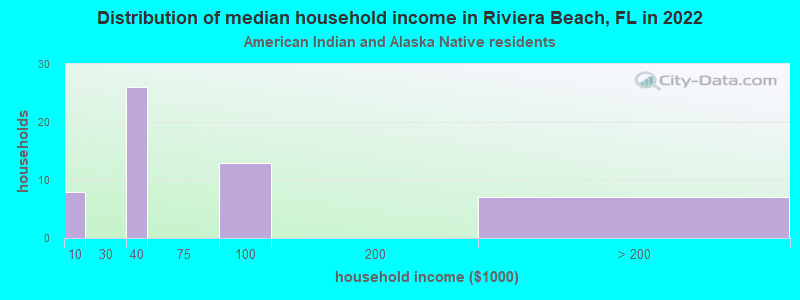
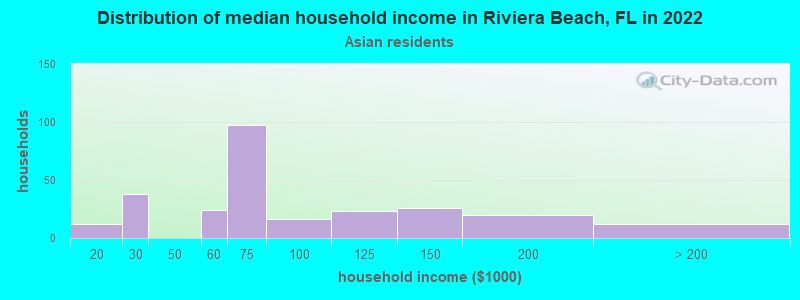
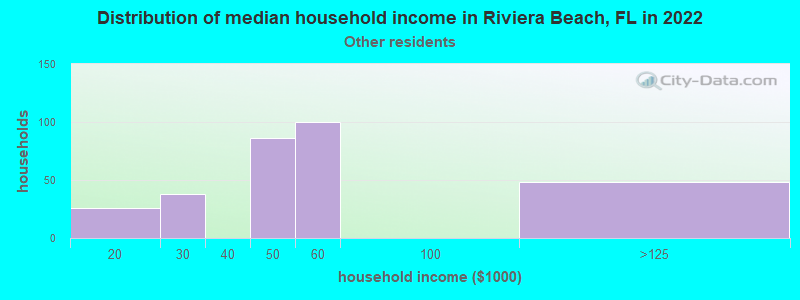
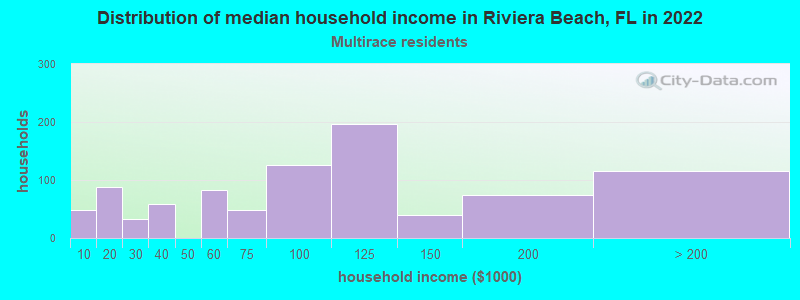
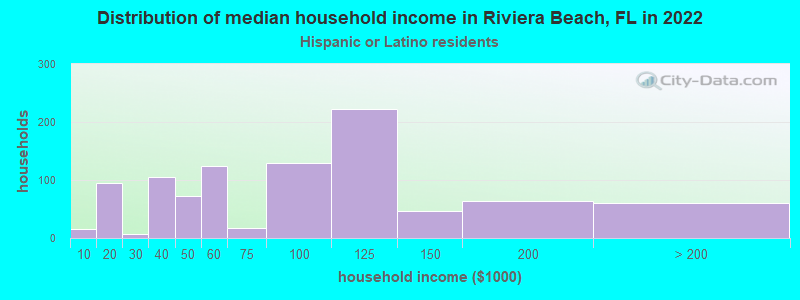
Income and house value in Riviera Beach Median household income in 2022 $70,230 White non-Hispanic householders$46,915 Black householders$80,695 Asian householders$52,180 Some other race householders$93,229 Two or more races householders$82,974 Hispanic or Latino race householdersMedian 2022 house value $531,310 White Non-Hispanic householders$264,890 Black or African American householders $427,341 Asian householders$525,576 Native Hawaiian and other Pacific Islander householders$430,017 Some other race householders$254,188 Two or more races householders$411,670 Hispanic or Latino householders
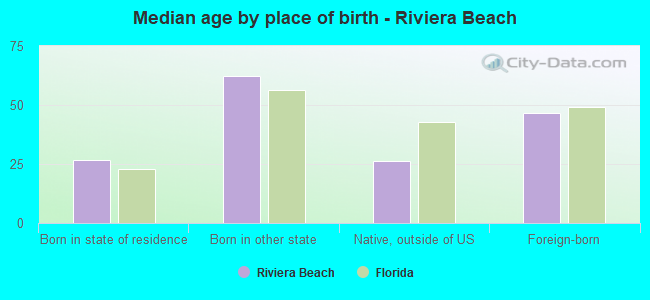
Median age by race in Riviera Beach
61.6 Median age for White residents60.5 63.1 34.5 Median age for Black or African American residents32.5 36.1 60.4 Median age for American Indian / Alaska Native residents32.2 -660,098,521.5 35.5 Median age for Asian residents35.5 40.4 -674,285,713.6 Median age for Native Hawaiian / Pacific Islander residents-674,264,006.9 -672,397,325.0 26.2 Median age for Other race residents25.9 36.4 29.7 Median age for Two or more races residents28.0 29.9 61.4 Median age for White alone residents61.3 61.6 37.3 Median age for Hispanic or Latino residents37.1 38.4
Owner/renter occupied households by race in Riviera Beach
House owners and renters - White residents 2,910 70.9% Owner occupied1,197 29.1% Renter occupiedHouse owners and renters - Black or African American residents 4,144 51.5% Owner occupied3,902 48.5% Renter occupiedHouse owners and renters - American Indian / Alaska Native residents 32 69.8% Owner occupied14 30.2% Renter occupiedHouse owners and renters - Asian residents 226 84.0% Owner occupied43 16.0% Renter occupiedHouse owners and renters - Other race residents 109 33.5% Owner occupied217 66.5% Renter occupiedHouse owners and renters - Two or more races residents 495 53.6% Owner occupied428 46.4% Renter occupiedHouse owners and renters - White alone residents 2,818 69.7% Owner occupied1,224 30.3% Renter occupiedHouse owners and renters - Hispanic or Latino residents 548 55.3% Owner occupied442 44.7% Renter occupied
Language usage in Riviera Beach
English speakers - Total 80.8% of residents of Riviera Beach speak English at home.
7.2% of residents speak Spanish at home 1,364 53.4% Speak English very well1,190 46.6% Speak English less than very well11.9% of residents speak other language at home 2,095 49.4% Speak English very well2,150 50.6% Speak English less than very well
English speakers - Born in the United States 93.8% of residents of Riviera Beach speak English at home.
2.8% of residents speak Spanish at home 178 67.9% Speak English very well84 32.1% Speak English less than very well3.7% of residents speak other language at home 315 90.3% Speak English very well34 9.7% Speak English less than very well
English speakers - Native, born elsewhere 63.0% of residents of Riviera Beach speak English at home.
29.9% of residents speak Spanish at home 169 52.3% Speak English very well154 47.7% Speak English less than very well11.6% of residents speak other language at home 69 55.2% Speak English very well56 44.8% Speak English less than very well
English speakers - Foreign-born 45.4% of residents of Riviera Beach speak English at home.
17.4% of residents speak Spanish at home 642 42.9% Speak English very well854 57.1% Speak English less than very well36.8% of residents speak other language at home 1,129 35.7% Speak English very well2,035 64.3% Speak English less than very well
White (Caucasian) - Speak only English Native:
92.7% (6,444)Foreign-born:
55.9% (502)
White (Caucasian) - Speak another language Native:
6.9% (481)Foreign-born:
54.1% (487)
Black or African American - Speak only English Native:
94.6% (16,427)Foreign-born:
60.4% (3,118)
Black or African American - Speak another language Native:
4.7% (824)Foreign-born:
37.1% (1,916)
Asian - Speak only English Native:
6.3% (12)Foreign-born:
12.0% (90)
Asian - Speak another language Native:
83.0% (160)Foreign-born:
87.5% (658)
Other race - Speak only English Native:
38.7% (186)Foreign-born:
4.6% (19)
Other race - Speak another language Native:
61.4% (294)Foreign-born:
95.5% (391)
Two or more races - Speak only English Native:
81.7% (1,292)Foreign-born:
8.1% (107)
Two or more races - Speak another language Native:
15.6% (247)Foreign-born:
91.6% (1,204)
White alone - Speak only English Native:
95.9% (6,409)Foreign-born:
57.0% (538)
White alone - Speak another language Native:
4.1% (272)Foreign-born:
44.9% (424)
Hispanic or Latino - Speak only English Native:
37.1% (493)Foreign-born:
1.9% (29)
Hispanic or Latino - Speak another language Native:
62.9% (836)Foreign-born:
98.2% (1,472)
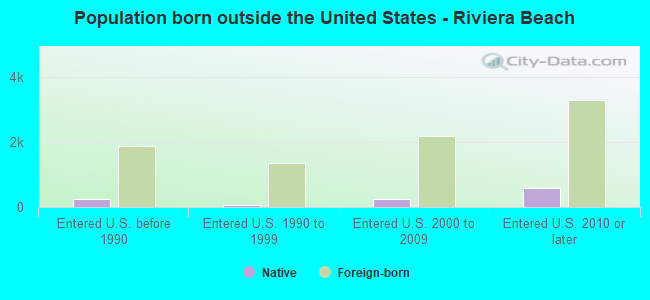
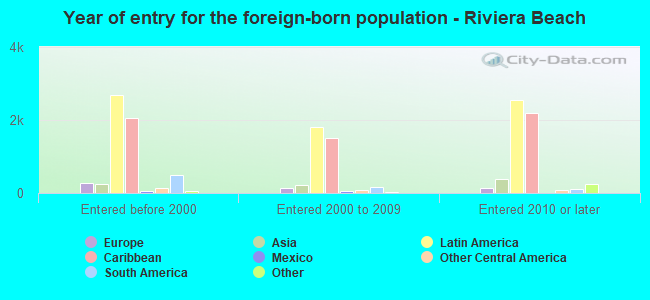
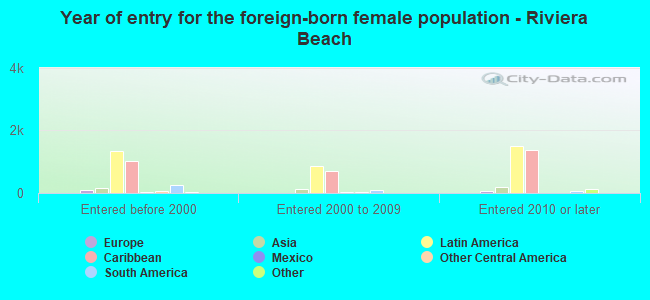
Foreign-born residents in Riviera Beach 8,655 residents are foreign born (17.6% Latin America , 2.3% Asia ).
This city:
22.6%Florida:
21.1%
Marital status for residents in Riviera Beach Marital status - White (Caucasian) population 15 years and over
Males 29.4% Never married45.7% Now married4.8% Separated4.2% Widowed16.0% DivorcedFemales 20.5% Never married46.4% Now married0.7% Separated13.0% Widowed19.4% DivorcedWomen who gave birth in the past 12 months Now married:
100.0% (60)Unmarried:
0.0% (0)
Women who did not give birth in the past 12 months Now married:
34.0% (346)Unmarried:
66.0% (673)
Marital status - Black or African American population 15 years and over
Males 49.3% Never married35.5% Now married1.2% Separated1.9% Widowed12.0% DivorcedFemales 43.6% Never married26.5% Now married3.1% Separated12.3% Widowed14.5% DivorcedWomen who gave birth in the past 12 months Now married:
24.5% (112)Unmarried:
75.5% (346)
Women who did not give birth in the past 12 months Now married:
28.7% (1,710)Unmarried:
71.3% (4,256)
Marital status - American Indian / Alaska Native population 15 years and over
Males 71.4% Never married28.6% Now married0.0% Separated0.0% Widowed0.0% DivorcedFemales 64.9% Never married35.1% Now married0.0% Separated0.0% Widowed0.0% DivorcedMarital status - Asian population 15 years and over
Males 26.1% Never married57.7% Now married8.5% Separated0.0% Widowed7.7% DivorcedFemales 19.2% Never married66.7% Now married0.0% Separated9.7% Widowed4.4% DivorcedWomen who gave birth in the past 12 months Now married:
66.3% (63)Unmarried:
33.7% (32)
Women who did not give birth in the past 12 months Now married:
61.7% (113)Unmarried:
38.3% (70)
Marital status - Other race population 15 years and over
Males 59.3% Never married27.4% Now married0.0% Separated0.0% Widowed13.3% DivorcedFemales 15.8% Never married40.5% Now married0.0% Separated36.3% Widowed7.4% DivorcedWomen who gave birth in the past 12 months Now married:
76.7% (37)Unmarried:
23.3% (11)
Women who did not give birth in the past 12 months Now married:
56.6% (48)Unmarried:
43.4% (37)
Marital status - Two or more races population 15 years and over
Males 56.4% Never married22.5% Now married2.2% Separated1.5% Widowed17.4% DivorcedFemales 46.7% Never married23.4% Now married1.3% Separated8.0% Widowed20.5% DivorcedWomen who gave birth in the past 12 months Now married:
0.0% (0)Unmarried:
100.0% (32)
Women who did not give birth in the past 12 months Now married:
22.5% (124)Unmarried:
77.5% (428)
Marital status - White alone, not Hispanic / Latino population 15 years and over
Males 25.6% Never married49.0% Now married4.8% Separated4.8% Widowed15.7% DivorcedFemales 20.7% Never married47.4% Now married0.2% Separated13.3% Widowed18.4% DivorcedWomen who gave birth in the past 12 months Now married:
100.0% (58)Unmarried:
0.0% (0)
Women who did not give birth in the past 12 months Now married:
30.5% (298)Unmarried:
69.5% (679)
Marital status - Hispanic or Latino population 15 years and over
Males 49.6% Never married28.5% Now married1.9% Separated0.0% Widowed19.9% DivorcedFemales 33.4% Never married30.1% Now married1.9% Separated9.6% Widowed25.0% DivorcedWomen who gave birth in the past 12 months Now married:
54.5% (37)Unmarried:
45.5% (31)
Women who did not give birth in the past 12 months Now married:
35.0% (185)Unmarried:
65.0% (345)
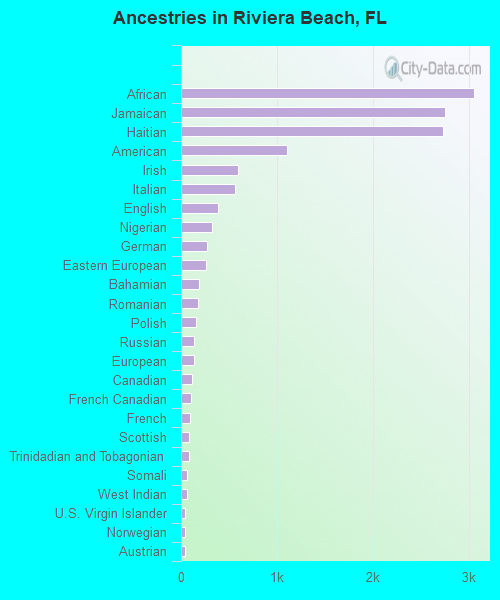
Ancestries in Riviera Beach
3,057 12.9% African2,751 11.6% Jamaican2,727 11.5% Haitian1,101 4.7% American598 2.5% Irish566 2.4% Italian382 1.6% English320 1.4% Nigerian267 1.1% German258 1.1% Eastern European190 0.8% Bahamian174 0.7% Romanian156 0.7% Polish139 0.6% Russian132 0.6% European112 0.5% Canadian107 0.5% French Canadian98 0.4% French87 0.4% Scottish85 0.4% Trinidadian and Tobagonian66 0.3% Somali66 0.3% West Indian46 0.2% U.S. Virgin Islander45 0.2% Norwegian41 0.2% Austrian39 0.2% Hungarian34 0.1% Iranian33 0.1% Portuguese31 0.1% Greek31 0.1% Guyanese25 0.1% Barbadian24 0.1% British22 0.09% Czechoslovakian19 0.08% Scandinavian15 0.06% Slovak14 0.06% Lithuanian12 0.05% Jordanian10 0.04% Latvian10 0.04% Scotch-Irish9 0.04% Slovene9 0.04% Czech9 0.04% Dutch West Indian7 0.03% Brazilian6 0.03% Croatian6 0.03% Finnish5 0.02% Swedish5 0.02% Lebanese5 0.02% Yugoslavian4 0.02% Dutch4 0.02% British West Indian4 0.02% Luxembourger4 0.02% Albanian
Geographical mobility in Riviera Beach Same house 1 year ago 6,922 87.0% White (Caucasian)22,060 89.8% Black or African American136 100.0% American Indian / Alaska Native855 87.1% Asian29 100.0% Native Hawaiian / Pacific Islander676 70.8% Other race2,850 89.7% Two or more races6,630 85.9% White alone, not Hispanic / Latino2,623 88.1% Hispanic or LatinoMoved within same county 478 6.0% White / Caucasian2,017 8.2% Black or African American79 8.0% Asian264 27.7% Other race69 2.2% Two or more races539 7.0% White alone, not Hispanic / Latino234 7.9% Hispanic or LatinoMoved within same state 147 1.9% White / Caucasian315 1.3% Black or African American165 5.2% Two or more races98 1.3% White alone, not Hispanic / Latino71 2.4% Hispanic or LatinoMoved from different state 284 3.6% White / Caucasian51 0.2% Black or African American37 1.2% Two or more races299 3.9% White alone, not Hispanic / Latino11 0.4% Hispanic or LatinoMoved from abroad 86 1.1% White152 0.6% Black or African American104 1.3% White alone, not Hispanic / Latino5 0.2% Hispanic or Latino
Children Nativity (place of birth) in Riviera Beach
Children under 6 years - Living with two parents Both parents native 322 99.7% Native1 0.3% Foreign-bornBoth parents foreign-born 658 92.7% Native51 7.3% Foreign-bornOne native, one foreign-born parent 293 100.0% NativeChildren under 6 years - Living with one parent Native parent 1,199 100.0% NativeForeign-born parent 595 93.1% Native44 6.9% Foreign-bornChildren 6 to 17 years - Living with two parents Both parents native 1,178 100.0% NativeBoth parents foreign-born 453 88.9% Native57 11.1% Foreign-bornOne native, one foreign-born parent 355 100.0% NativeChildren 6 to 17 years - Living with one parent Native parent 1,598 100.0% NativeForeign-born parent 949 60.5% Native620 39.5% Foreign-born
Grandparents responsible for own grandchildren in Riviera Beach
Grandparents (30 to 59 years) Black or African American 327 61.5% Responsible for grandchildren205 38.5% Not responsible for grandchildrenAsian 20 100.0% Not responsible for grandchildrenOther race 14 100.0% Responsible for grandchildrenHispanic or Latino 8 100.0% Responsible for grandchildrenGrandparents (60 years and over) Black or African American 234 43.2% Responsible for grandchildren307 56.8% Not responsible for grandchildrenAsian 69 100.0% Not responsible for grandchildrenHispanic or Latino 13 62.8% Responsible for grandchildren8 37.2% Not responsible for grandchildren